Avoid Overspending With Kubecost
 Anurag Kumar
Introduction
We all have heard on the internet, unfortunate stories about the people who have left their instances as it as after using and at the time of monthly bill they were more than shocked. They have never anticipated the bill that they get at the end of the month.

Image credits - this twitter post
The above image is not intended to make fun of any company or individual. Don't take it seriously
The image above is in the context of Linux Instances, but this is true in the context of spinning up Kubernetes cluster as well. Earlier, the major cloud providers were not letting you in advance the rough estimate of your cost. I have even heard people on the internet saying that the whole system was designed in such a manner that they can get the maximum money out of your pocket. Also, It is not a good idea to use something or buy something without knowing the cost in prior.
Now coming to kubecost, I am sure that after hearing about all the tools around Kubernetes you must have guesses it right. The name itself starts with kube so it's obvious that this is somehow related to Kubernetes. The cost word is somewhat related to your cloud bills in this context. I think you have got the intuitive idea of what kubecost is? Now, let's discuss about the problem that was there and how kubecost is solving the problem?
What was the problem?
When you move to Kubernetes, then you have no idea about the cost. Earlier You had no idea where you're spending, then there is no question about optimizing your cost. You do not have any idea which namespace is costing you the most? Or which pod or deployment is costing you the most? You need to visualize your spending precisely if you want to save the cost or use the underlying resources effectively.
How kubecost is trying to solve the cost problem?
- Kubecost brings cost monitoring and cost optimization solutions for teams that are running applications on top of kubernetes.
- Kubecost is trying to optimize your Kubernetes cost so that you can save your cloud bills with optimizations and efficiency of your Kubernetes resources.
Architecture of Kubecost
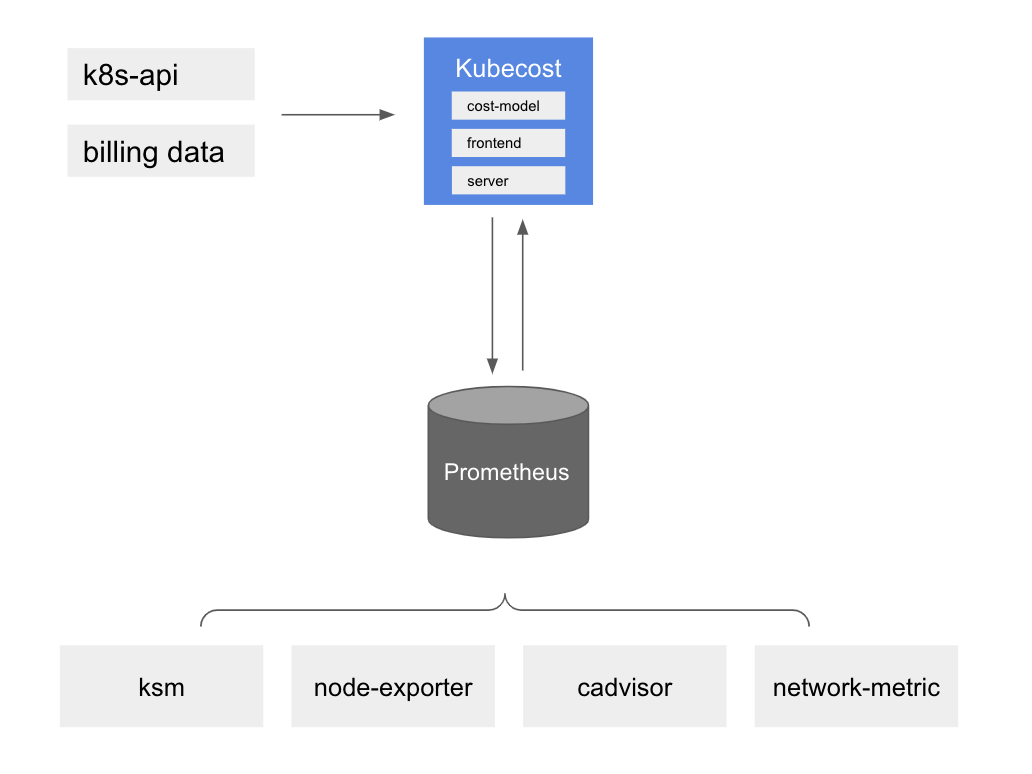
kubecost pod ingests data from the kubernetes API and billing data sets from the respective cloud provider and then it exposes those metrics (like the cost of a node, cost of a loadbalancer etc.) and then prometheus scrapes those metrics.
Kubecost pod also get the metrics from kube-state-metrics, node exporter, cadvisor and network-metric from the Linux kernel.
cadvisor exposes metrics from the core of the kubelet. It runs as the process inside the kubelet. cadvisor exposes the utilization metrics like memory consumption by individual container, cpu shared by individual container. This is responsible for sharing the usage metrics
Lab Section
- I will be spinning up a Linux instance, and then I will be creating a k3s cluster on top of that.
- One thing to notice here is that if you're using k3s and trying out the standard helm installation, then that will not work.
- You need to run
export KUBECONFIG=~/etc/rancher/k3s/k3s.yaml
Installing Kubecost
- I will follow the standard helm installation.
helm repo add kubecost https://kubecost.github.io/cost-analyzer/ helm upgrade --install kubecost kubecost/cost-analyzer --namespace kubecost --create-namespace - After installation, you should see something like this.
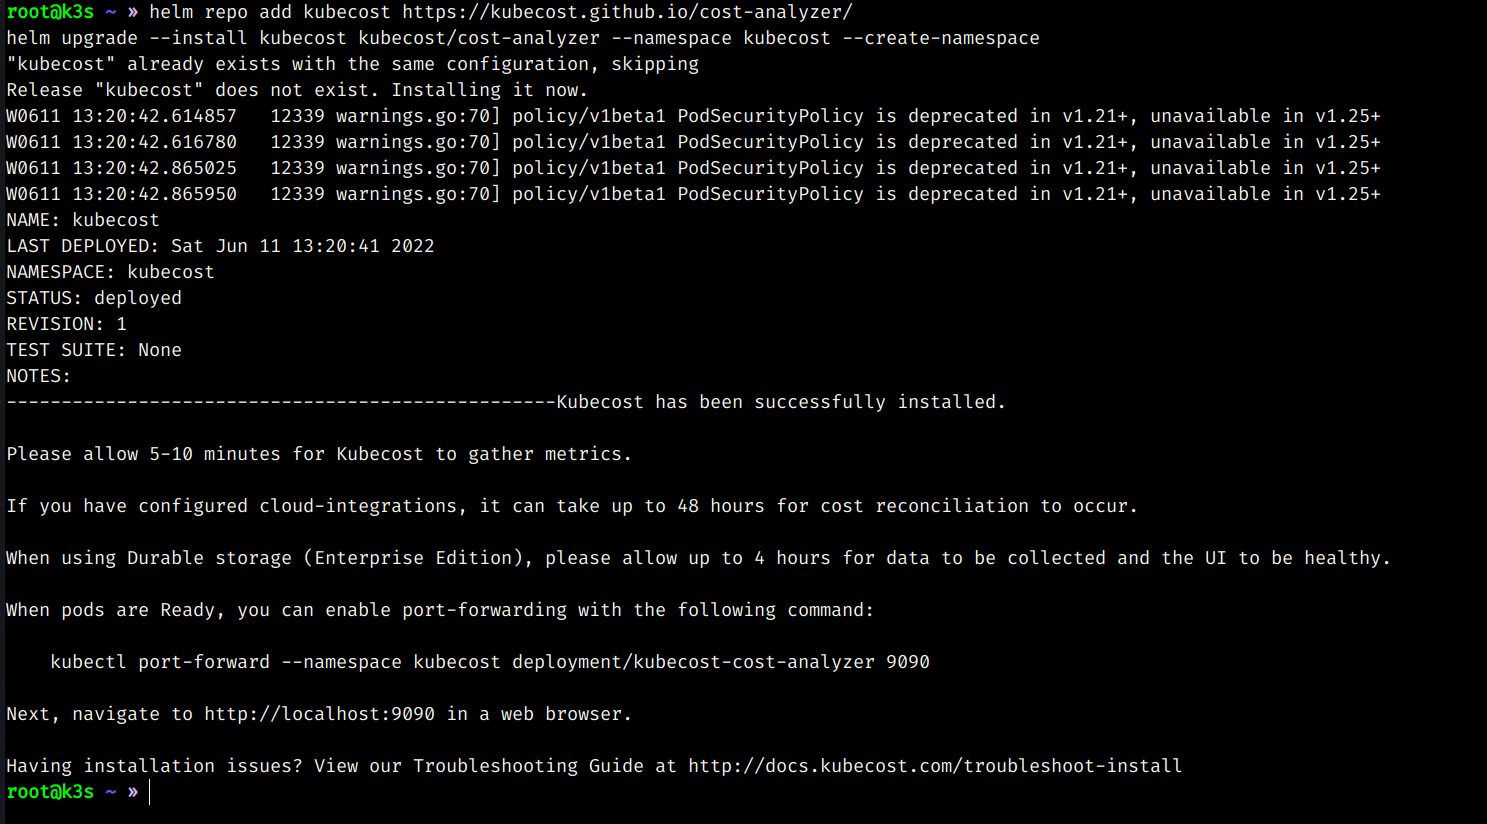
- We will port-forward the deployment to our local system
kubectl port-forward -n kubecost deployment/kubecost-cost-analyzer 9090 & - Go to your browser and type
localhost:9090 - This is the first screen that you will see.
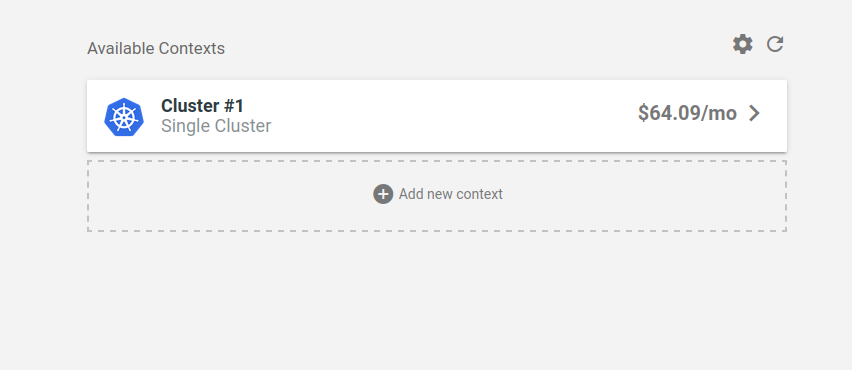
- You can add multiple context here, but In this case I will stick to one.
Navigating Kubecost
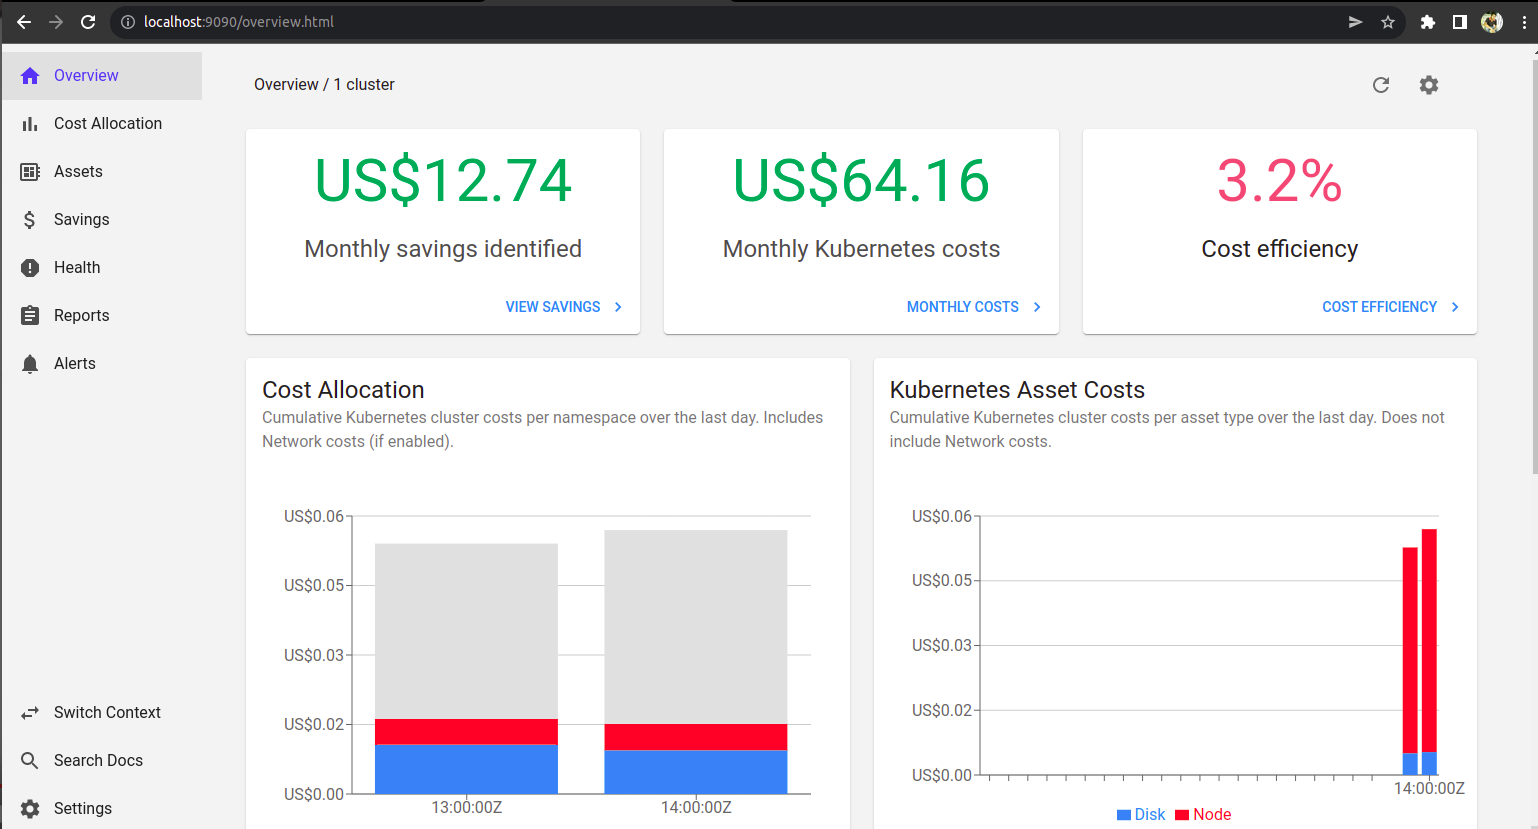
- You can see the detailed visualiztion on the cost allocation page, and you can filter relevant information according to your will.

- You can visualize the health status of your Kubernetes workload.
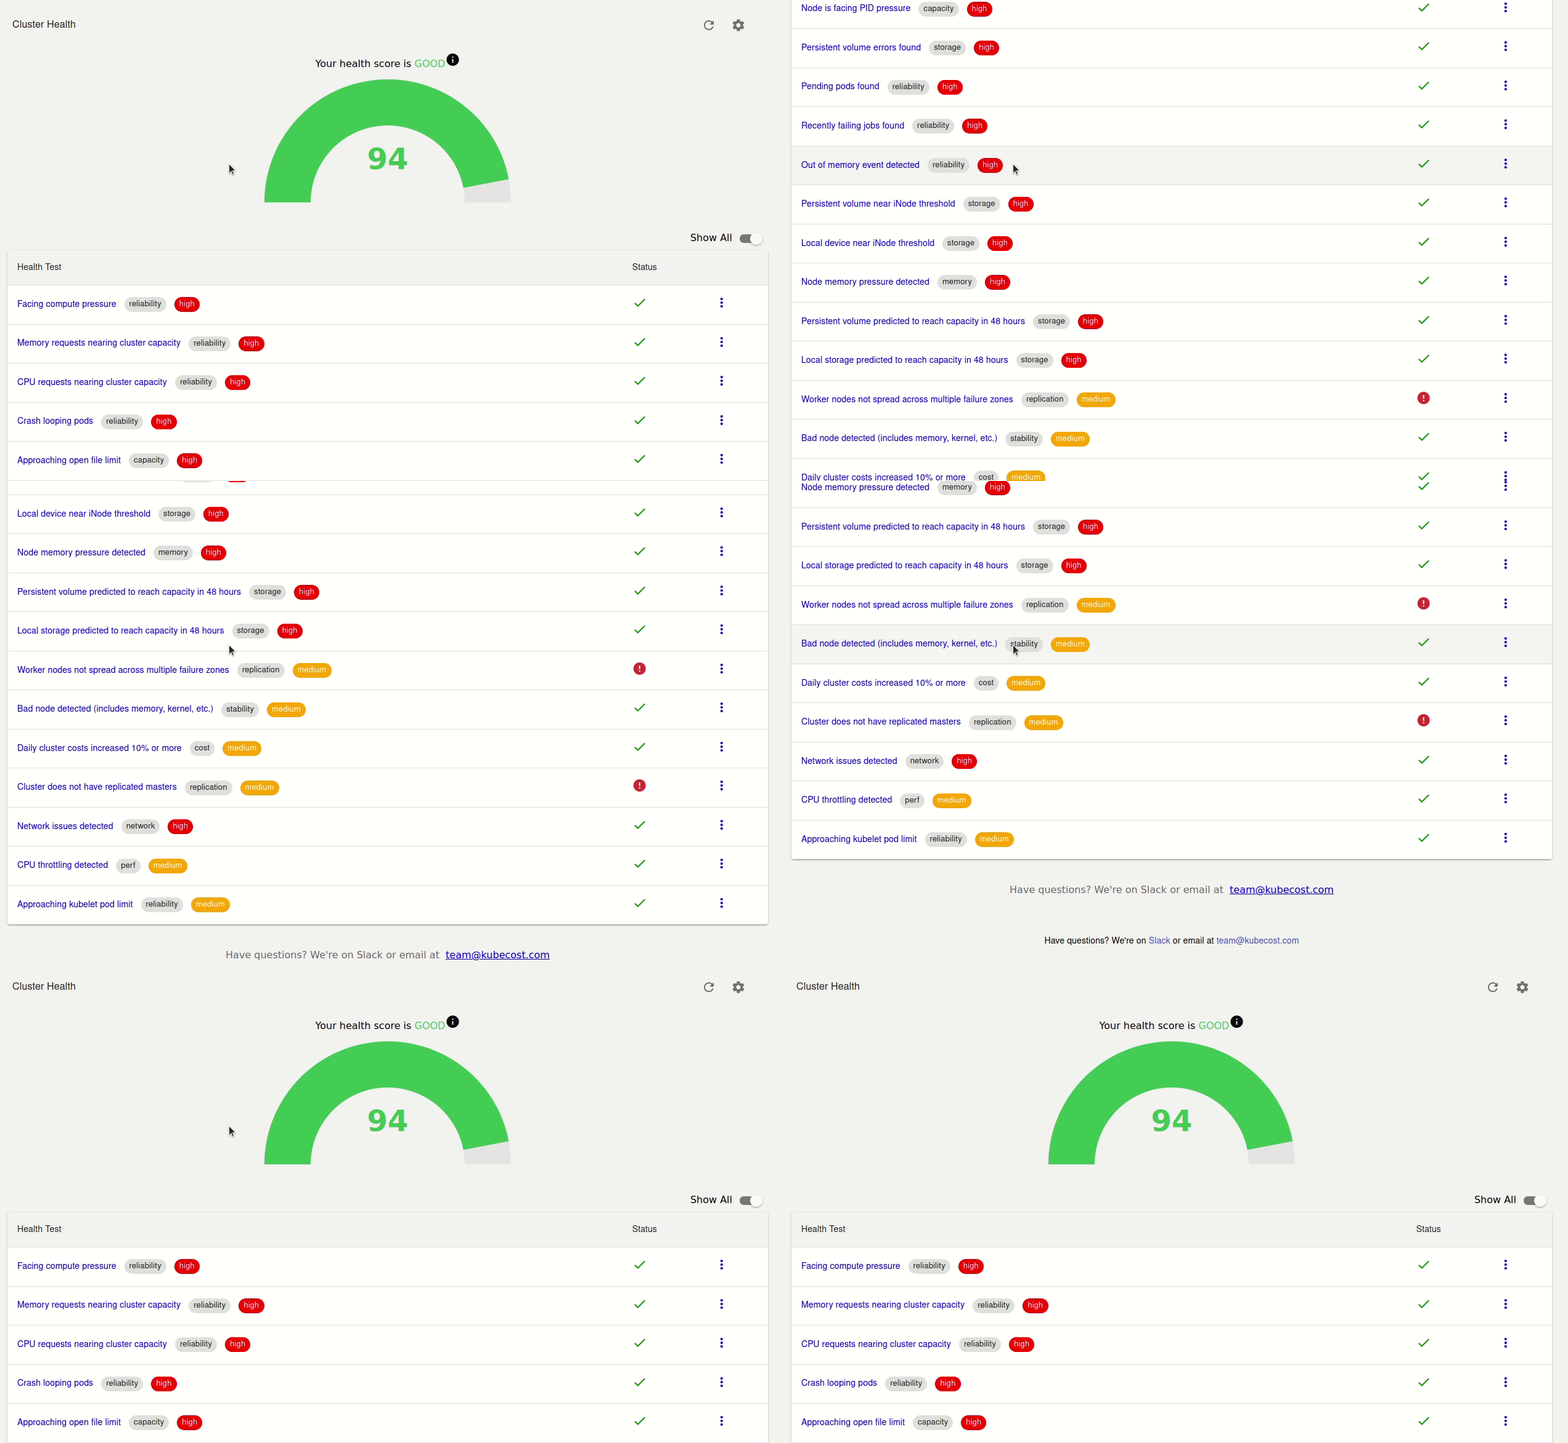
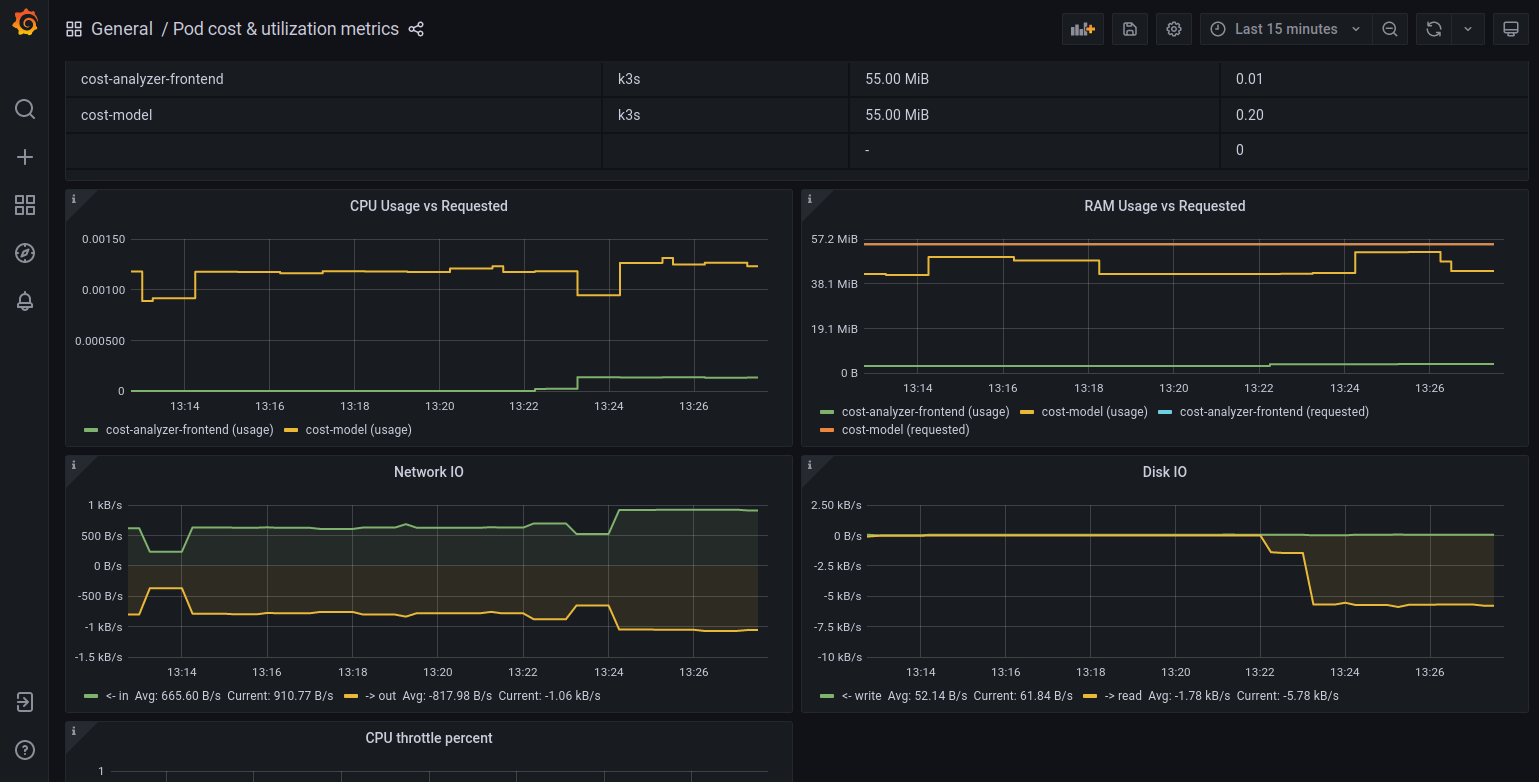
- If you want, then you can visualize the same data with Grafana dashboard. Click on savings and select the section you want to visualize.
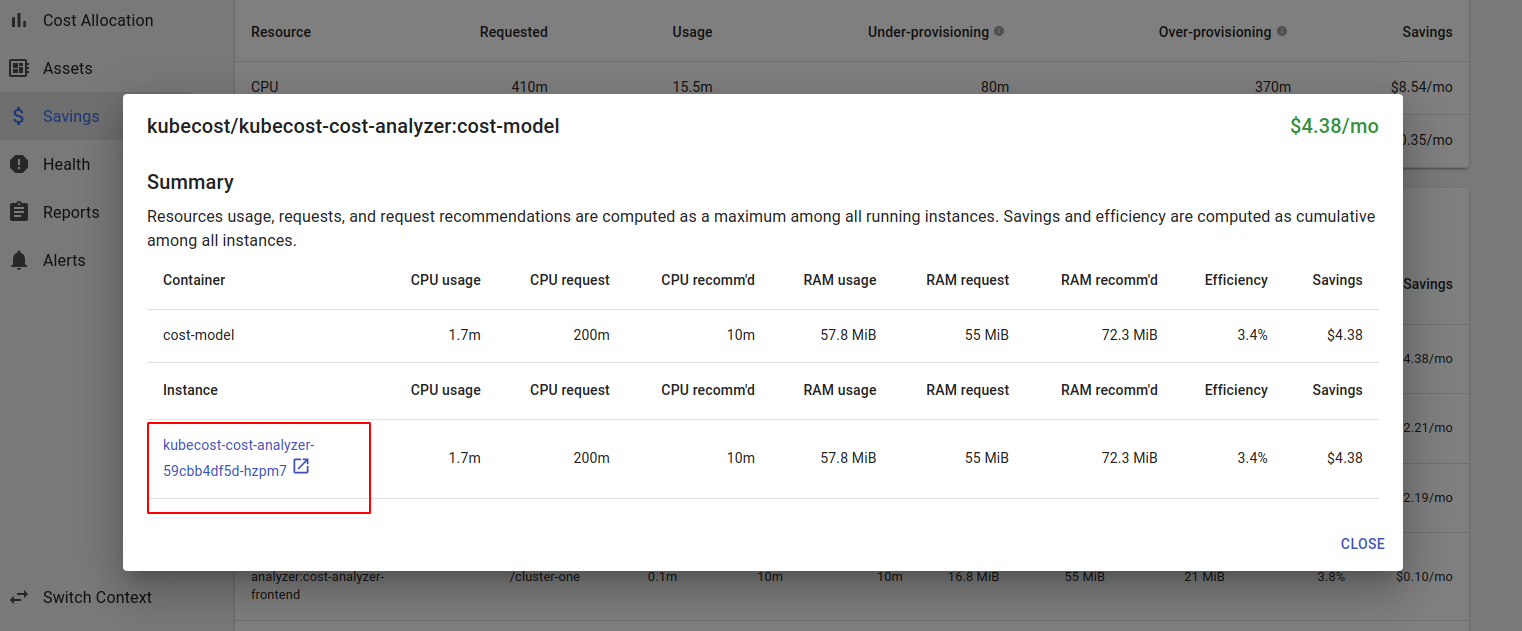
- You will see a Grafana dashboard link, and clicking on that will open a Grafana dashboard in a new tab.
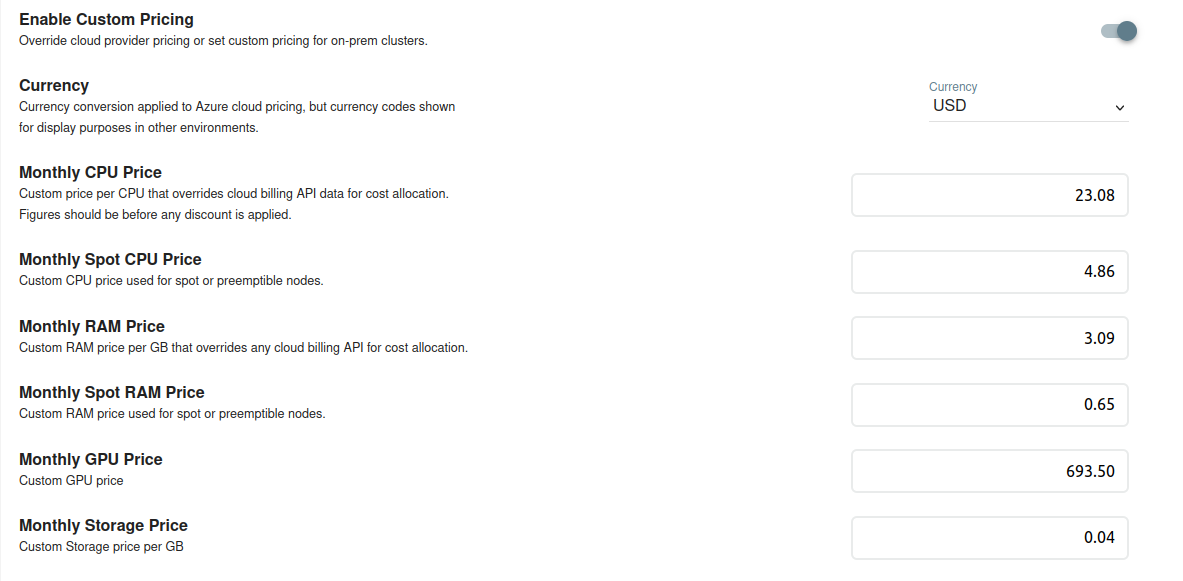
You can also set pricing data that is specific to your account, and kubecost will generate the billing data specifically for you. By default, kubecost measures your expenses based on the pricing of the cloud providers pricing which is available in the public, but it also gives you the flexibility to overwrite this with your own custom pricing. To configure, we need to go to the settings page and put the prices and kubecost will do the work.
- You can also set out the alerts as well, which I have not explored in this article.
Working with kubecost CLI
- kubecost also provides CLI that extends with the kubectl that we use to interact with kubernetes. You can read more about the extension of kubectl via plugins here
With the kubecost CLI, you can analyze and have a look at all the cost right from your terminal. It goes without saying that for the functioning of the CLI, all the deployments should be running in the kubecost namespace, If not then troubleshoot it.
Make sure that the binary is located at the
/usr/local/bindirectory.We will be creating a binary from the source. Make sure you have go installed on your system if you're following this, if not then use the method described here. If you don't have go installed, checkout the installation instruction here
- Go to the GitHub page of kubectl-cost and clone that in your local system.
cd kubectl-cost/cmd/kubectl-cost go build . sudo mv kubectl-cost /usr/local/bin - I discovered
go build -o /usr/local/binwill be more straight forward. Mentioning here so that I don't forget it in future.
The first command that you're probably going to run is kubectl cost -h. This will give you a comprehensive view of all the things you can do with the CLI along with examples.
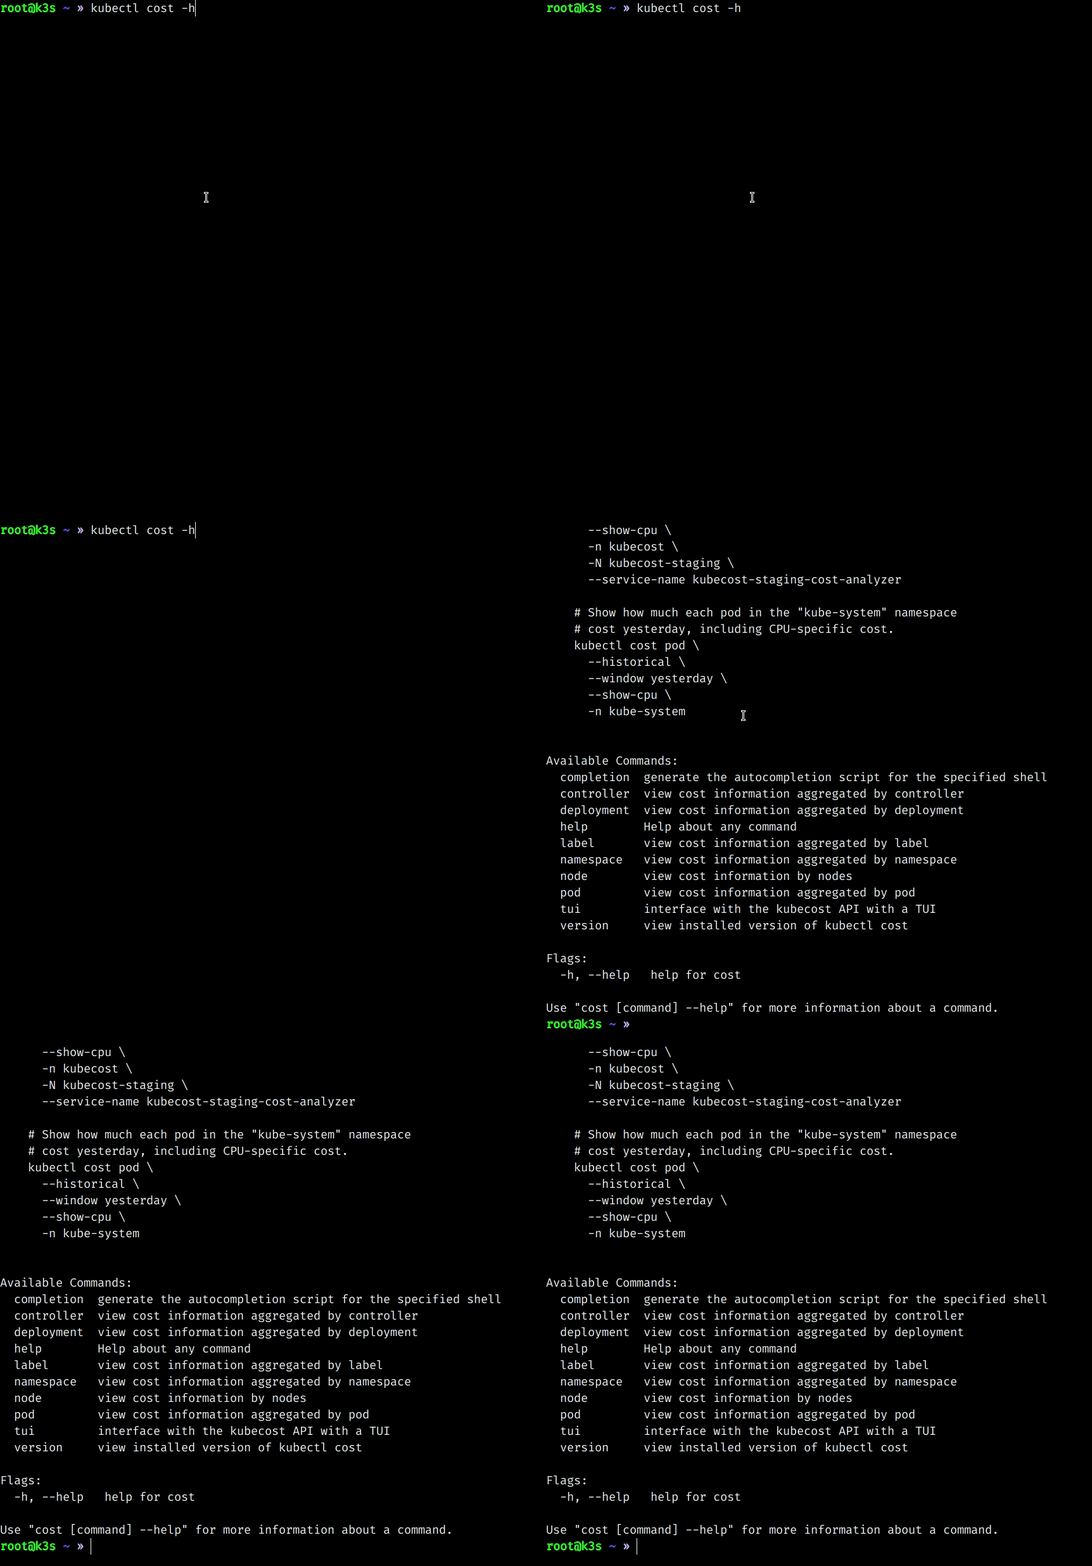
With the kubecost CLI you can filter out the cost on the basis of many kubernetes resources.
TUI (terminal user interface)
One of the things I loved about kubecost is it's TUI. If you have used k9s before, then this section will be similar to that. With TUI you can visualize everything in the terminal itself.
To run the TUI execute the command kubectl cost tui

If you notice, then we can see that we can get very granular cost details according to CPU, memory, GPU etc. We can also aggregate the data w.r.t deployment, pod etc. We can query the on the basis of time series like 1 day, 7 day etc.
- One another thing that's really cool about the kubecost is that it can monitor you in cluster as well as resources out of your cluster like storage and load balancers.
Opencost
Very recently the team behind kubecost along with collaboration from other companies have started a new community driven project which will bring standardization in the context of Kubernetes cost. Opencost aims to bring standardization in context of kubernetes cost. If you are familiar with other projects like open telemetry, then you would know how much benefit standardization brings to the table. Again, this is a very good community project, and it is in the CNCF sandbox project queue as of now. By joining CNCF, opencost will continue to drive the open innovation from the CNCF community.
You can read more about the announcements here
Reference
I will update this blog as I explore the kubecost project in more detail. Thank you for reading. If you have any suggestions regarding the blog or there is some scope for improvement, then please reach out to me.
Follow Kubesimplify on Hashnode, Twitter and Linkedin. Join our Discord server to learn with us.
Subscribe to my newsletter
Read articles from Anurag Kumar directly inside your inbox. Subscribe to the newsletter, and don't miss out.
Written by

Anurag Kumar
Anurag Kumar
Student