Sending VyOS Syslog to Graylog
 Bill Clark
Today, I'll be going over the basic configuration of Graylog (on a Docker host), as well as the necessary configuration on VyOS to send your logs into Graylog.
I've rebuilt my Graylog instance in my home lab a handful of times in the past and always relied on available Ubiquiti EdgeRouter content packs. Upon rebuilding my network using a VyOS VM as the router, the patterns were different enough that the EdgeRouter content packs were no longer helpful.
After rebuilding my Graylog instance in Docker in a fresh VM, I spent my afternoon putting together a group of about 30 extractors that will process various syslog messages from VyOS hosts and extract useful information from the messages for visualization. Extractors are based on grok patterns, which you can learn more about in the Using Grok Patterns to Extract Data section here: https://docs.graylog.org/docs/extractors.
Before we dive into it, you'll need the following:
A Linux server with the software below installed.
Required packages:
docker docker-compose wget pwgen sha256sumMine is an Ubuntu 22.04.1 VM with 2 vCPUs, 4GB RAM, and 160GB SSD. I went with 160GB SSD so that log retention wouldn't be too much of a concern--I'll get more than a year out of that in my home lab.
If you decide to go with Ubuntu 22.04.1, DigitalOcean has a great tutorial on installing Docker on Ubuntu 22.04. Once docker is installed, use
sudo apt update && sudo apt install docker-composeto install docker-compose.
A VyOS VM or Physical device configured and running.
Firewall rules on your VyOS VM to allow traffic from the Local zone out to whatever interface the Graylog server is on (open port 514/udp).
Configuring & Starting Graylog
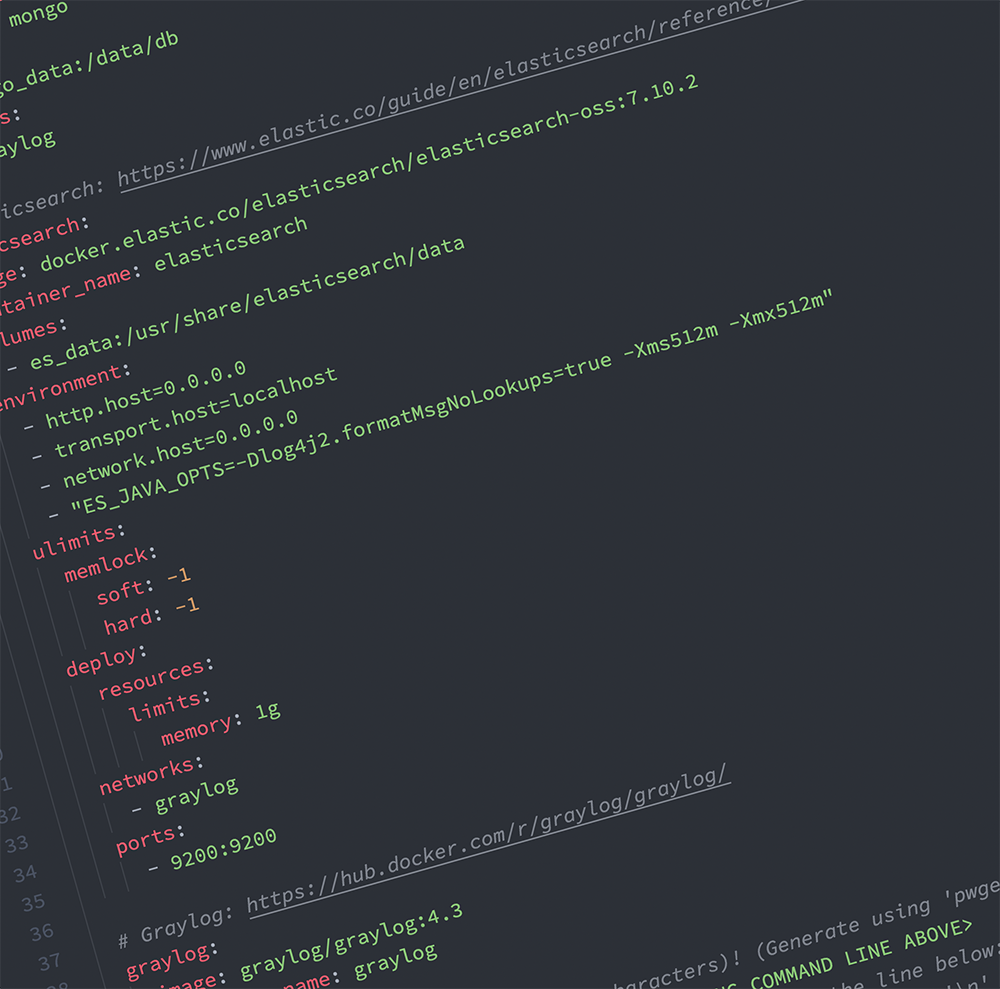
This part will be easy. I'm providing the docker-compose.yml file I used for my working stack at home. It's mostly lifted from the Graylog Docs page. I integrated the volumes for persistence as called out toward the end of that page and added container_name: and hostname: tags for some of the containers.
The first thing you want to do is get logged into your Linux server. Once logged in, you should be in your home directory. Create a new directory named graylog (mkdir graylog), then switch to that directory.
Initial Configuration
Now, you'll download the docker-compse.yml file using the wget command:
wget https://gist.githubusercontent.com/brav0charlie/5e62725a4c7e93cf64d74995065dc402/raw/f098c0aa3fca829ba97576da624eff3faf0f19ba/graylog-docker-compose.yml
Or you can just copy the text below and paste it into a new file:
Once the file is downloaded, rename it to docker-compose.yml. Open it up in nano or vim and read the notes at the top of the file. You'll need to replace some data on line 53 and line 56.
To generate the GRAYLOG_PASSWORD_SECRET, use the following command and paste the resulting password in place of <GENERATE ME USING COMMAND ABOVE> on line 53:
pwgen -N 1 -s 96
To generate the GRAYLOG_ROOT_PASSWORD_SHA2, use the following command. Paste the returned string in place of <GENERATE ME USING COMMAND ABOVE> on line 56.
echo -n "Enter Password: " && head -1 </dev/stdin | tr -d '\n' | sha256sum | cut -d" " -f1
After pasting the command above and hitting enter, you'll be prompted for a password. This will be displayed on the screen in plain text, so ensure you don't have any "shoulder surfers" behind you.
Once those two lines have been updated, save the file and exit.
Starting Graylog
Now, you'll want to start the stack! Type docker-compose up -d and hit enter. This will take a few minutes to download the container images and spin everything up. Viewing their logs, you can monitor each container's startup status. When Graylog is up and running, it will eventually print a logline that starts with a timestamp and reads: INFO : org.graylog2.bootstrap.ServerBootstrap - Graylog server up and running.
To view the logs of each container, use the command docker logs <container_name>. The three containers are named mongo, elasticsearch, and graylog.
Configuring Syslog UDP Input
Once you get Graylog up and running, you'll want to log into the server. The login URL will be http://<ip_or_hostname>:9000, so if your server's address is 10.0.1.50, it would be http://10.0.1.50:9000.
Log in using admin for the username, and the password you typed in when you generated the GRAYLOG_ROOT_PASSWORD_SHA2 above.
UPDATE: I've published a new Graylog Content Pack for VyOS over on GitHub. You can install this Content Pack, and it'll create the Syslog UDP Input, Extractors, and everything else you need to start monitoring VyOS logs in Graylog.
UPDATE: I've published a new Graylog Content Pack for VyOS over on GitHub. You can install this Content Pack, and it'll create the Syslog UDP Input, Extractors, and everything else you need to start monitoring VyOS logs in Graylog.
You can find this content pack here: brav0charlie/graylog-vyos. Install instructions are provided in the project's README.
Once logged in, click the System menu at the top and choose Inputs. Next, click the drop-down menu next to the Launch new input button and choose Syslog UDP (the last item in the list). Now click the Launch new input button.
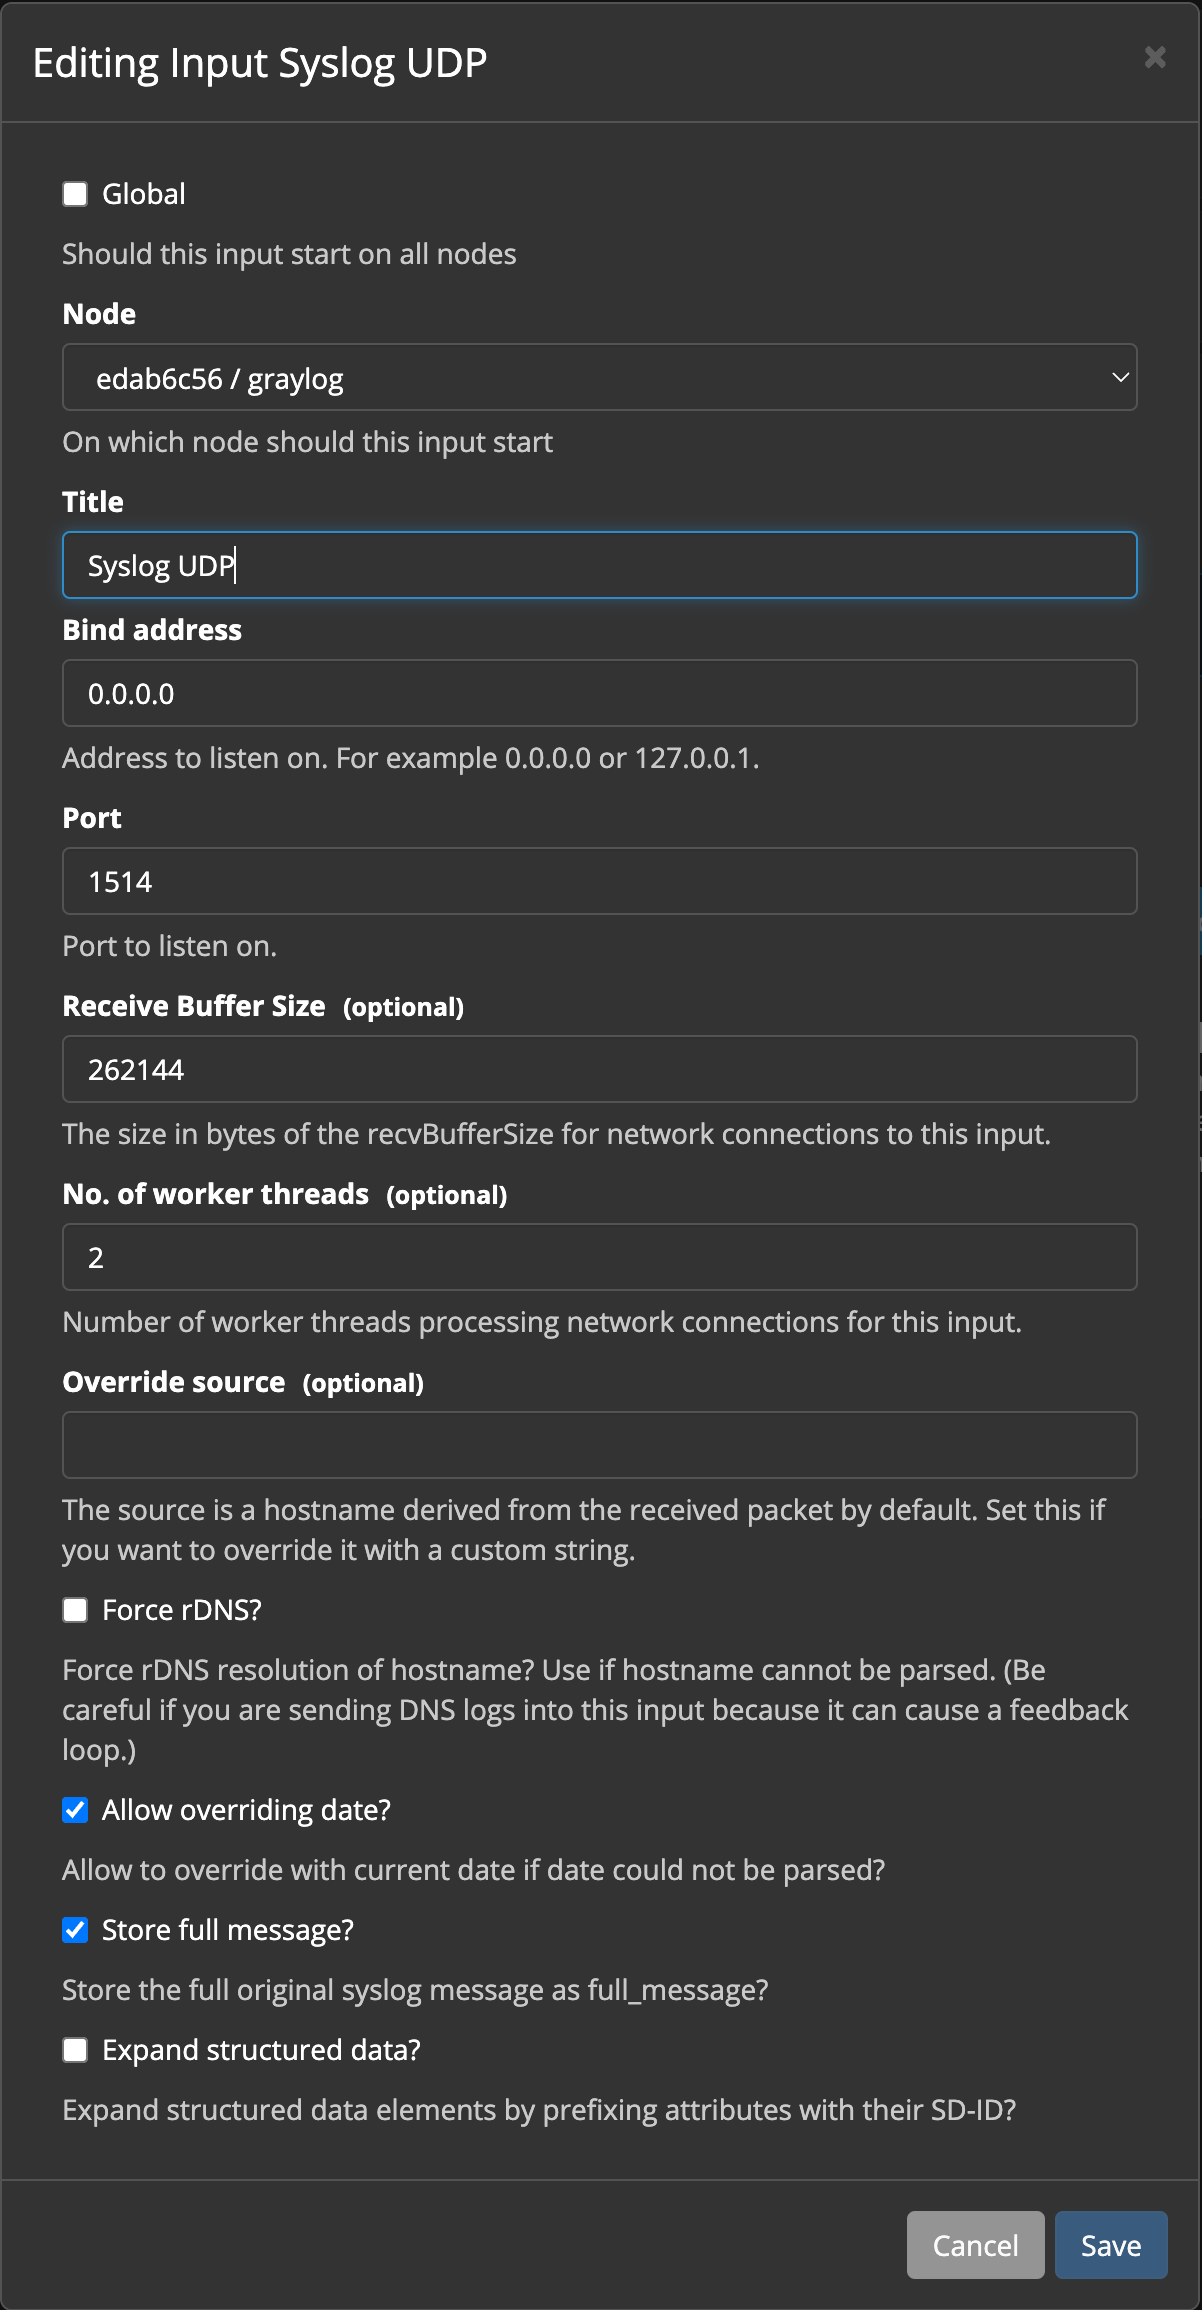
Now, set up your new input, so it matches the screenshot below. The items you'll add are the title (Syslog UDP), the port (1514), and place a check in Store full message. Click Save when you're done.

NOTE: You'll notice we're using Port 1514 here, but later in the doc, we'll use Port 514 when configuring VyOS. This is because normally, Graylog isn't running as root, and doesn't have access to ports 1-1024. We're using Docker to map Port 514 on the Docker Host to Port 1514 of the Graylog container.
Once you've saved your syslog input, click the Start input button.
Finally, you'll probably want to install some "extractors" on the input to handle extracting data from the messages and storing it as searchable fields. We'll use the ones I've created for my home lab to get you started.
Head over to this file on GitHub (GitHub Project Link). Copy the entire contents of the file to your clipboard. Now, go back to your Graylog web interface, click the System menu, and then choose Inputs.
On the right, next to your Syslog UDP input, you'll see a button titled Manage extractors. Click that button. Now at the top right, click the Actions button, and choose Import extractors.
In the large text field titled Extractors JSON, paste in the contents of your clipboard, then click the Add extractors to input button at the bottom.
You'll get a message that they've been added to your input. Click the Back button in your browser if it doesn't drop you back to the Extractors page. You should now see a bunch of extractors listed.
Setting up VyOS to Send Syslog to Graylog
Now for the final piece! Let's configure your VyOS instance to send its syslog over to Graylog.
First, get logged into your VyOS router and get into configure mode.
The commands you'll want to use to set this up are:
set system syslog global facility all level 'info'
set system syslog global facility protocols level 'debug'
set system syslog host 1.2.3.4 facility all level 'info'
set system syslog host 1.2.3.4 facility protocols level 'debug'
set system syslog host 1.2.3.4 format octet-counted
set system syslog host 1.2.3.4 port '514'
Paste the commands above into a blank text file and replace the IP 1.2.3.4 with the IP address of your Graylog host. Now, copy your commands with your IP and paste them into the VyOS configuration CLI.
When you're done, type compare and hit enter to see your staged changes. Type commit to apply the new configuration. Now type save and hit enter to save the new config to /config/config.boot so it'll be there after a reboot of the VyOS appliance.
That's it! You're done!
Viewing VyOS Syslog Logs in Graylog
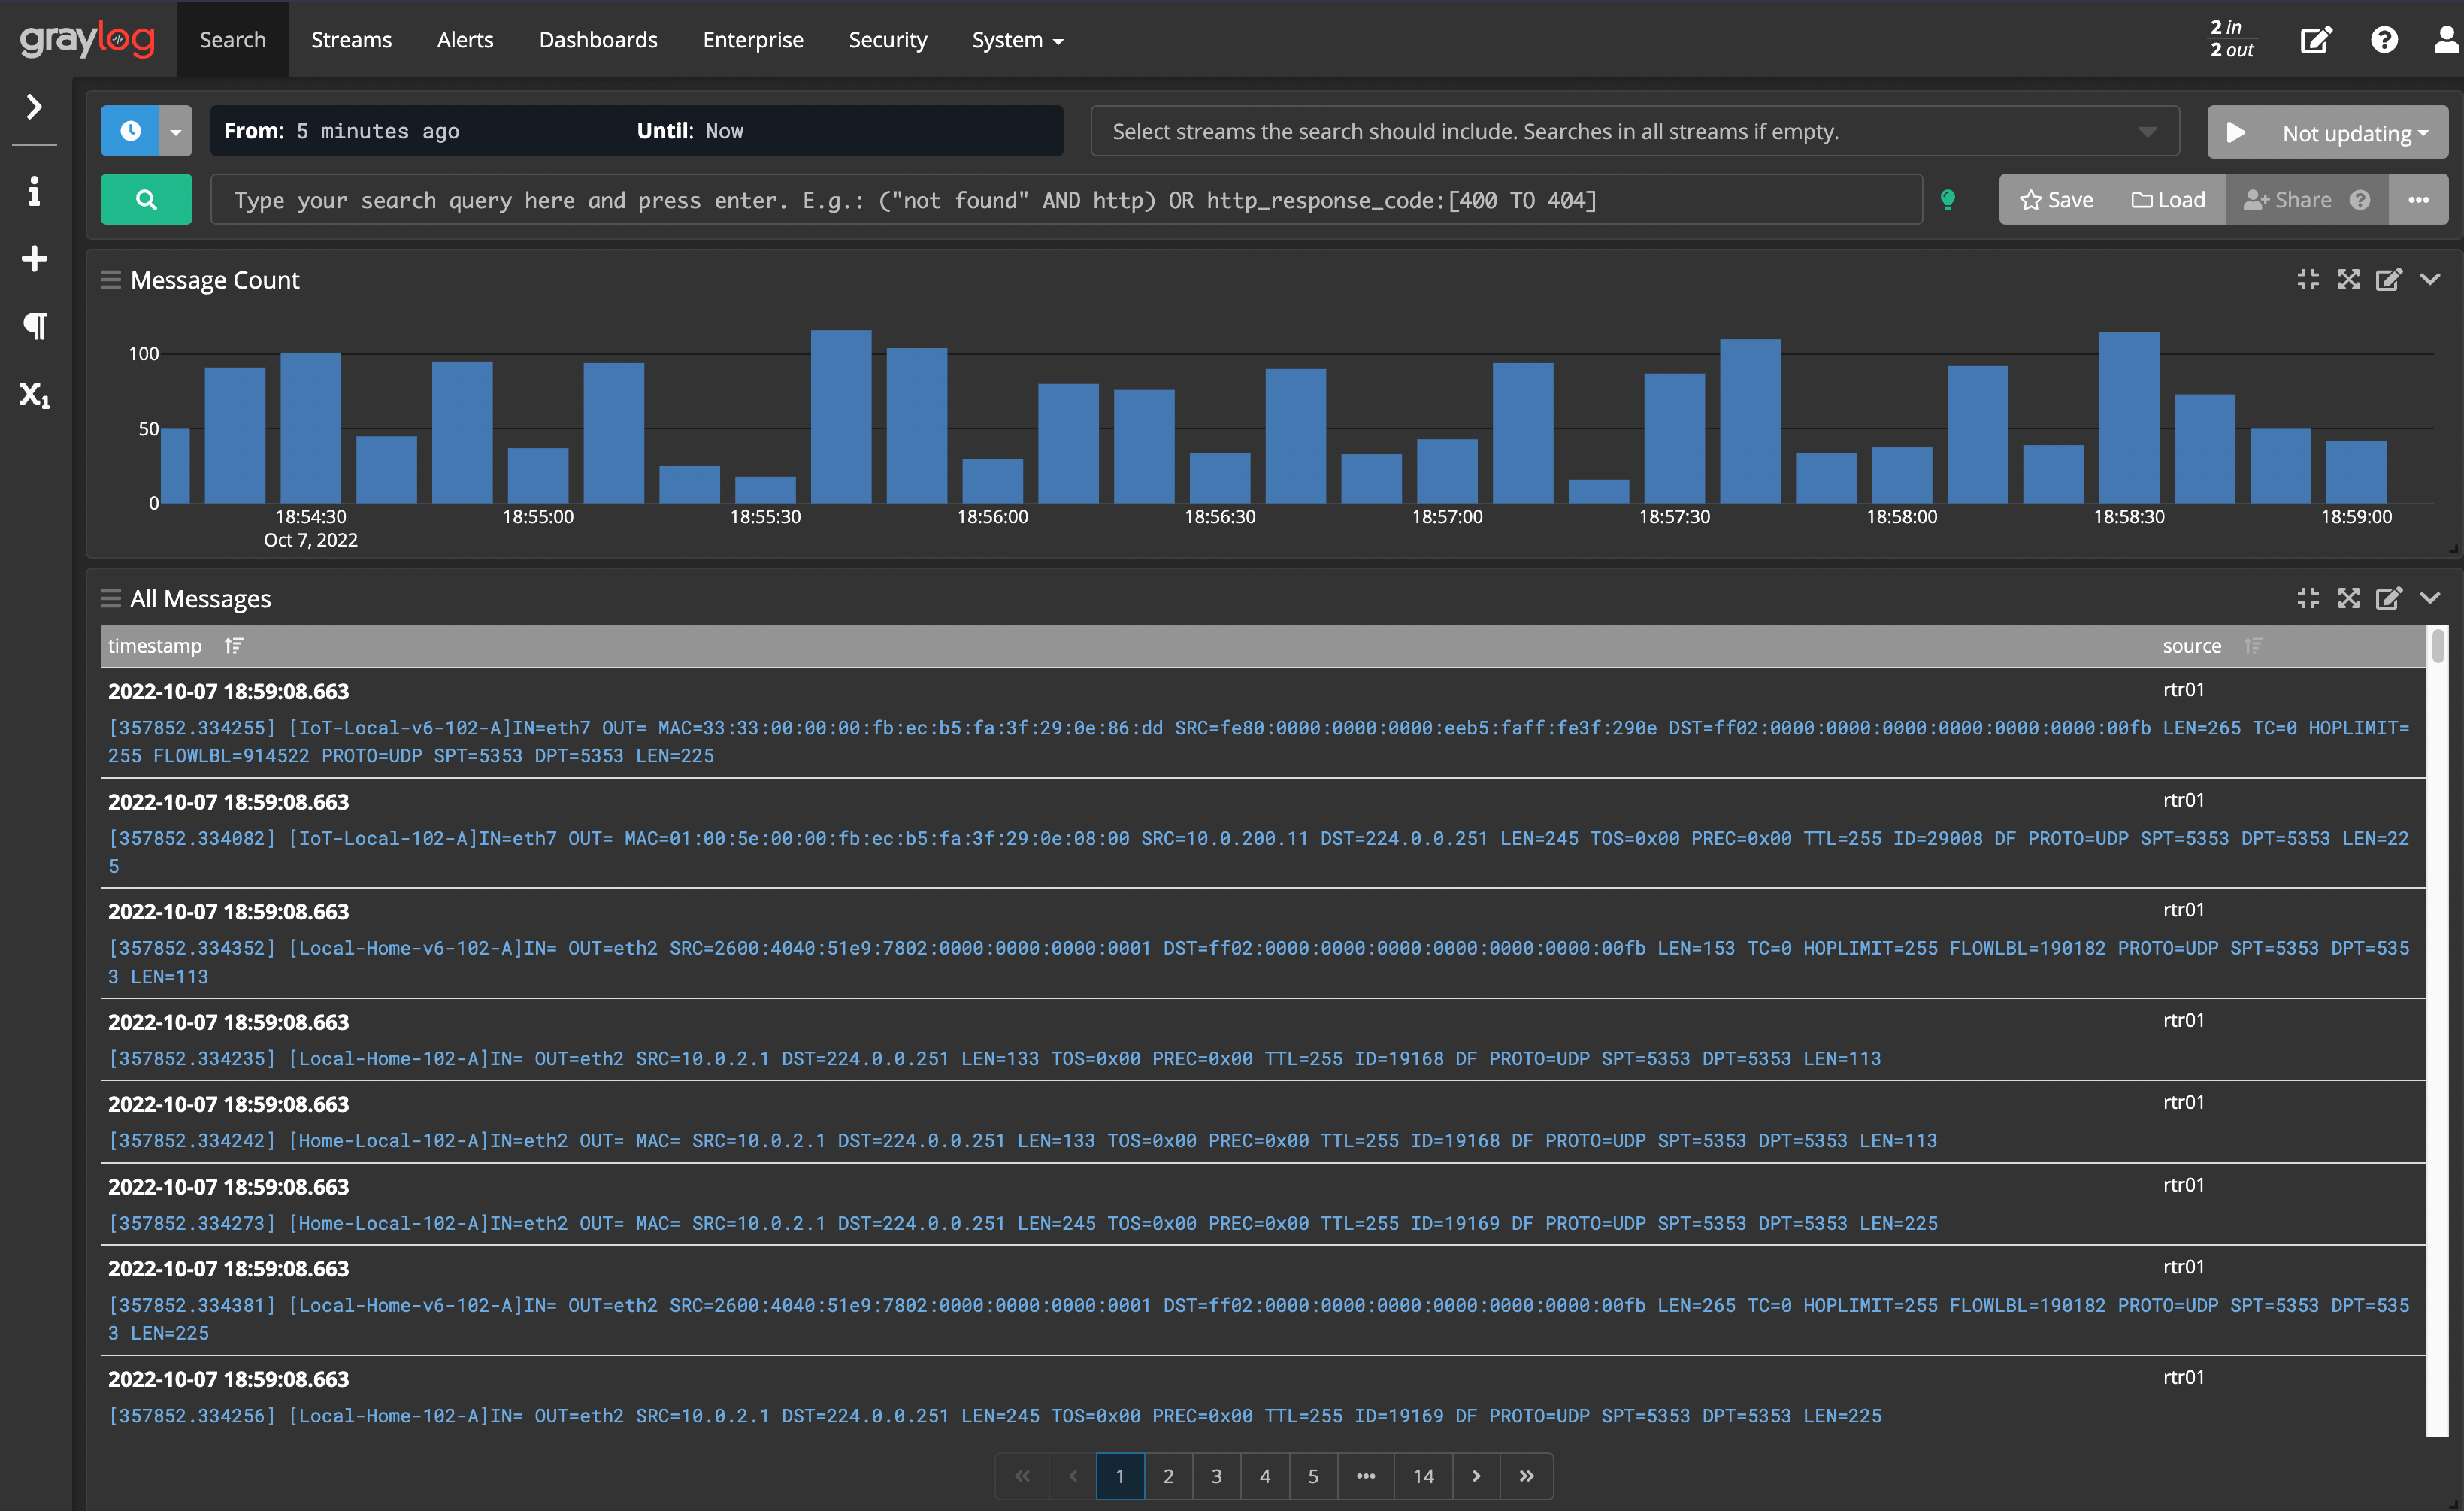
Get logged into your Graylog web interface again and head to the Search page (the link is in the top left, just to the right of the Graylog logo).
You should already see a list of messages if VyOS's logs are making it over. Here's what I see:

Some Notes
I'm using the Zone-Based Firewall on my VyOS appliance, so my rule names in firewall logs are in the pattern of SourceZone-DestinationZone-RuleNumber-RuleAction, which is what my extractors are looking for. However, the way I've configured the extractors, it should handle interface-based firewall rule names the same.
Here's how they should handle the rules:
Grab the SourceZone-DestinationZone part and store it in a field named ruleset.
Grab the RuleNumber part and store it in a field named rule_number.
Grab the RuleAction part and store it in a field named rule_action.
Rule action is stored as A for Accept, R for Reject, and D for Drop.
- You could set up a pipeline that grabs any message with the "rule_action" field and changes the A to Accept, R to Reject, and D to Drop, but that'll be a task for a different tutorial.
You can find my Graylog VyOS Extractors on GitHub and the Graylog Community Marketplace.
Message Processors Configuration
When I set up the pipeline I mention above to change the rule_action field to a full word, I ran into an issue with the pipeline not matching any messages. This was due to the Pipeline Processor running after the Message Filter Chain.
If you plan to set up Pipelines, you'll probably have to change the order under the System menu -> Configurations. In the upper right, you'll see the Message Processors Configuration. Click the Update button and change the order so the Message Filter Chain runs before your Pipeline Processor.
In my case, this was an issue because of a rule in Stage 0 of my pipeline that was looking for the fields src_ip and dst_ip: fields that are created by Extractors, which are part of the Message Filter Chain.
Security
Finally, a word on security: If you're unfamiliar with Syslog, you should be aware that messages are sent "in the clear"; they are not encrypted by default. This configuration is absolutely not recommended for production use. Securing Syslog using TLS will be another tutorial for another day.
Subscribe to my newsletter
Read articles from Bill Clark directly inside your inbox. Subscribe to the newsletter, and don't miss out.
Written by

Bill Clark
Bill Clark
Hi! I'm Bill. I'm more of a technologist than a developer, but I love to tinker. These days, I'm primarily interested in cloud and automation tech including Terraform, AWS, Azure, and Ansible. My work experience includes 20+ years as an IT Field Support team leader, a systems administrator, and a help desk tech at a large corporation.