Let's investigate a Gradle IntelliJ memory leak!
 Pierre-Yves Ricau
👋 Hi, this is P.Y., I work as an Android Distinguished Engineer at Block. This article shares a team investigation by Tony Robalik, Pablo Baxter, Roger Hu and myself into a recent Gradle / IntelliJ memory leak.
On September 29th, Tony Robalik reaches out to our friends at Gradle to report memory issues with the Gradle process when importing a project in IntelliJ IDEA. The heap size keeps climbing to new heights, reaching 60+ GB! Tony writes:
Normally, after I start another build, the daemon gives up most of the memory it had used in the first build, i.e. it takes until that moment for the GC to run. In the past, I've been able to force the gc to run with
jcmd <pid> GC.runand get my memory back or just run a simple build likehelp. However, right now, that's not happening.
Dominators
The Java heap is an object graph. One useful tool we can leverage from graph theory is something called the dominator tree:
A node
ddominates a nodenif every path in the object graph from GC roots tonmust go throughd.
In practice, the dominator tree provides us with the list of biggest objects sorted by retained size. The retained size is the sum of the size of all the objects that would become unreachable if the dominator object was unreachable.
Tony takes a heap dump of the Gradle process and shares a screenshot from the Biggest Objects - Dominators tab in YourKit:
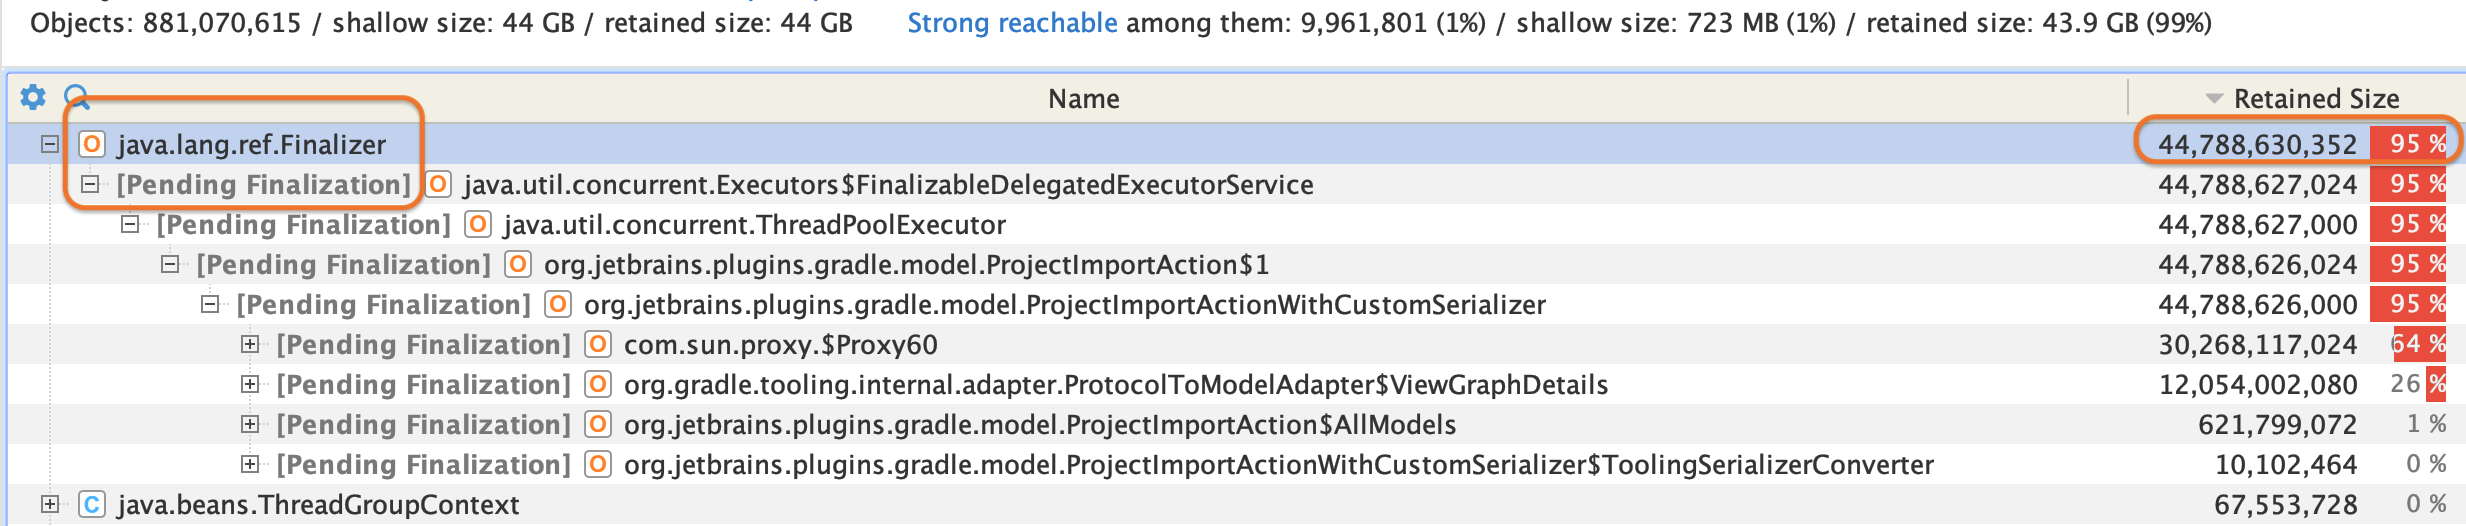
We immediately notice that 95% of the 44 GB heap is retained by java.lang.ref.Finalizer, which means, as YourKit gently points out, that the memory is retained by an object that is pending finalization.
Pending Finalization
Once an object is unreachable, it can be garbage collected and its memory reclaimed. If that objects implements the finalize() method, then that method must be called before garbage collection. Once objects with a finalize() are detected as unreachable, they're put in a finalizer queue and are in a "pending finalization" state until finalize() is called.
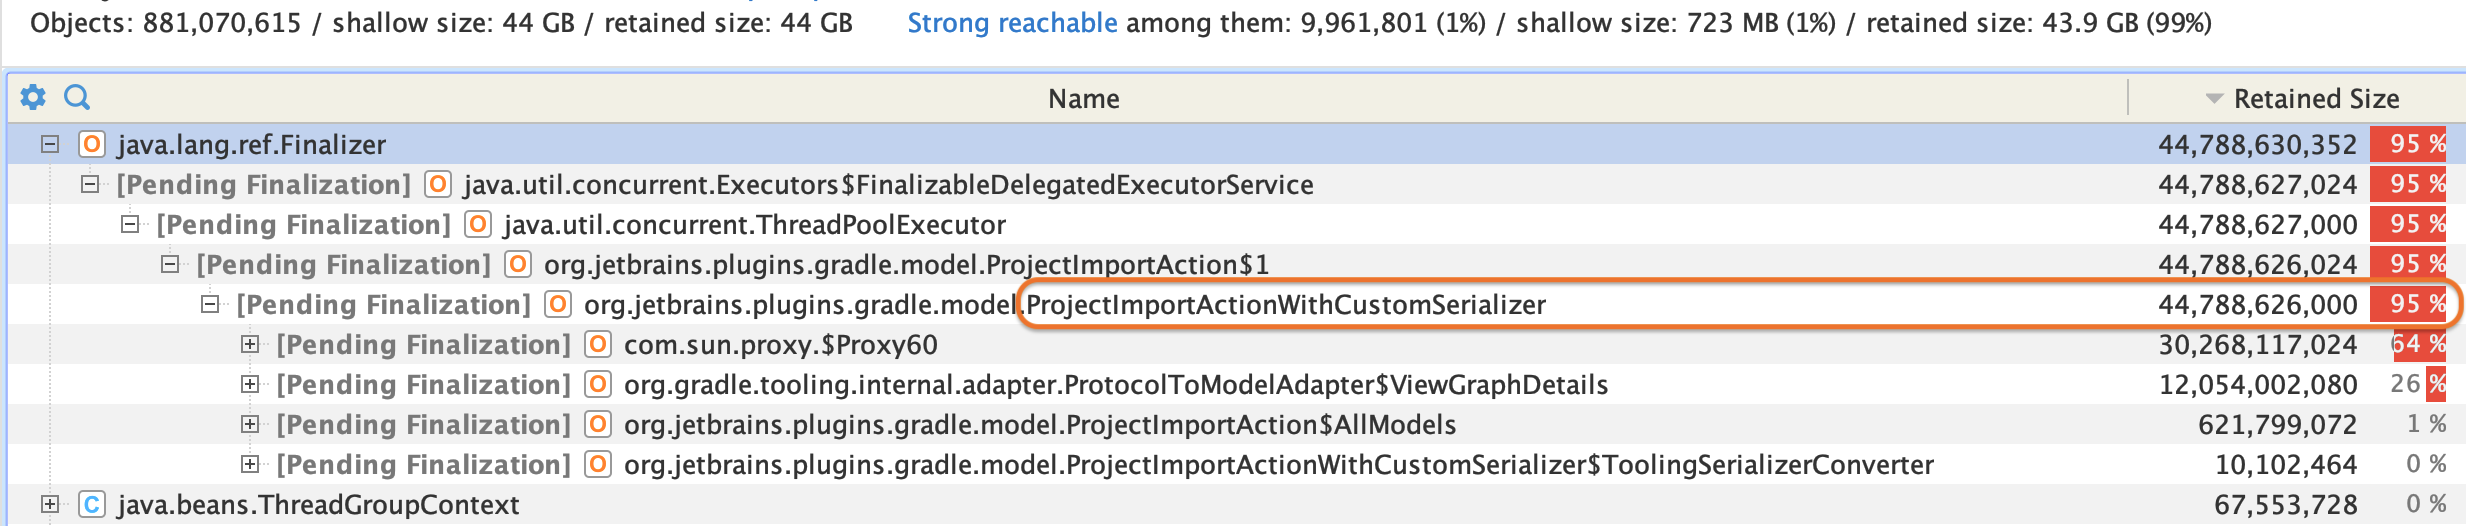
Here we can see that the lowest dominator that retains most of the memory is ProjectImportActionWithCustomSerializer. It is unreachable & transitively pending finalization: even though it has no finalize() method, it is dominated by an object that is pending finalization, which means it is still indirectly reachable by that object which itself can still run code in its finalize() method. This means ProjectImportActionWithCustomSerializer cannot be garbage collected until its dominator is finalized.
I Am GCroot 🌳
To understand which references exactly are keeping ProjectImportActionWithCustomSerializer in memory, I ask Tony to compute the shortest paths from GC Roots in YourKit:
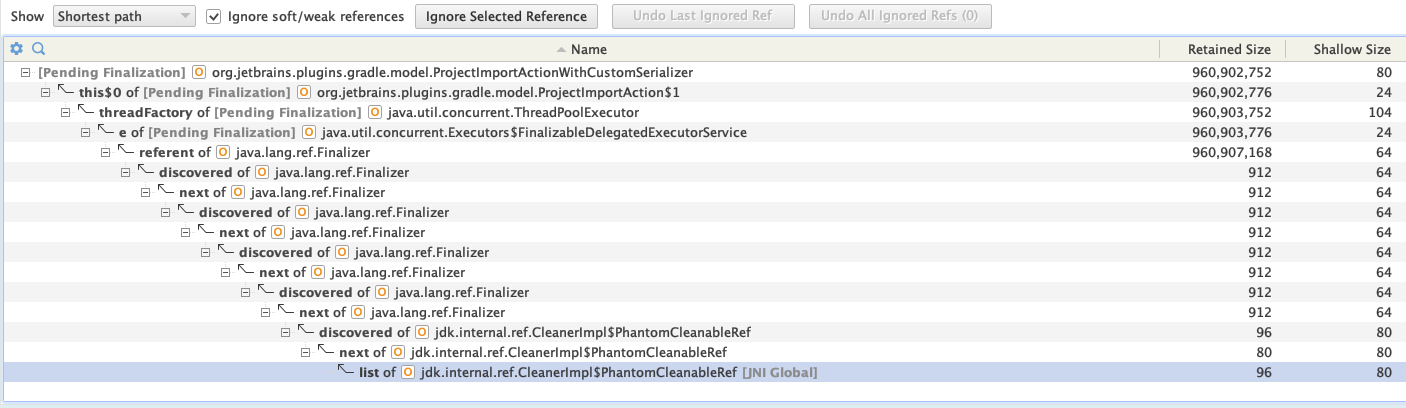
Here's how to read this trace:
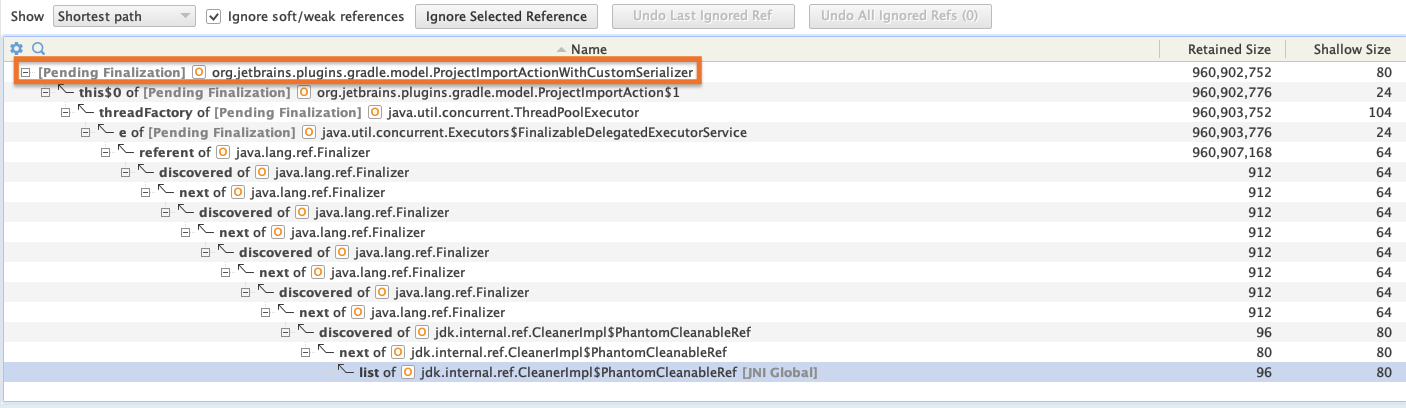
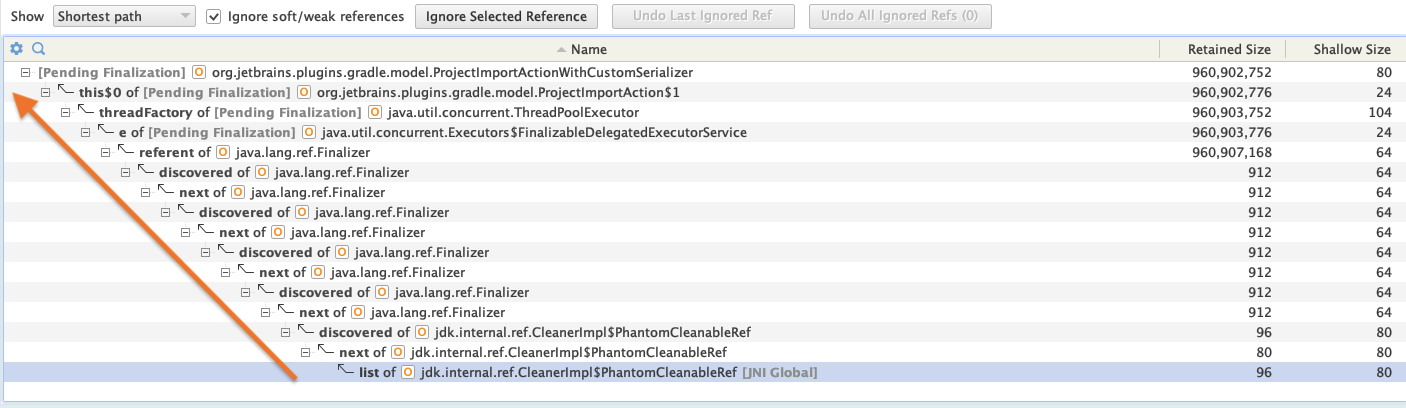
- At the top is
ProjectImportActionWithCustomSerializer. We want to understand why it's retained in memory.
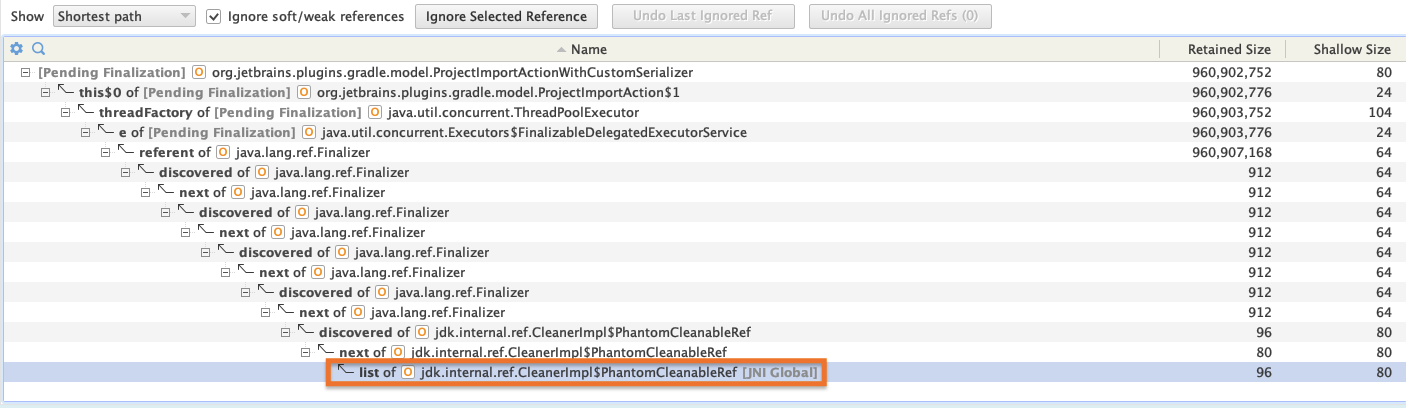
At the bottom is a GC root, here a JNIGlobal that keeps a reference to CleanerImpl$PhantomCleanableRef.
From the bottom to the top we see the chain of references that is retaining ProjectImportActionWithCustomSerializer.
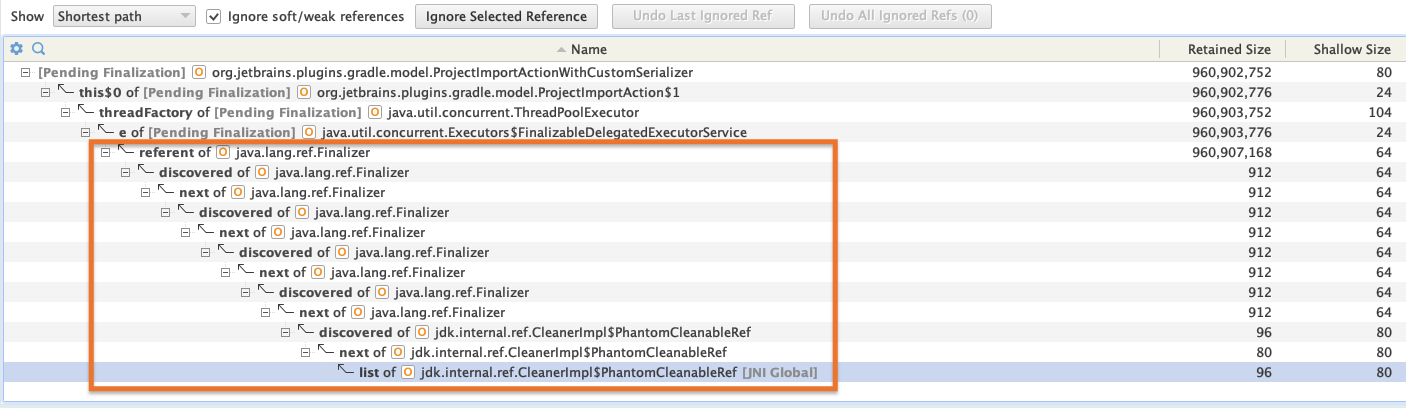
The bottom part of the trace is the finalizer queue. The finalizer queue is implemented as a doubly linked list, where each Finalizer instance has a reference to the previous entry (prev) and next entry (next) in the finalizer queue, as well as a reference to the object that is pending finalization (referent).
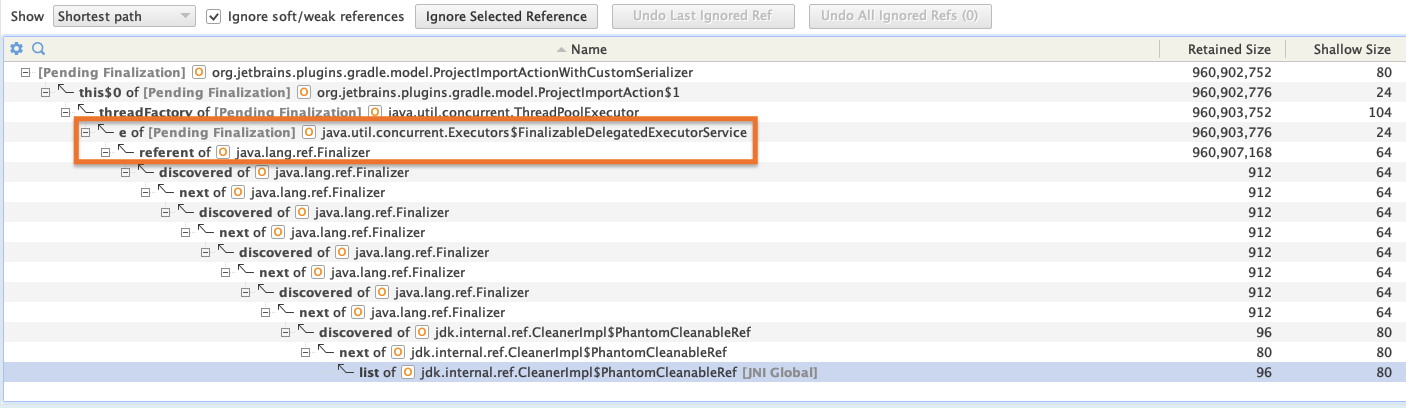
As we move towards the top of the trace, we see that a Finalizer has a referent field referencing Executors$FinalizableDelegatedExecutorService. This is the object that implements finalize() and is pending finalization.
    private static class FinalizableDelegatedExecutorService
            extends DelegatedExecutorService {
        FinalizableDelegatedExecutorService(ExecutorService executor) {
            super(executor);
        }
        @SuppressWarnings("deprecation")
        protected void finalize() {
            super.shutdown();
        }
    }
As you can see, FinalizableDelegatedExecutorService is an ExecutorService that automatically shuts down the thread pool when it becomes unreachable. Developers are expected to shut down thread pools manually when they stop being in use, but sometimes mistakes happen and this is a safety net.
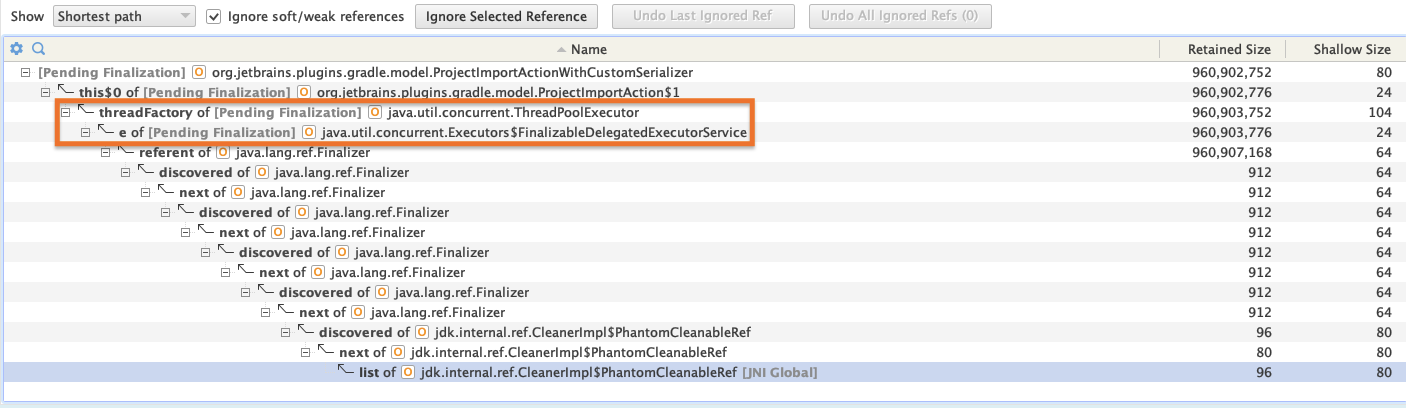
The Executors$FinalizableDelegatedExecutorService.e field references a ThreadPoolExecutor instance.
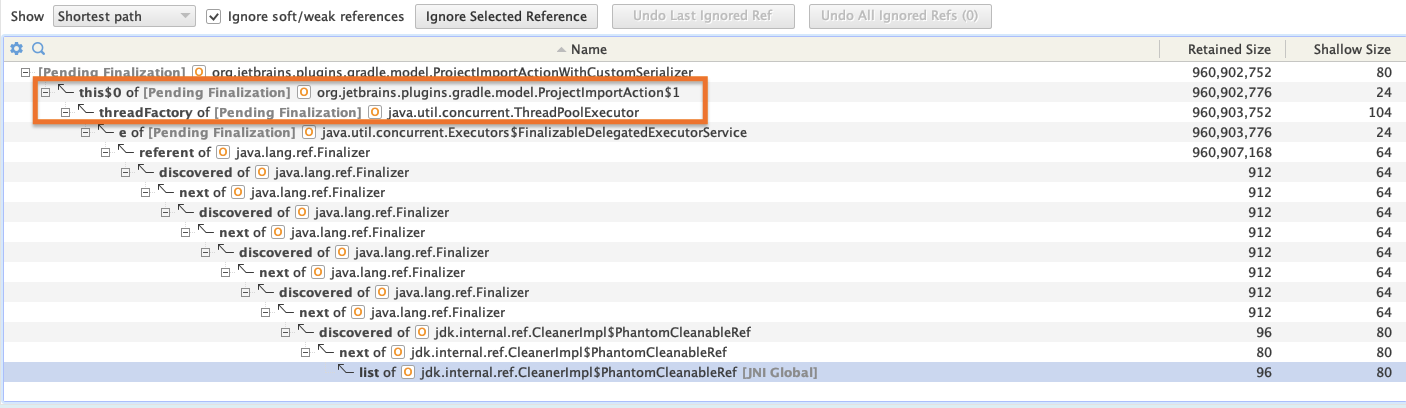
The ThreadPoolExecutor.threadFactory field references a ProjectImportAction$1 instance. So we can assume ProjectImportAction$1 is an anonymous class (because its name is $1) that implements ThreadFactory.
The ProjectImportAction$1.this$0 field references the ProjectImportActionWithCustomSerializer instance. In Java, anonymous classes have a hidden reference to their outer class, compiled as a field name this$0.
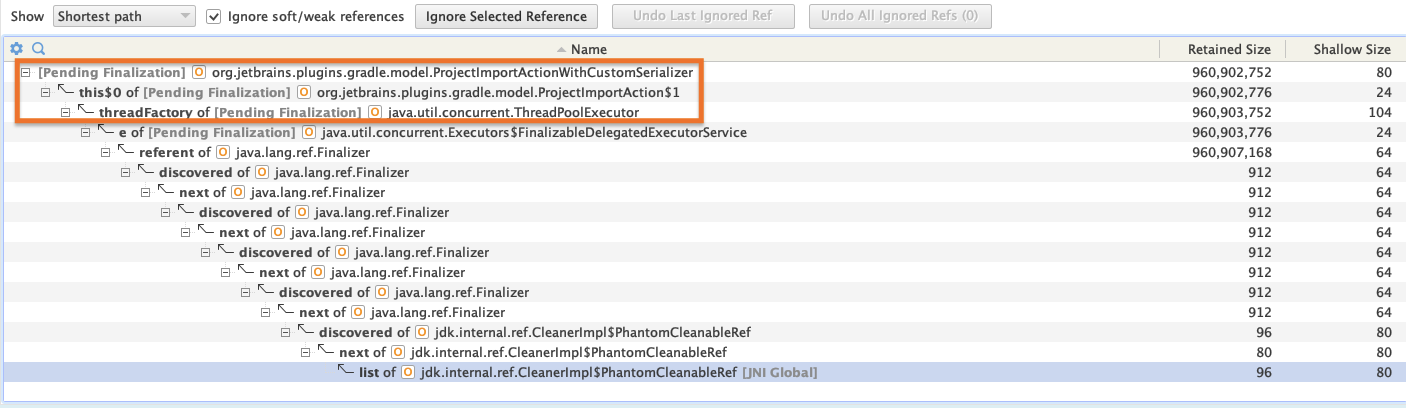
Reveal
At this point we can conclude that ProjectImportActionWithCustomSerializer is a class that extends ProjectImportAction, and that ProjectImportAction defines an anonymous class that implements ThreadFactory which is then passed to a ThreadPoolExecutor.
Let's look at the ProjectImportAction sources:
  myConverterExecutor =  Executors.newSingleThreadExecutor(
    new ThreadFactory() {
      @Override
      public Thread newThread(@NotNull Runnable runnable) {
        return new Thread(runnable, "idea-tooling-model-converter");
      }
    }
  );
 }
ProjectImportAction creates a single threaded executor, and passes in a ThreadFactory in order to set the thread name. That anonymous ThreadFactory doesn't actually use the hidden this$0 reference to its ProjectImportAction outer class, unfortunately the Java compiler (unlike Kotlin) will still add that reference.
If we extract that anonymous class into a static class, this this$0 reference will disappear and the ProjectImportAction implementation will not be retained while the thread pool executor is pending finalization.
private static final class SimpleThreadFactory implements ThreadFactory {
  @Override
  public Thread newThread(@NotNull Runnable runnable) {
    return new Thread(runnable, "idea-tooling-model-converter");
  }
}
Pablo Baxter files a bug and opens a pull request which is swiftly merged into the IntelliJ master branch.
Roger Hu & Tony Robalik apply this fix locally by patching the gradle-tooling-extension-api.jar jar with Recaf and confirm that the memory is now properly reclaimed 🎉 !
The git history shows that this bug was introduced in IntelliJ IDEA 2022.1 221.4165.146 (that version is the base for Android Studio Electric Eel Canary 5). Last week, folks from JetBrains said they would "apply the changes and include it in next EAP of 2022.3 and next bugfix release of 2022.2 branch" while folks from Google said "we will cherry pick in EE". I love this quick turnaround!
Are we done though?
Wait a minute, we fixed the leak, but why was the thread pool executor pending finalization for such a long time? Tony reproduces the bug a few more times and takes a peak at the finalization queue. It turns out there's a ZipEntry for a jar that is systematically hanging out near the head of the finalization queue. ZipEntry calls close() when finalized. We haven't quite figured out why close() takes so long, so we're leaving that as an exercise for you, dear reader 😘.
Header image generated by DALL-E, prompt: "a photo of canary flying holding an elephant in the air".
Subscribe to my newsletter
Read articles from Pierre-Yves Ricau directly inside your inbox. Subscribe to the newsletter, and don't miss out.
Written by
Pierre-Yves Ricau
Pierre-Yves Ricau
My pronouns are he / him. Android Engineer at Square in San Francisco. A few things I enjoy: Publishing Open Source libraries (LeakCanary, Curtains, Radiography, square/logcat) Rollerblading Writing technical blogs (previously on dev.to/pyricau) Cooking Giving tech talks Reading sci-fi