How To Install Kubecost: The Complete Guide
 Jens Tan
Introduction
Kubernetes has taken the software development world by storm. It gives you an excellent framework to deploy your application with and abstracts away the low-level details of the underlying infrastructure. But just like everything great, it comes with a tradeoff. Since it makes deployments easy and smooth, it’s possible to overprovision resources that can end up driving cloud costs up.
Kubecost is a tool that gives you real-time visibility into your resource utilization and provides you with a detailed breakdown of your costs. Kubecost also lets you assign out-of-cluster costs (eg, database or storage costs) to get complete insight across the entire spectrum of your cloud expenses as well as set up notifications to quickly catch cost spikes and take action accordingly.
What is Kubecost?
Kubecost is an open-source robust cost monitoring and management solution that software development teams can use to get insights into cost allocation, cost tracking, and alerts for Kubernetes and Cloud-native applications.
Is Kubecost Open Source?
Kubecost operates with an open core model whereby the commercial product is built on top of the Kubecost open source project available on Github. In fact, it can be deployed with a single Helm install. Essentially, Kubecost sits inside a company’s infrastructure, which allows it to monitor costs in real-time, and has the added benefit that data doesn’t have to be shared remotely.
What is Kubernetes Used For?
Kubernetes refers to an open-source platform that automates container operations. It eliminates many of the manual processes involved in deploying and scaling containerized applications to help you manage them easily and efficiently.
Kubernetes and containers can provide tremendous benefits for businesses in relation to DevOps, application development, and delivery. This is because they open up several possibilities including modernizing traditional applications, facilitating hybrid and multi-cloud implementations, as well as ensuring fast and agile cloud-native application development.
How to Install Kubecost
Back in 2018, the team behind Kubecost tried to efficiently monitor Kubernetes resources with Prometheus and Grafana to provide cost allocation visibility.
They rapidly ran into limitations, as those Grafana dashboards weren't easily able to show cost allocation by service/deployment/label, didn't integrate with dynamic cloud billing data, and wouldn't easily support viewing data across multiple clusters.
In early 2019 they announced an open-source tool that generates cost allocation data associated with Kubernetes clusters called Kubecost.
Some of Kubecost's main features are:
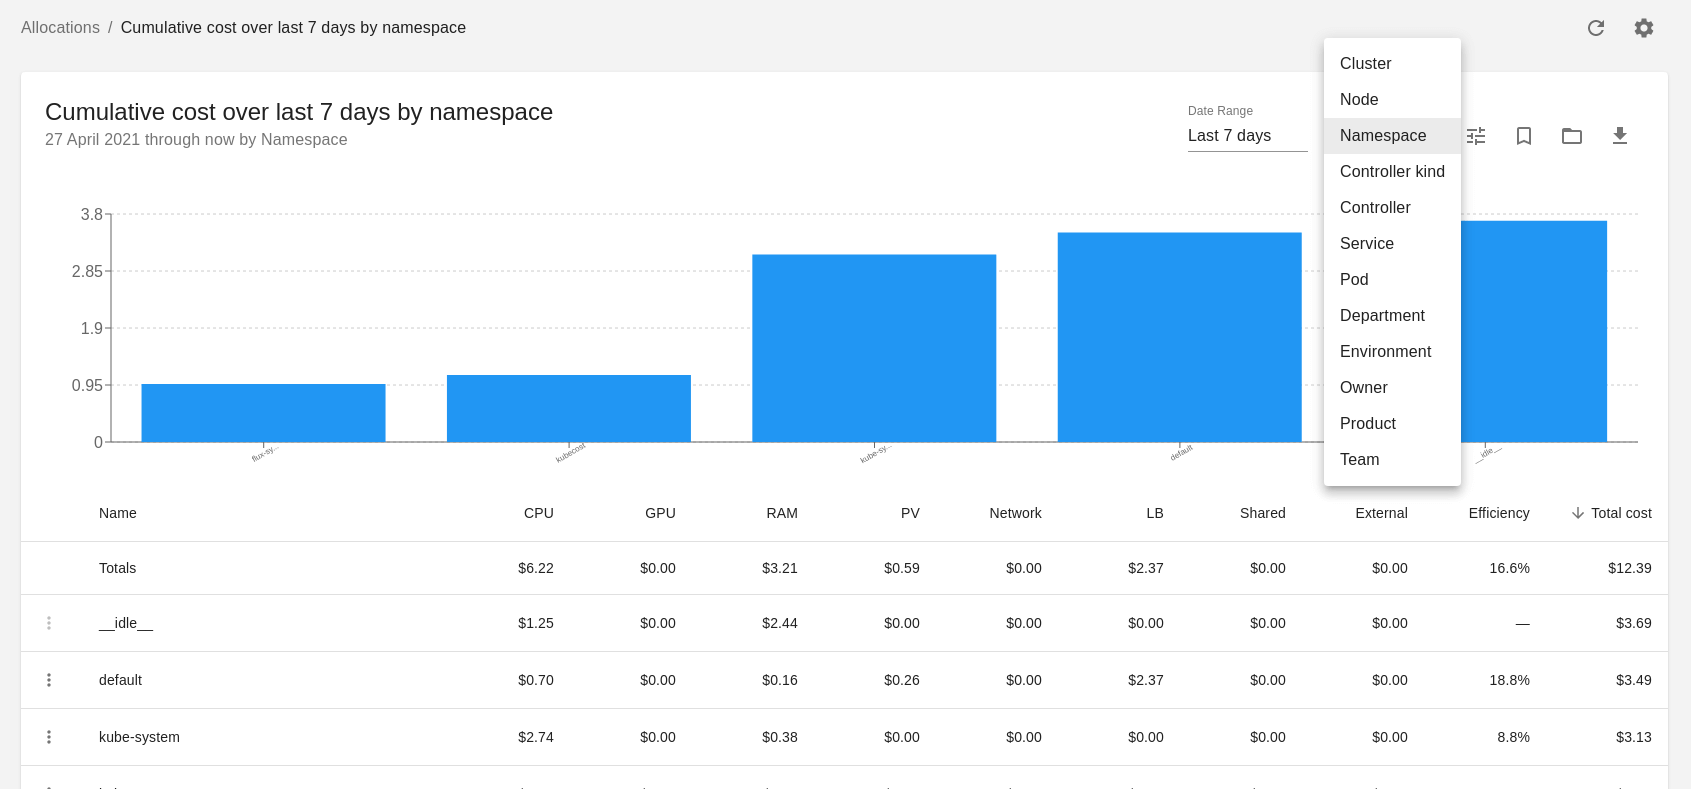
- Real-time cost allocations by all key k8s concepts, e.g., spend namespace, deployment, service, daemonset, pod, container, job, etc.;
- Cost allocation by configurable labels to measure spending by owner, team, department, product, etc.;
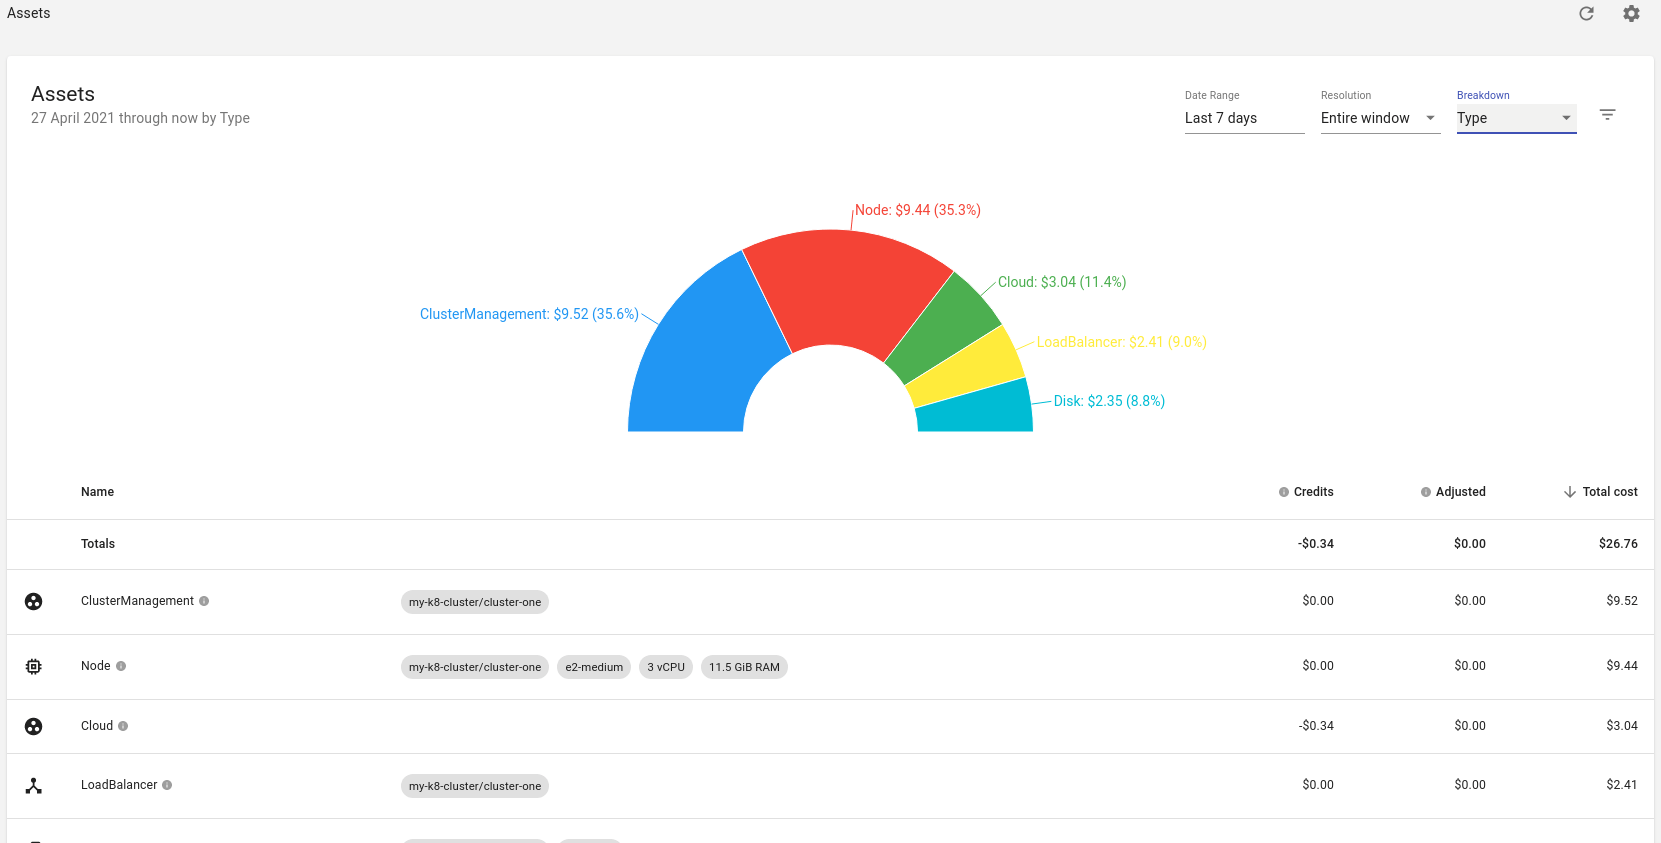
- Dynamic asset pricing enabled by integrations with AWS and GCP billing APIs estimates available for Azure;
- Cost allocation metrics for CPU, GPU, memory, and storage;
- Out of cluster cloud costs tied back to the owner, e.g., S3 buckets and RDS instance allocated to pod/deployment;
- Export billing data back to Prometheus for further analysis.
For this blog, we will cover the free version of Kubecost. If you want to know more about their pricing model, check out their site: https://www.kubecost.com/pricing.
Necessary limits to understand with the free tier:
- 1 cluster (do not support multi clusters)
- 15-day metric retention
Kubecost Installation Requirements
In this blog post, I will be using GKE with three nodes and Flux to deploy Kubecost with a helm chart since it is the recommended installation method.
More information about the Kubecost helm chart used can be found in the links below:
https://github.com/kubecost/cost-analyzer-helm-chart
https://github.com/kubecost/cost-analyzer-helm-chart/blob/develop/cost-analyzer/values.yaml
If you want access to the repo used for this test, have a look at it on the link below:
https://github.com/bluelightco/blog-kubecost-gke
By default, the Kubecost Helm chart includes a Prometheus and Grafana instance, which can be of great benefit if you don’t have any of those running. Furthermore, it comes with handy dashboards that will allow you to monitor some critical metrics, such as your pod or node utilization.
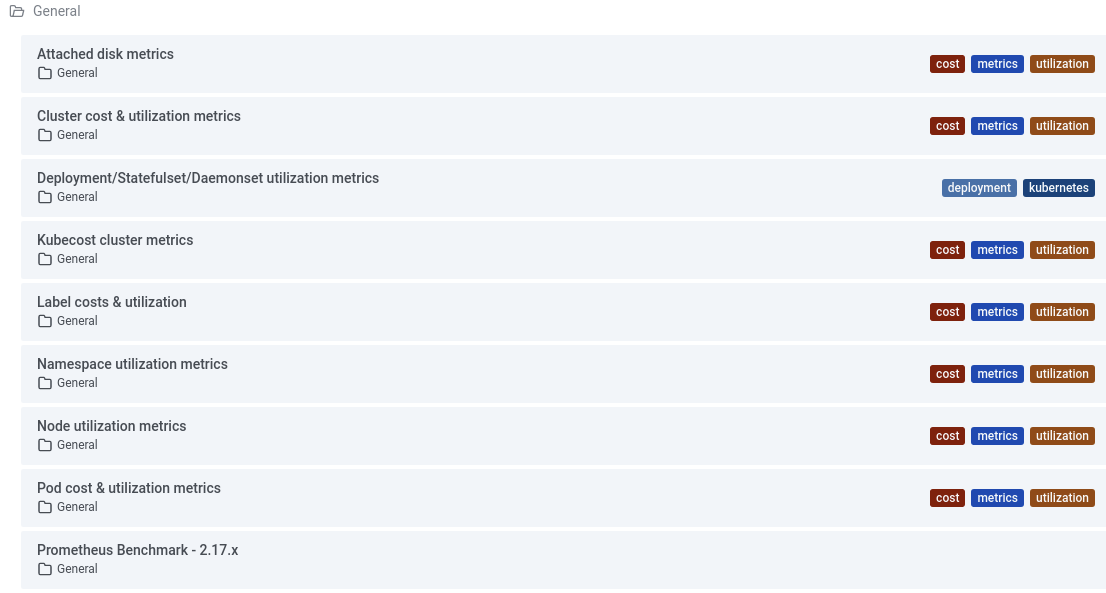
If you have your own Grafana/Prometheus, see the instructions provided here.
Installing Kubecost
Firstly, create a namespace for Kubecost:

In the next step below, we provide the Helm values that we will be using for our installation process.
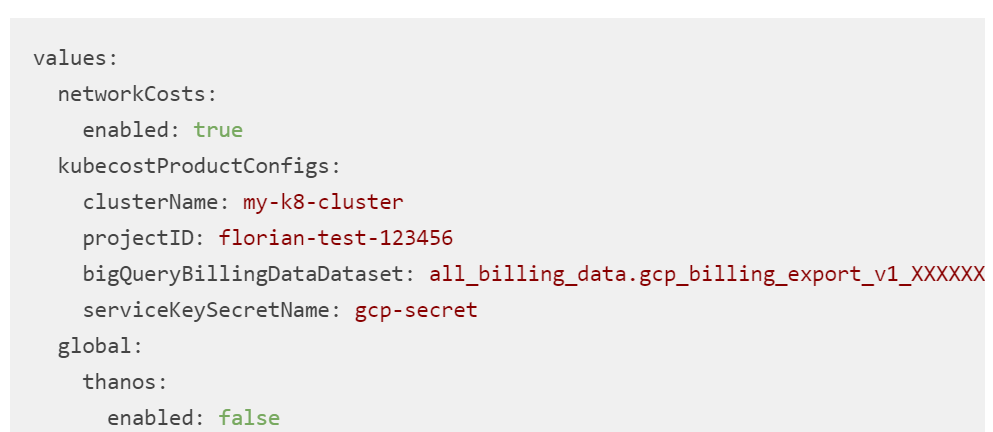
Accessing Kubecost WebUI
If you need quick and secure access to the WebUI provided by Kubecost Enable port-forward, run the following:
kubectl port-forward --namespace kubecost deployment/kubecost-cost-analyzer 9090:9090
If you were hoping to use an ingress, authentication would need to be set up. We suggest you look at this helm value.
Kubecost will become accessible http://localhost:9090/.
Setting Up a Kubecost Cloud Integration with GCP
Kubecost detects your cloud provider automatically and pulls list prices on Azure, AWS, and GCP for all in-cluster assets.
Suppose you complete the external cloud cost configuration with your cloud provider. In that case, you get the ability to view Kubernetes cost metrics side-by-side with external cloud services costs, such as S3 or BigQuery. This will also allow you to reflect enterprise discounts, spot market prices, commitment discounts, and more to give you a complete and accurate picture of costs.
To configure Kubecost with GCP, navigate to the settings and find External Cloud Cost Configuration (GCP), click on the Update button and follow the instructions provided:
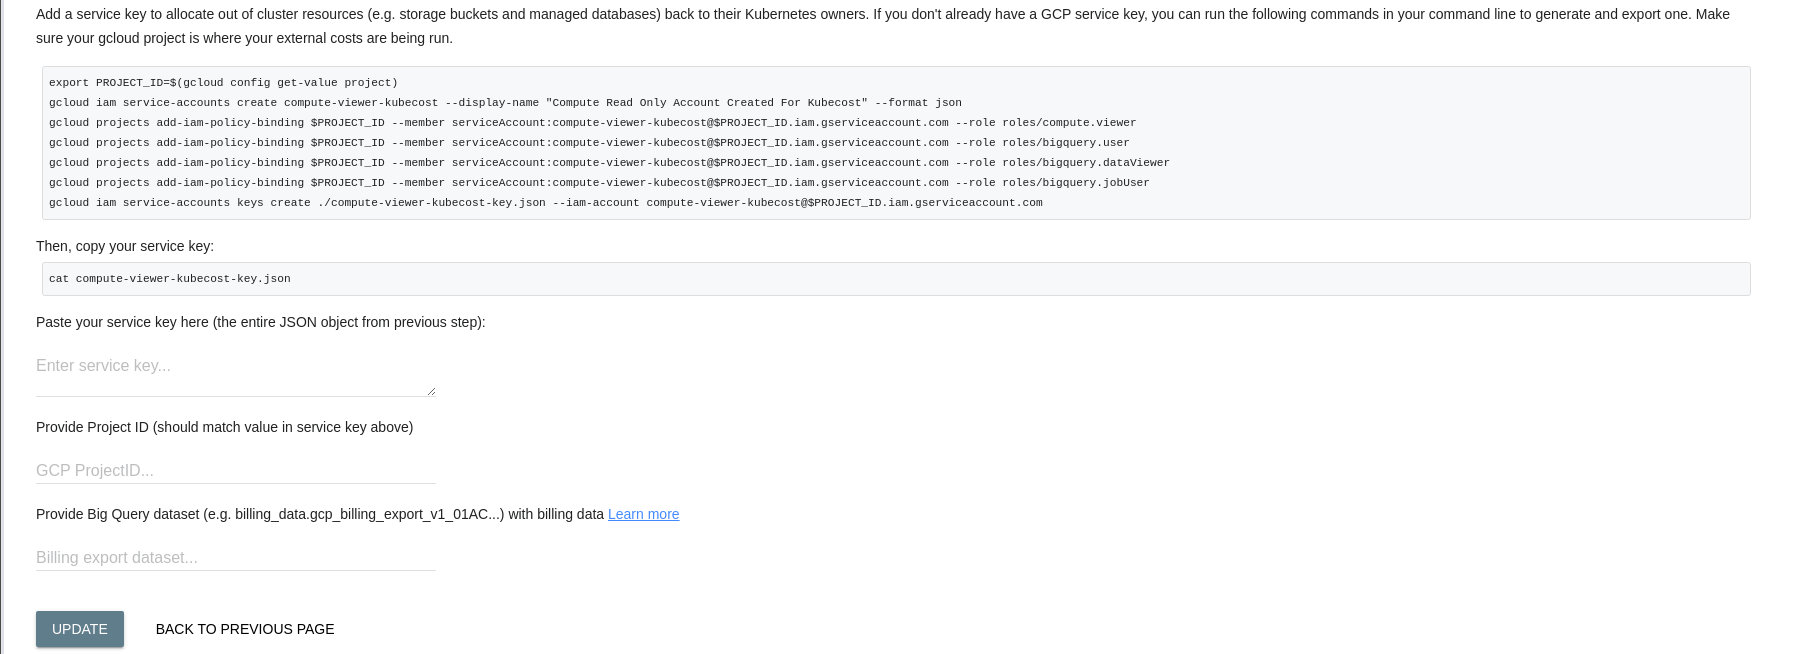
Don't forget to create a secret out of your service key:
kubectl create secret generic gcp-secret --from-file compute-viewer-kubecost-key.json
What are Kubecost's Core Features?
Overview
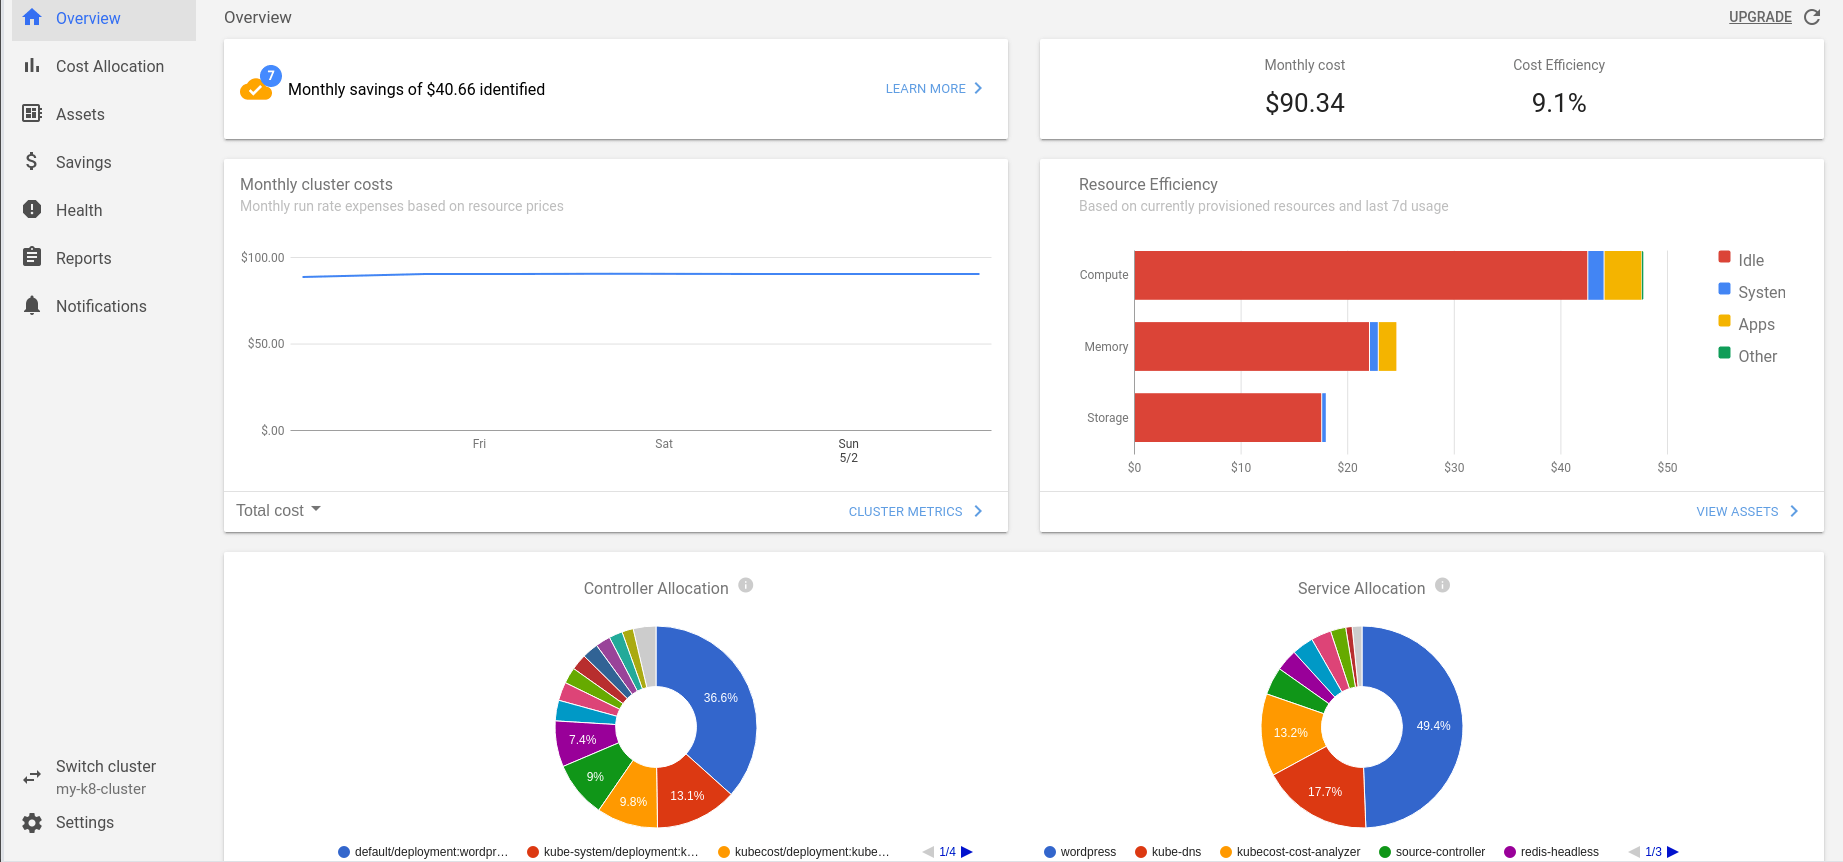
The default page on Kubecost is an Overview dashboard that contains multiple unmovable panels as shown below:
Cost Allocation
Assets
Savings
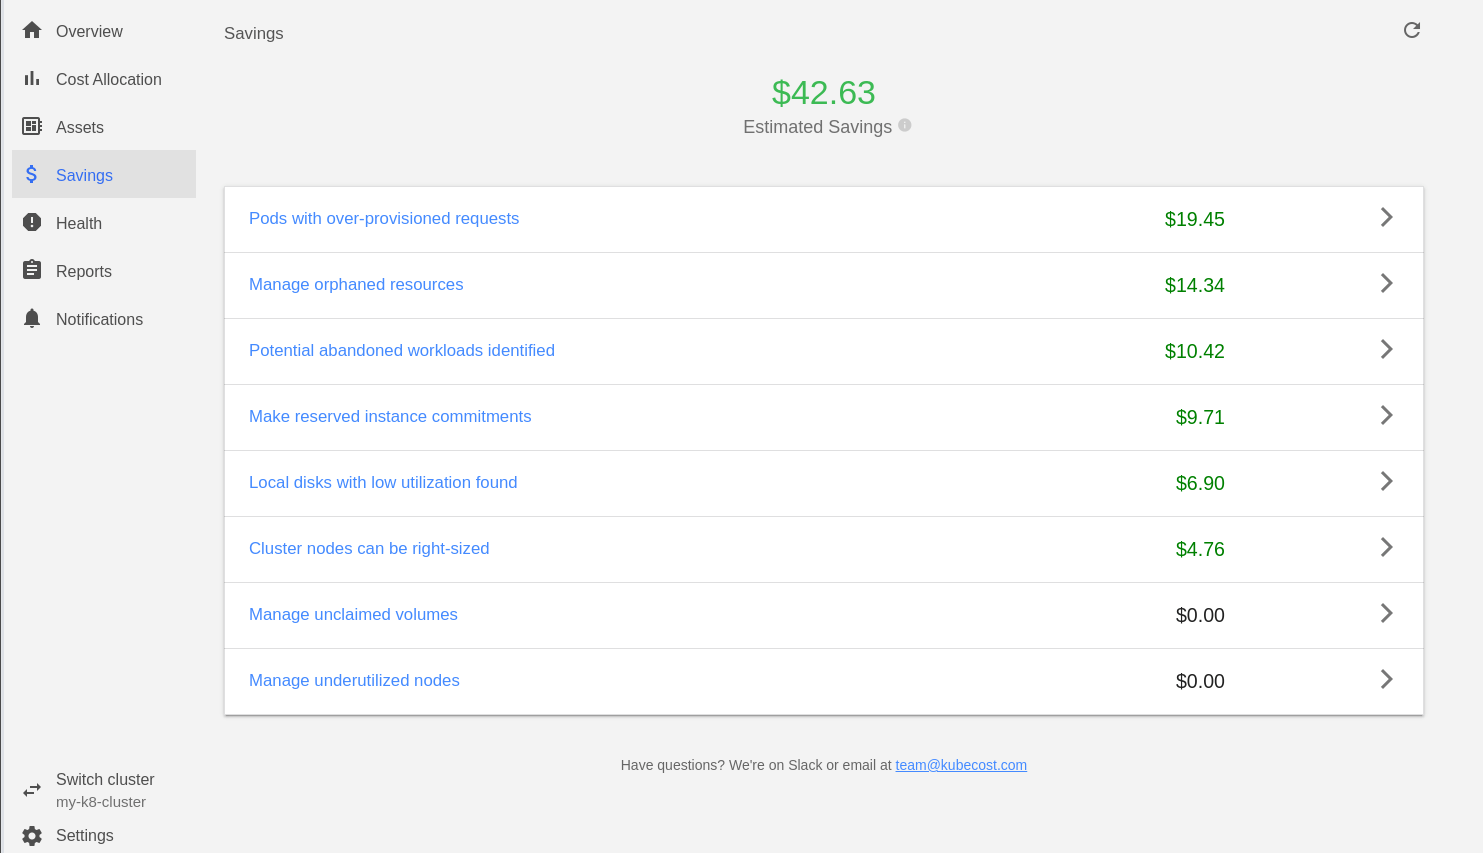
This section will show initial recommendations that would help you reduce the recurrent cost associated with your Kubernetes cluster.
Pods with Over-Provisioned Requests
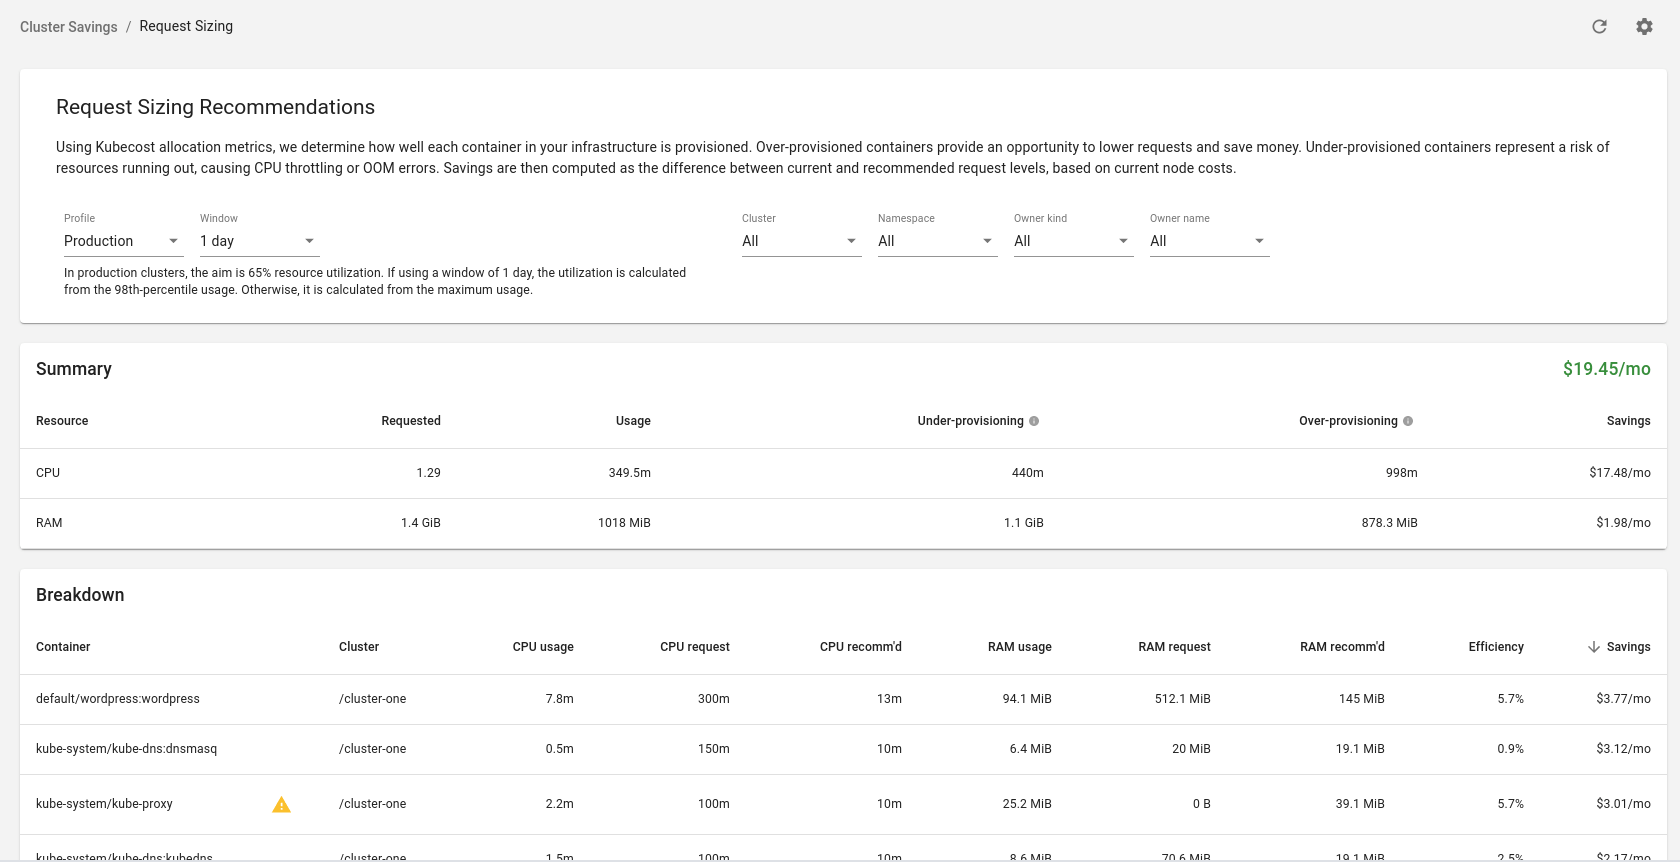
This subsection will give you a breakdown of your resources and recommendations for a Production cluster. However, you can select a different cluster type to receive recommendations more customized to your situation.
Development: In development clusters, the aim is 80% resource utilization. If using a window of 1 day, the utilization is calculated from the 85th-percentile usage. Otherwise, it is calculated from the maximum usage.
Production: In production clusters, the aim is 65% resource utilization. If using a window of 1 day, the utilization is calculated from the 98th-percentile usage. Otherwise, it is calculated from the maximum usage.
High-availability: In high-availability clusters, the aim is 50% resource utilization. If using a window of 1 day, the utilization is calculated from the 99.9th-percentile usage. Otherwise, it is calculated from the maximum usage.
Manage Orphaned Resources
Shows unused resources such as Load Balancers, PVCs, IPs, etc.

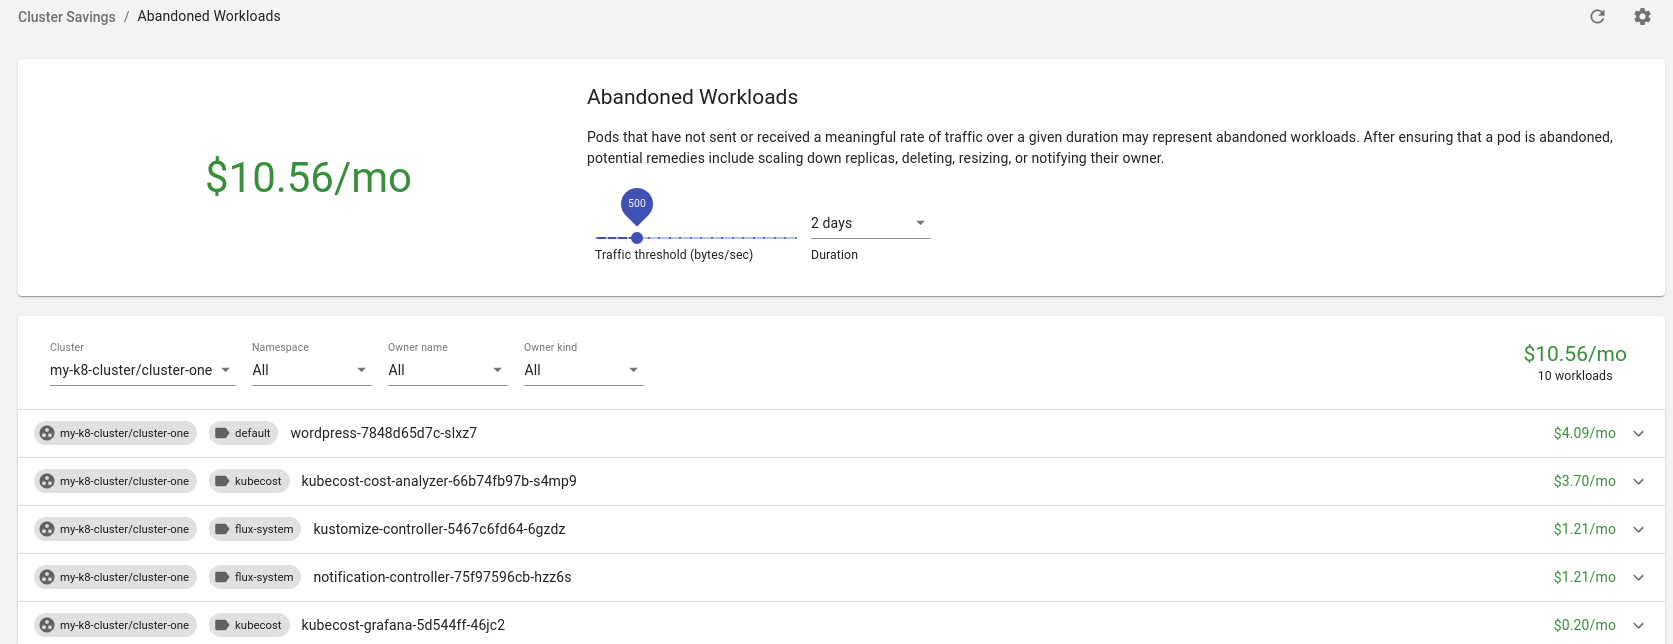
Abandoned Workloads
This section highlights pods that have not sent or received a meaningful traffic rate over a given duration, which may represent abandoned workloads. After validating that a pod is abandoned, potential remedies include;
- Scaling down replicas
- Deleting
- Resizing
- Notifying their owner

Make Reserved Instance Commitments
This will give you an indication if you need to purchase reserved instances for your nodes.
Local Disks with Low Utilization Found
This will display PVCs with less than 20% disk usage.

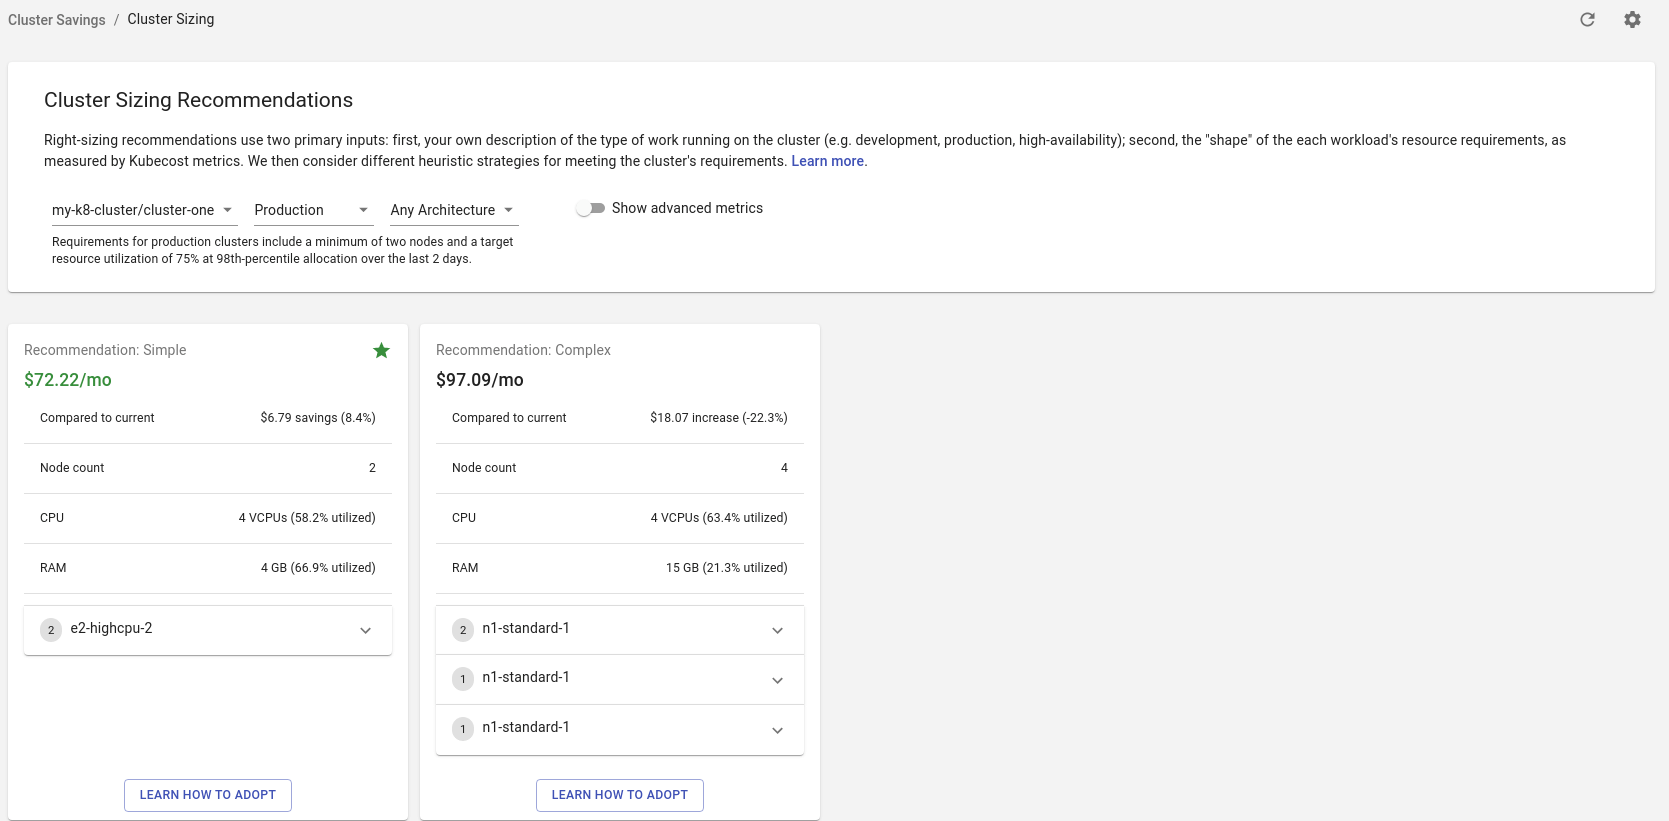
Cluster Nodes can be Right-sized
This menu will help you to resize your cluster based on your recent load.
Manage Unclaimed Volumes
If you have any PVCs that aren't used by any pods, you will see them here.

Manage Underutilized Nodes
Any nodes that could be removed will be displayed here.

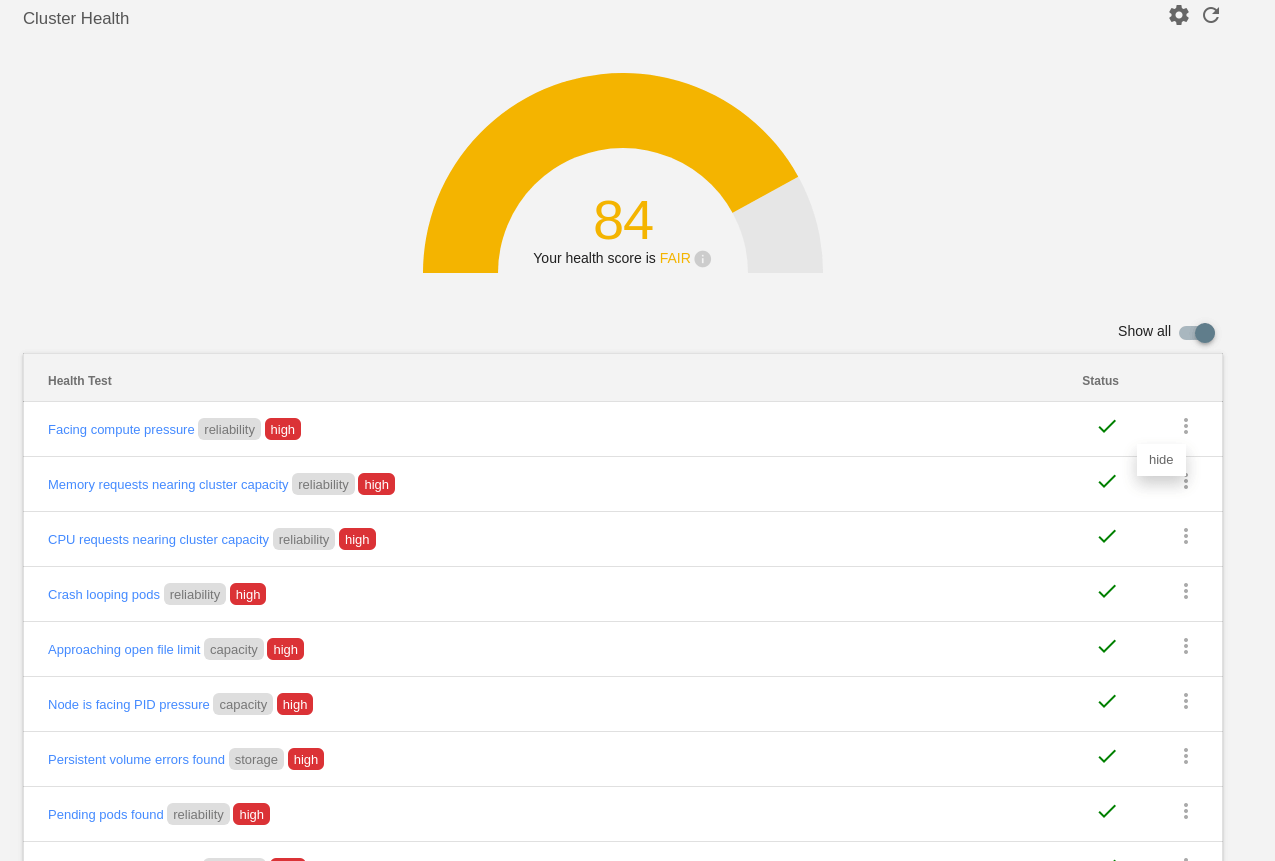
Health
Cluster health ratings are an assessment of infrastructure reliability and performance risks. Scores range from 1-100.
It will contain a lot of recommendations and explanations associated with those.
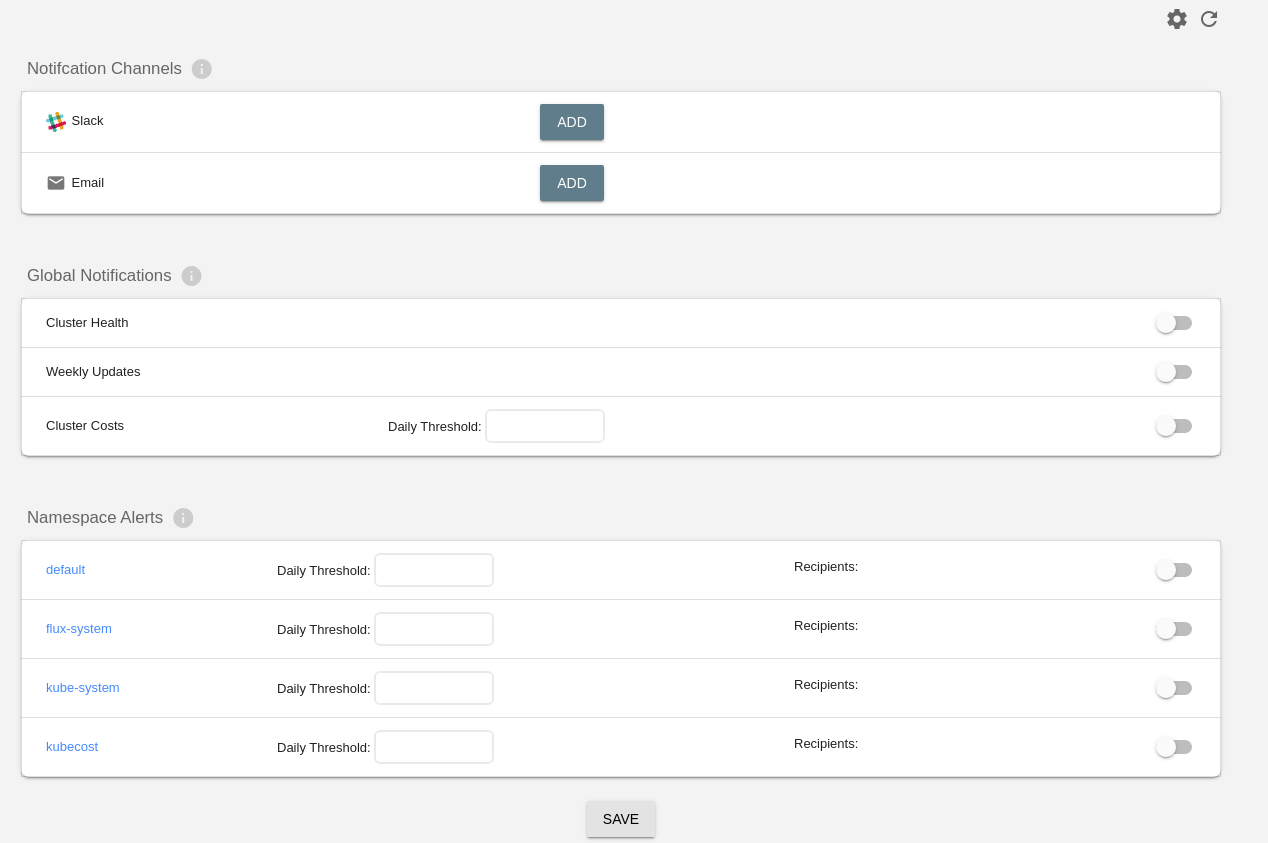
Notifications
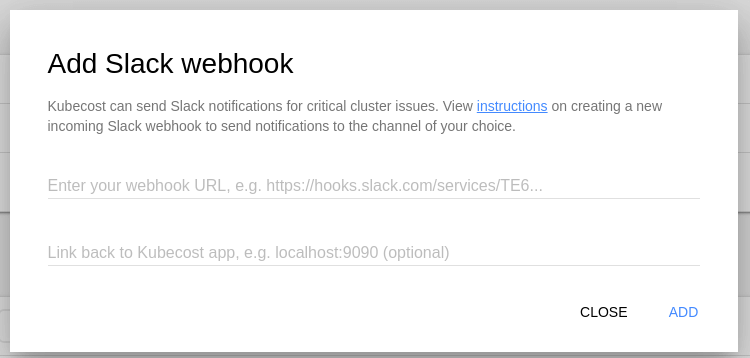
If you need to set up Slack or Email notifications, this is the section you want to look at.
Slack notification will only require a Slack Webhook. See screenshots below:
Additional Information
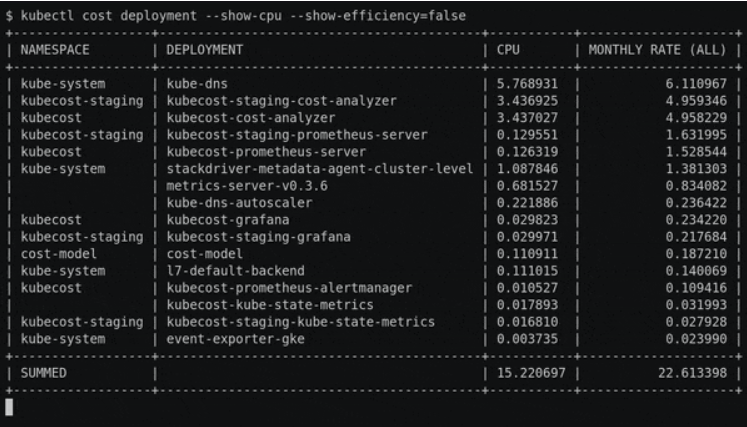
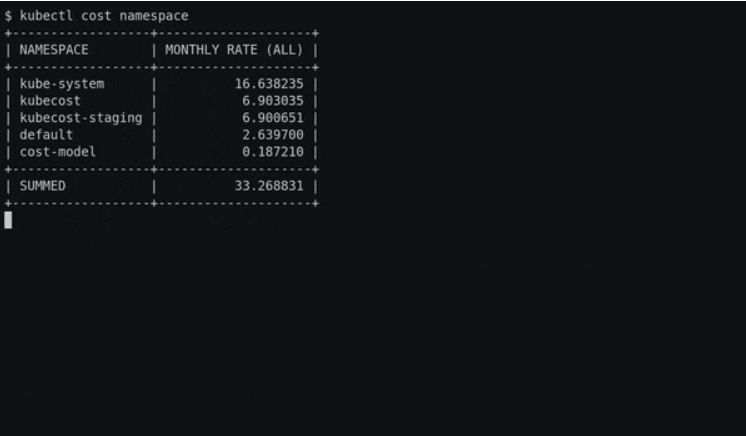
If you are a CLI person and do not want to use Kubecost's WebUI, you could always try this kubectl plugin you can install and use. Here's a preview on what it looks like:
Conclusion
Kubecost is an indispensable tool when managing Kubernetes clusters. It gives us a quick and efficient way to visualize the detailed cost for the clusters of our clients, and we can always keep a low bill while maintaining an optimized cluster. What makes Kubecost unique is its simplicity in deploying the tool and using it.
Subscribe to my newsletter
Read articles from Jens Tan directly inside your inbox. Subscribe to the newsletter, and don't miss out.
Written by
