Series: Monitoring and Tracing Kubernetes Services with Otel
 NearForm
Series: Kubernetes Services Deployment, Autoscaling and Monitoring, part 3
The NearForm DevOps community is always learning and investigating new ways to work with the open source tools we use in our client projects. The nature of the tech industry forces us to confront the ever-changing landscape of open source projects. These projects are constantly being upgraded and improved upon. The pace of change is exciting and constantly improves our applications. This also means our developers stay up to date on the latest trends, technologies and best practices.
The NearForm DevOps community recently did some research on Kubernetes services deployment, autoscaling and monitoring. This article presents the results of their investigation. In particular, the investigation did a deep dive into the following tools:
- Deploying and Autoscaling Kubernetes with Knative
- Autoscaling Kubernetes with Keda
- Monitoring and Tracing Kubernetes with Otel
Kubernetes Overview
Kubernetes (K8s) is an open source platform for automating deployment, scaling, and management of containerized applications. It groups containers that make up an application into logical units for easy management and discovery. Kubernetes builds upon 15 years of experience of running production workloads at Google with best-of-breed ideas and practices from the open source community.
A magic feature of Kubernetes is that it provides a powerful API that enables third-party tools to provision, secure, connect and manage workloads on nearly any cloud or infrastructure platform. It also includes features that help you automate control plane (The main component of kubernetes, it is responsible for controlling an applications’ lifecycle) operations such as rollout cadence, versioning and rollback.
Kubernetes is ideal for organizations that want to run containerized applications at scale.
Many organizations now run entire business functions in containers instead of traditional applications. This paradigm shift requires changes in how IT departments operate – from managing virtual machines to managing container orchestrators like Kubernetes. Business leaders are demanding more agility from their IT departments to support fast-moving projects with new technologies like microservices architecture, serverless computing and cloud native computing platforms like OpenShift Container Platform or Azure Kubernetes Service (AKS).
Background
In previous posts, we introduced some interesting tools like Knative and Keda that can dramatically increase the efficiency of deployments and resource scaling. We want to dive a bit deeper and explore how you can have the best possible visibility over your workload internals through optimal service instrumentation. Observability of these workload internals is becoming more and more important.
Observability lets us understand our systems from the outside, allowing us to ask questions about “what’s going on” without knowing details about how these systems work. Furthermore, it allows us to easily troubleshoot and handle novel problems (i.e. “unknown unknowns”, it means latent or potential problems that can be detected prematurely) providing rich, real-time information about the running resources
As a way to achieve observability and insight into the questions above, our applications must be properly instrumented. It means the application code must emit some signals. These signals can be traces, metrics and logs. A well-instrumented application can provide all the needed information for troubleshooting without deploying any changes to the application.
- Traces records the paths taken by requests (made by an application or end-user) as they propagate through multi-service architectures, like microservice and serverless applications
- Metrics are aggregations over a period of time of numeric data about your infrastructure or application. Examples include: system error rate, CPU utilization, request rate for a given service
- Log is a timestamped message emitted by services or other components.
OpenTelemetry
Nowadays microservice architectures let developers build and release applications with independence and speed like never before because they are no longer bound to the rigid processes related to monolithic architectures.
As more and more services are built, it becomes extremely difficult for developers to understand how these services depend on, interact with, and affect other services. This is especially true during deployments or an outage. Observability activated by OpenTelemetry makes it possible for developers and operators to have a consistent and centralized place to have visibility into their systems
The Observability Tower of Babel
In the past, the way to get code instrumented would vary depending on the backend as each tool (NewRelic, DataDog, Dynatrace, etc) has its own data format, agents and libraries for emitting the signals. This means that if you want to switch the observability backend, you would have to re-instrument your code and configure new agents to be able to emit telemetry signals to the new backend.
Understanding the necessity of standardization, the cloud community came together and merged two projects (OpenTracing and OpenCensus) to create OpenTelemetry (OTel for short).
OTel was born to provide a set of standardized, vendor-agnostic SDKs, APIs and tools for sending, ingestion and transformation of data to an observability backend (whether open source or commercial vendor).
Observability Signals
Logs
Logs are time-stamped messages generated by a component or service. Unlike traces, logs are not necessarily associated with a particular user transaction or request. Most systems emit logs and it used to be the main tool used by system administrators to understand what’s going on with their systems
Sample log:
INFO -- : [6459ffe1-ea53-4044-aaa3-bf902868f730] Started GET "/" for ::1 at 2021-02-23 13:26:23 -0800
Unfortunately, logs don’t help when we need to track software execution and correlate messages with user actions. It’s worse in an environment with dozens of microservices and that makes it nearly impossible to gain a clear understanding when only using logs, unless it’s part of a span.
Spans
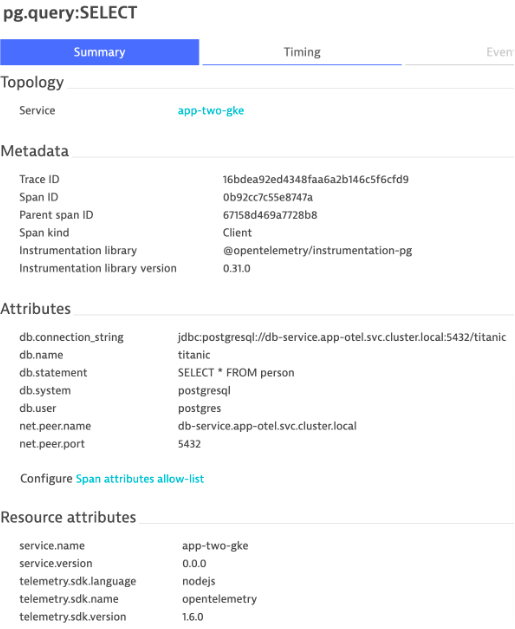
A span represents the smaller unit of work or operation. It tracks and represents specific actions that compose a transaction, painting a picture that shows what happened during the time which the transaction is executed
Below is an example of a span related to a database query:
Distributed Traces
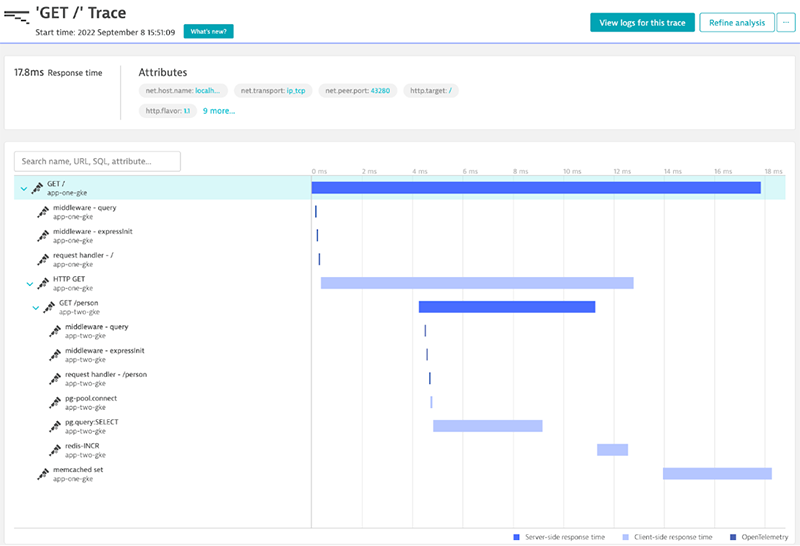
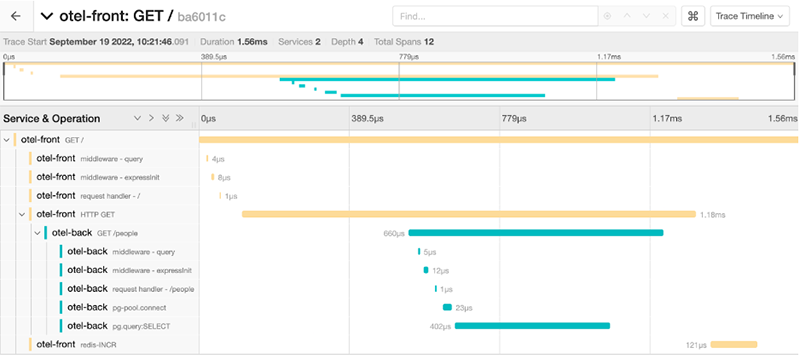
A distributed trace, or simply trace, records and correlates the paths taken by a request or transaction, as they propagate through services, components and systems providing a grouped vision of one or more spans
An example of a distributed trace:
OTel Components
OTel consists of the following primary components:
- Cross-language specification
- Tools to collect, transform, and export telemetry data (Collector)
- Per-language SDKs
- Automatic instrumentation and contrib packages
A real-world example
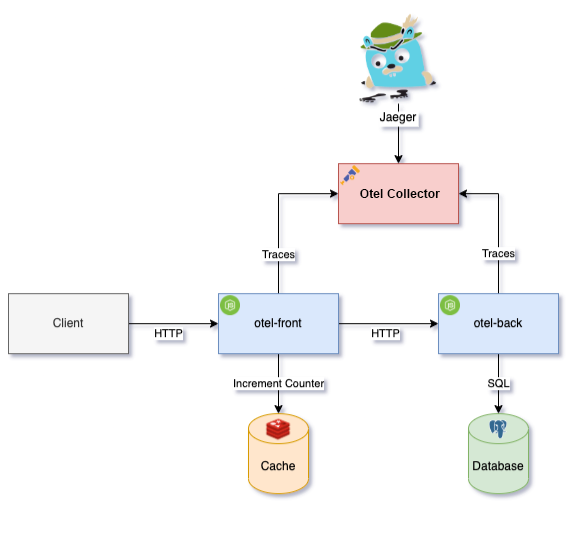
To understand how Otel works in practice we have implemented a complete example that simulates a small microservice-oriented architecture environment. You can run this example using docker-compose, and it contains the following resources:
- Database: A PostgreSQL instance that contains some data
- Redis: A Redis instance to store a requests counter
- Otel Front: A NodeJS application that exposes an endpoint to get a list of people. This application requests the data to another application, Otel Back and then increases the request counter in Redis
- Otel Back: A NodeJS application that expose an endpoint returning a list of people from database
- Client: A script that make requests through Otel Front API
- Jaeger: An all-in-one jaeger application that contains the Otel Collector and the Jaeger UI
Schema
How to instrument a NodeJS application?
Talk is cheap, show me the code.
Let’s see in practice how we can implement observability in a real-world application.
To instrument our services we are using the following @opentelemetry packages:
@opentelemetry/exporter-trace-otlp-proto@opentelemetry/instrumentation-express@opentelemetry/instrumentation-http@opentelemetry/instrumentation-pg@opentelemetry/instrumentation-redis-4@opentelemetry/resources@opentelemetry/sdk-node@opentelemetry/sdk-trace-node
The instrumentation script looks like this:
//src/tracer.ts
const init = function (serviceName: string, otlpUrl: string, otlpApiToken: string) {

 console.log(`Initializing tracing of ${serviceName} to ${otlpUrl}`)

 diag.setLogger(new DiagConsoleLogger(), DiagLogLevel.INFO);

 const exporter = new OTLPTraceExporter({
   url: otlpUrl,
   headers: {
     Authorization: `Api-Token ${otlpApiToken}`,
   },
   concurrencyLimit: 10,
 })

 const resource = new Resource({
   [SemanticResourceAttributes.SERVICE_NAME]: serviceName,
   [SemanticResourceAttributes.SERVICE_VERSION]: '0.0.0'
 })
 const provider = new NodeTracerProvider({resource});
 provider.addSpanProcessor(new BatchSpanProcessor(exporter, {
   maxQueueSize: 200,
   scheduledDelayMillis: 10000,
 }));

 provider.register();

 const sdk = new NodeSDK({
   sampler: new AlwaysOnSampler(),
   instrumentations: [
     new ExpressInstrumentation(),
     new PgInstrumentation({ enhancedDatabaseReporting: true }),
     new HttpInstrumentation(),
     new RedisInstrumentation(),
   ],
 });

 sdk.start()
}
Note, the init function must be called before all statements including the initialization of express for everything to work correctly.
//index.ts
import init from './tracer'

const serviceName = process.env.SERVICE_NAME || "otel-service"
const otlpUrl = process.env.OTLP_URL || "http://localhost:4318/v1/traces"
const otlpApiToken = process.env.OTLP_API_TOKEN || ""

init(serviceName, otlpUrl, otlpApiToken)

//below here you put the effective application code
As you can see, a huge benefit of this approach is that the Otel instrumentation is completely decoupled from the application business logic.
Running the project
To run the example project clone the repository https://github.com/nearform/knative-articles.git
and in the otel folder run the command docker-compose up.
Access to Jaeger UI: http://localhost:16686/search
Final Thoughts
The Otel ecosystem provides a complete set of tools and standards for observability. You can change the backend (for Dynatrace or Newrelic for instance) just by changing the variables OTLP_URL and OTLP_AP_TOKEN as the main Observability SAS providers support the OTLP protocol now. It’s a great feature as you can choose and change it at any time without code modifications.
Otel is a young but very promising project and it is continually improving.
I hope this content is meaningful to you and that you could learn more about Otel from it.
Subscribe to my newsletter
Read articles from NearForm directly inside your inbox. Subscribe to the newsletter, and don't miss out.
Written by
