Learning IT While Teaching
 Kevin Smith
Teaching
I'm an ex-pat teacher teaching AP Calculus and AP Statistics at a large International School in Sarajevo, Bosnia and Herzegovina. This is my fourth country in the last nine years. I've always been interested in technology ever since I bought my first Apple IIc computer back in the days.
R and RStudio
While teaching statistics years ago, I became interested in the R programming language. I learned enough to start teaching my students R with RStudio. After a few years more, I also taught my students ggplot, tidyverse, and how to use pipes and RMarkdown. Last year I took the plunge and completed my Google Data Analytics Certification on Coursera. I really enjoyed those classes.
But I wanted to know more. I wanted to know the latest technologies. It's easy for the world to pass you by when you focus on your students and teaching all the time. Last year I was completely absorbed in teaching calculus, statistics, and physics that I had little time to read and learn new things. Over the summer, when I had time to read and think, I learned about different cloud technologies and became very interested. I decided to learn more and see where it takes me.
I have become interested in learning about AWS cloud technologies. So to begin, I have started to learn more by studying for the AWS Cloud Practitioner Certification. I am going through the AWS free online training and I also will go through the Udemy course after.

I'm using Anki to help me learn all the vocabulary. I've been using Anki for years so I'm familiar with spaced repetition. I'll also write more about Anki as I go along. My goal is to learn more about Data Analytics and Machine Learning. I also want to start using RMarkdown here so I don't forget the syntax.

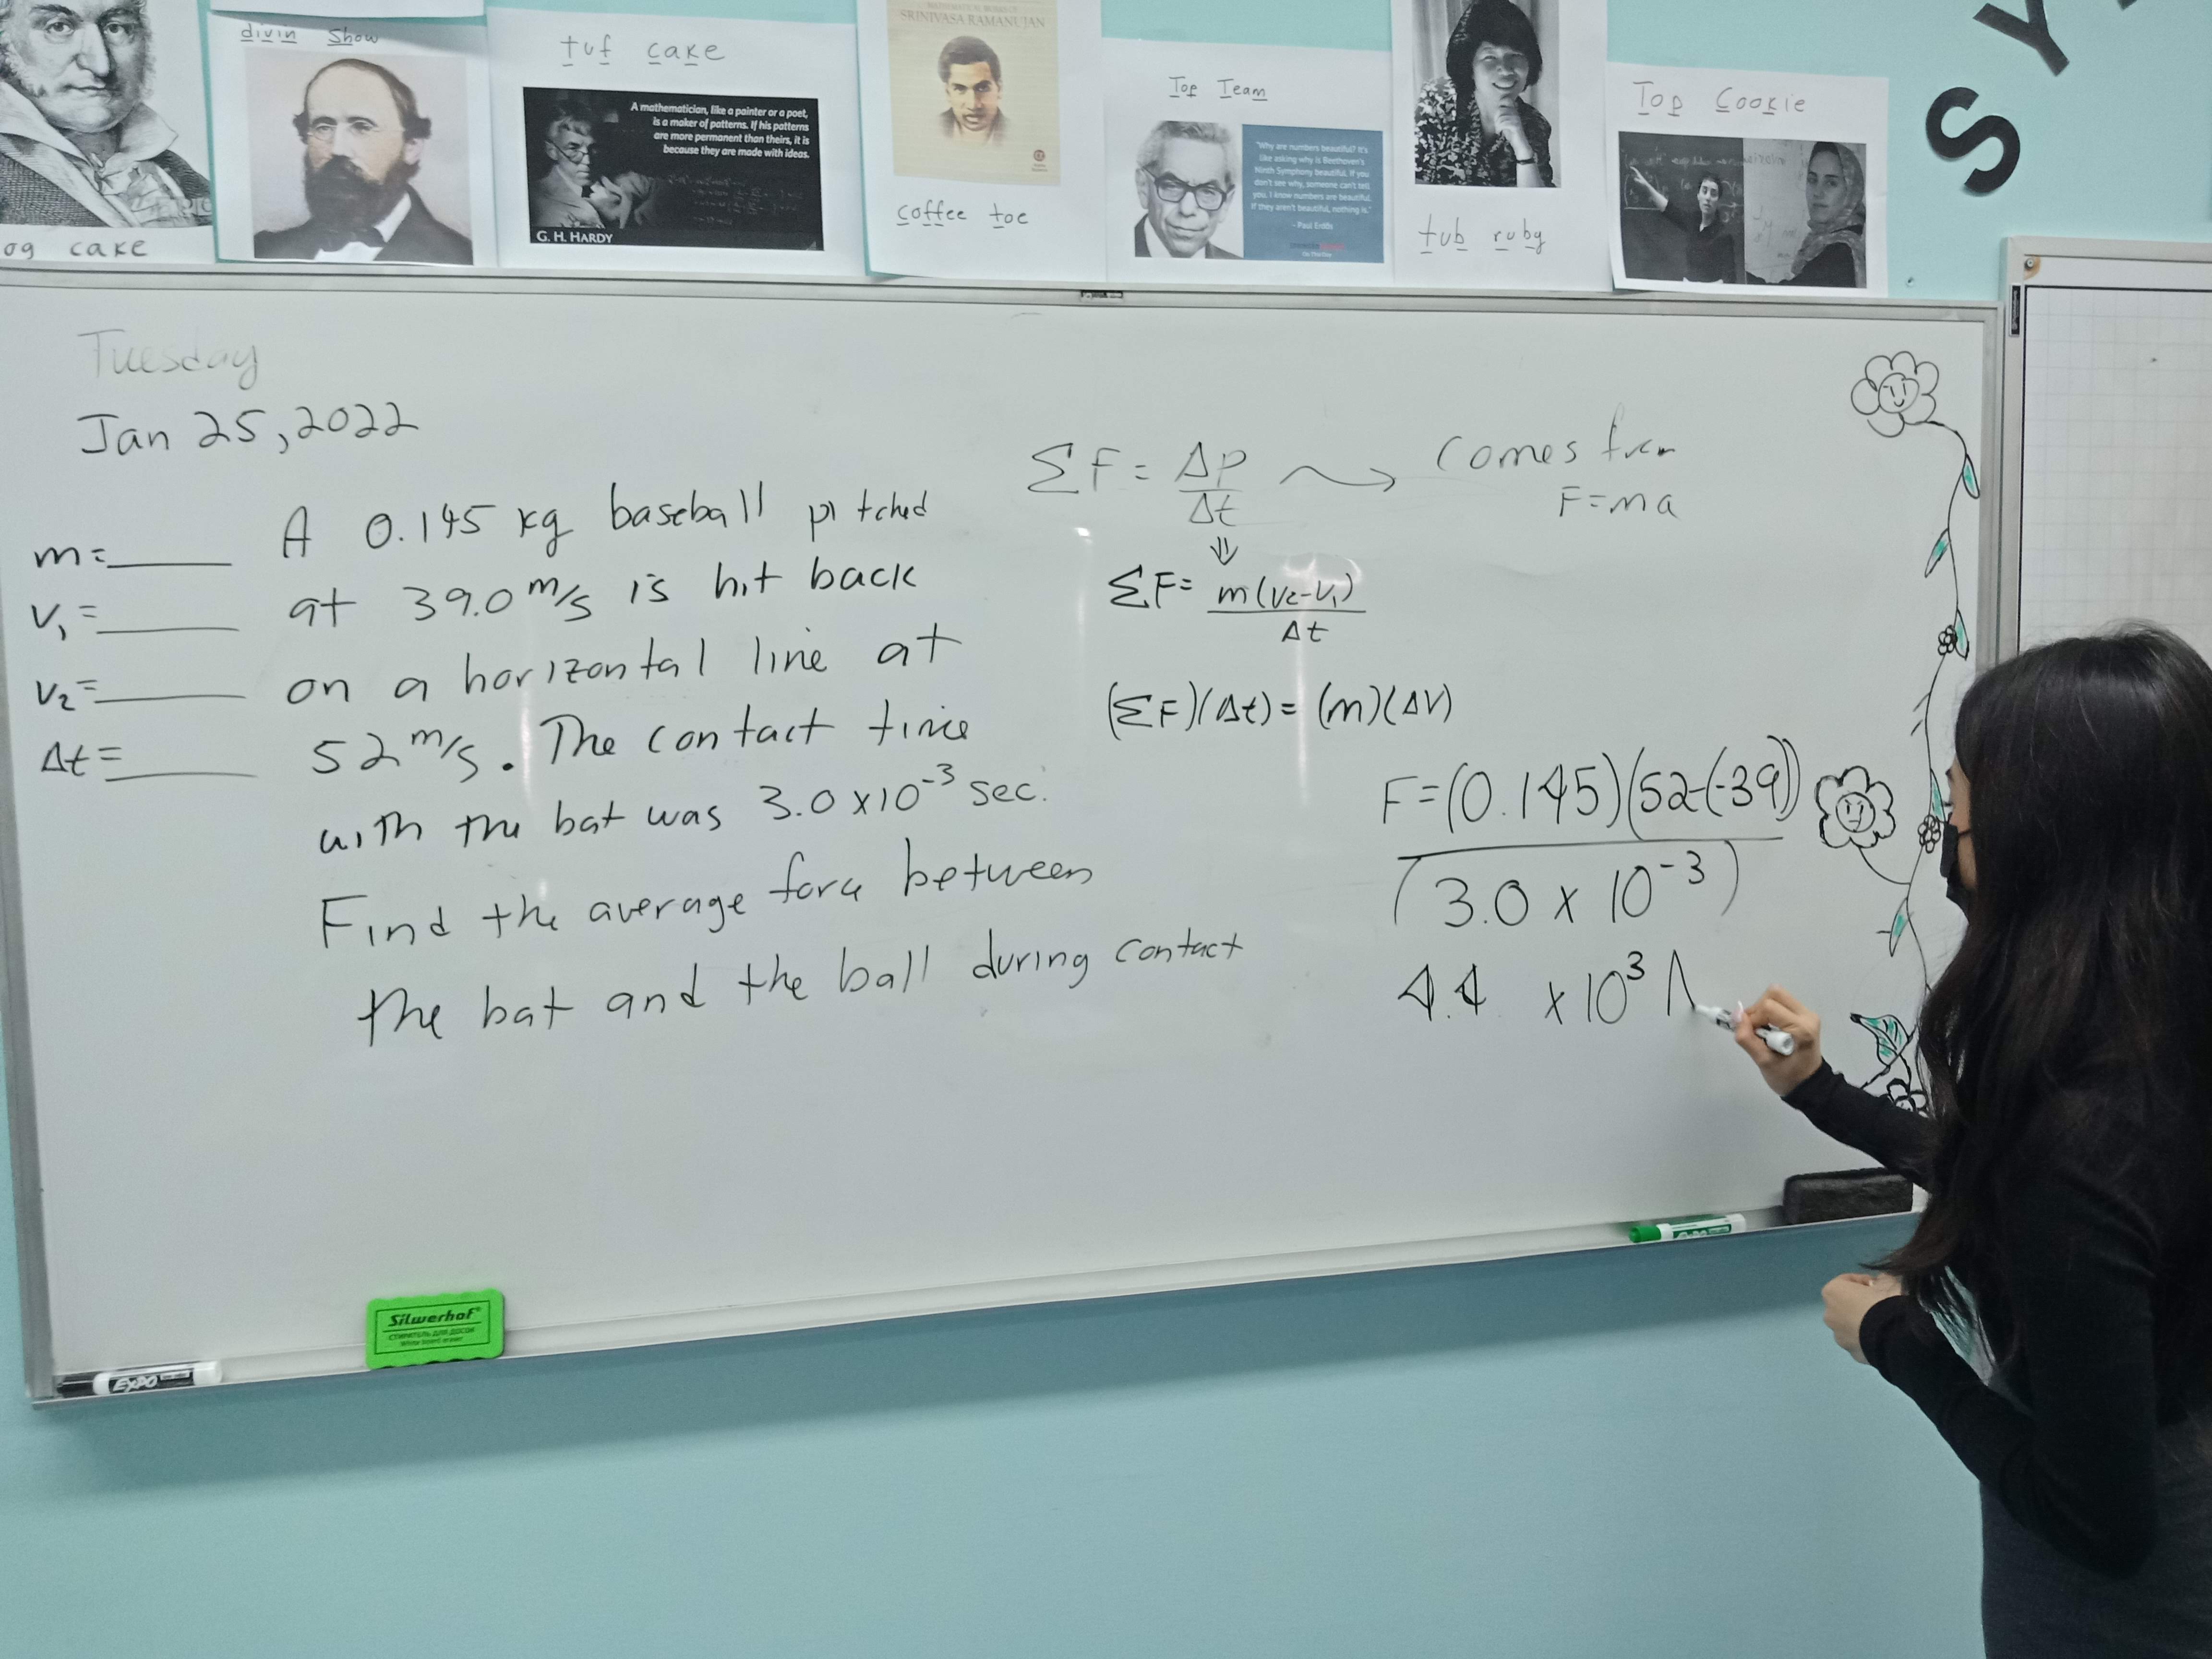
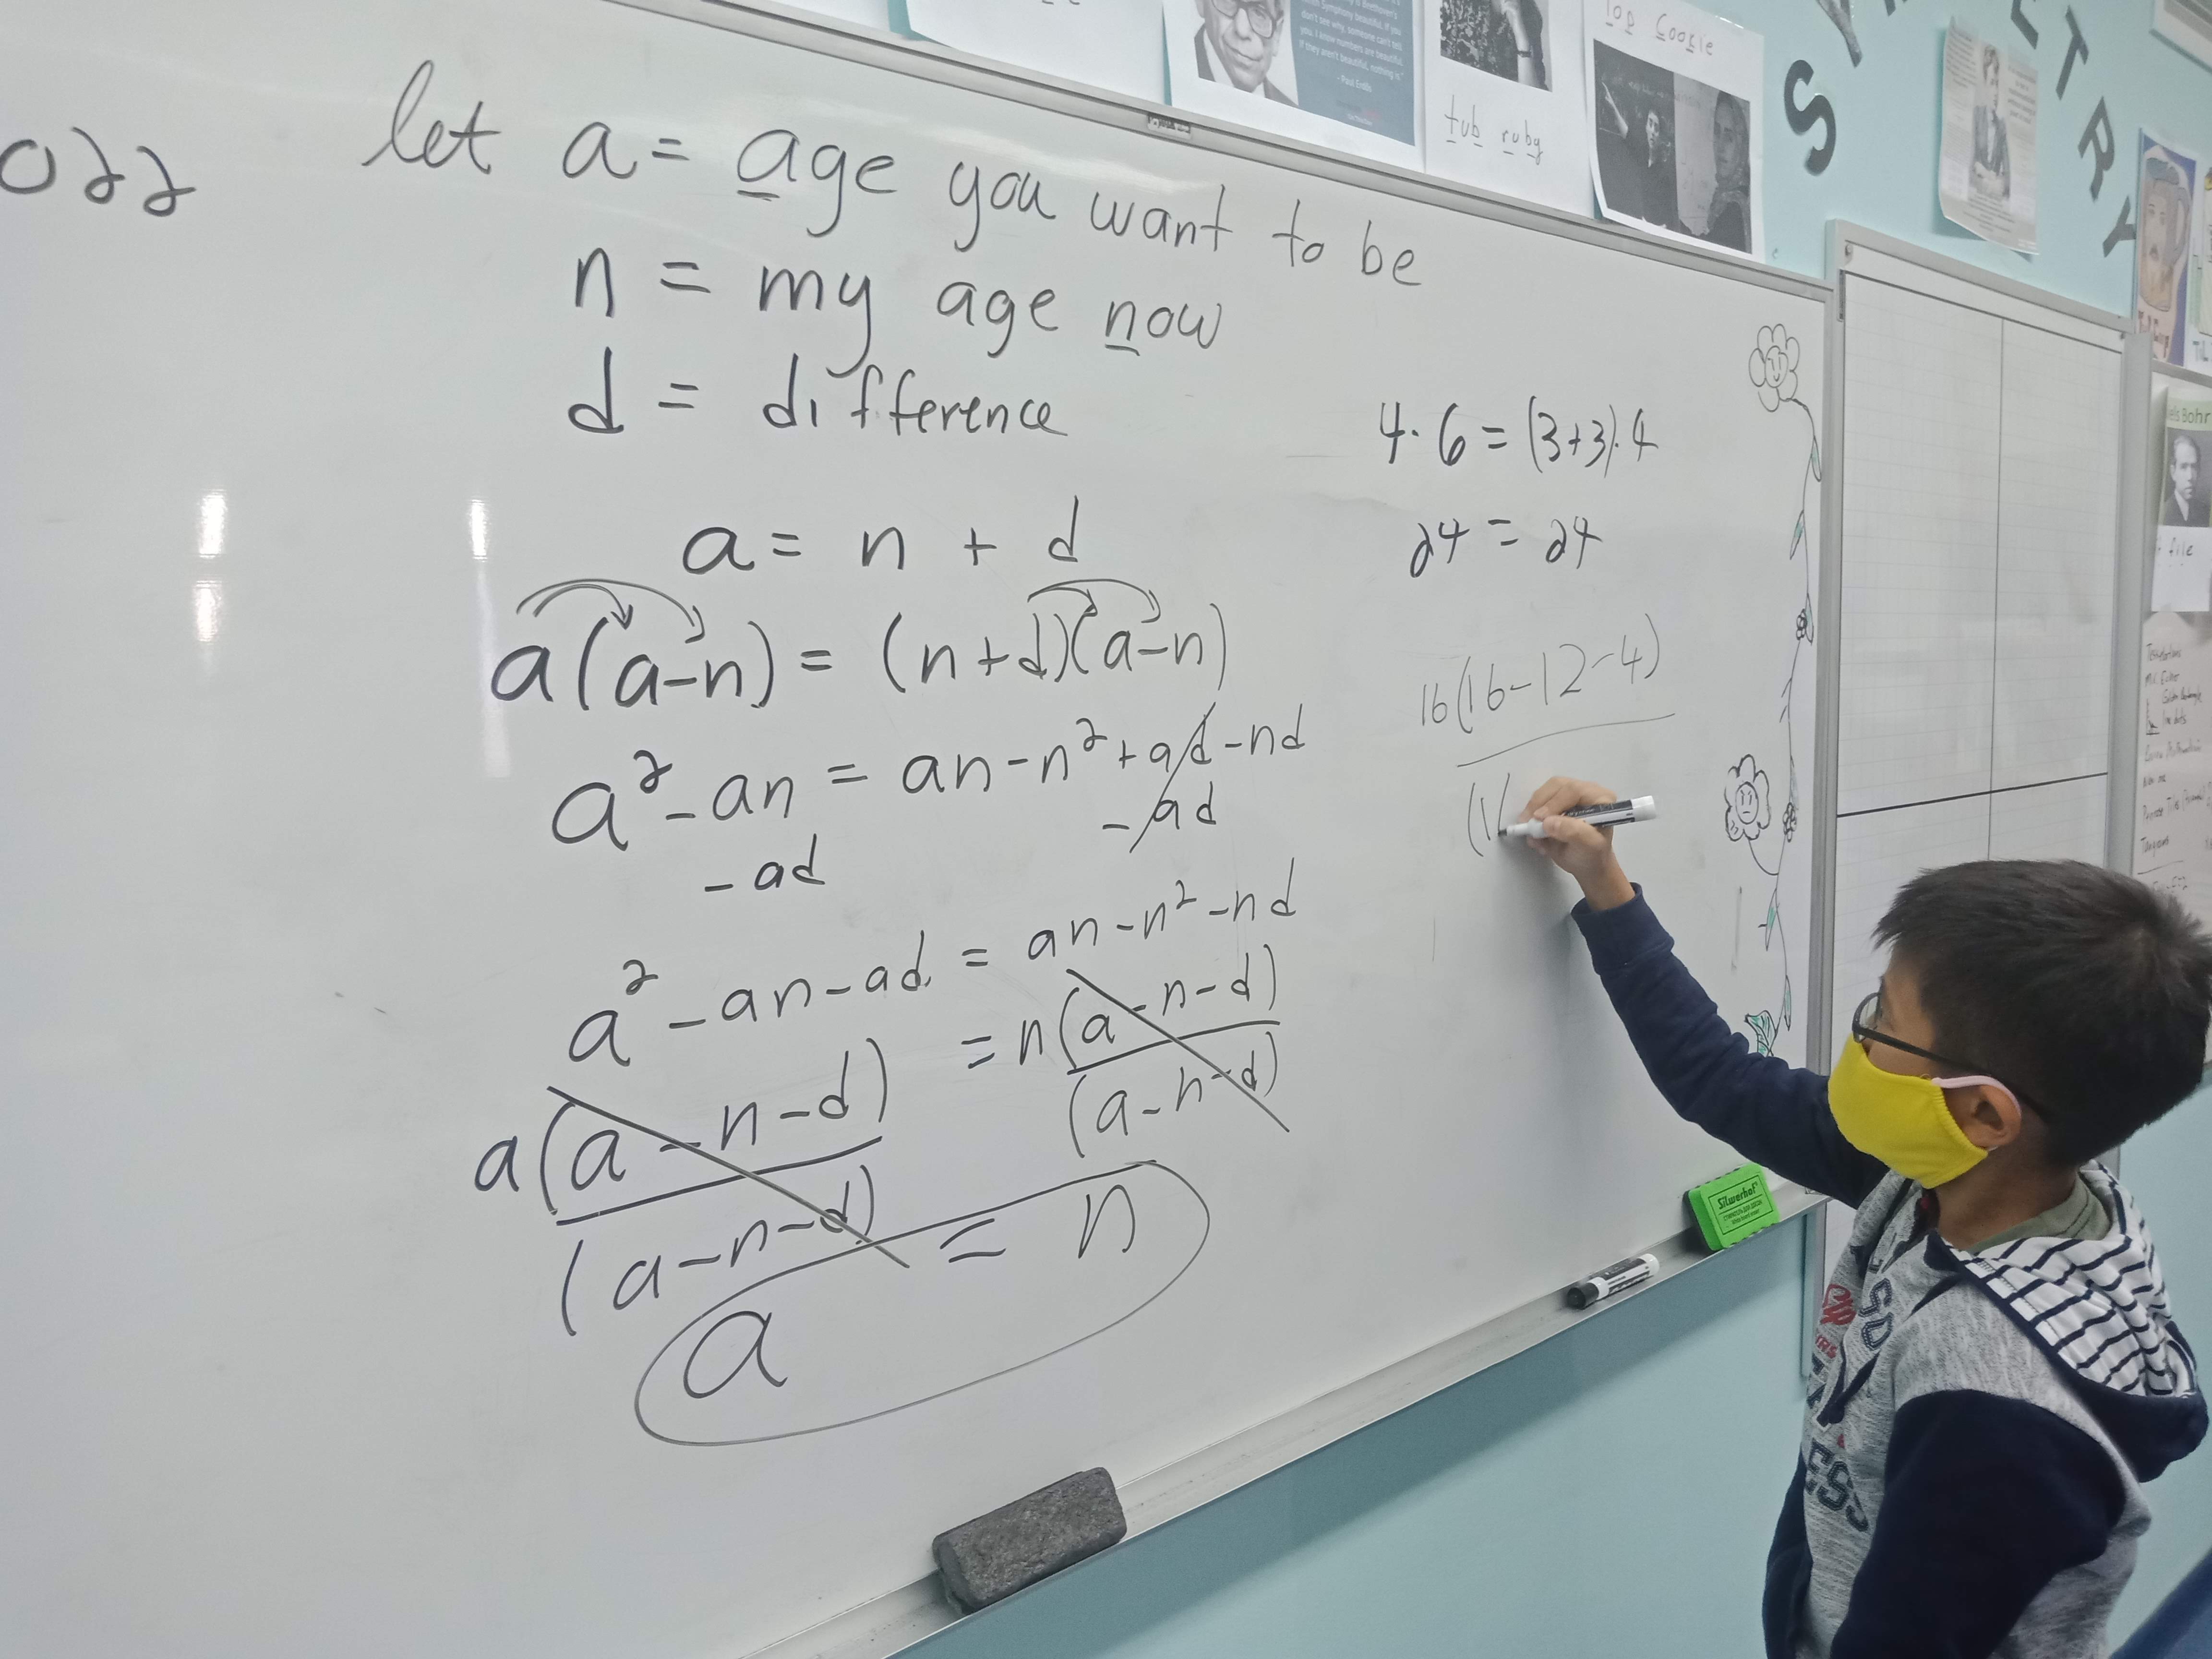
Here are a few pictures from my classroom last year in Kazakhstan. I hope to write here once a week to keep me motivated.
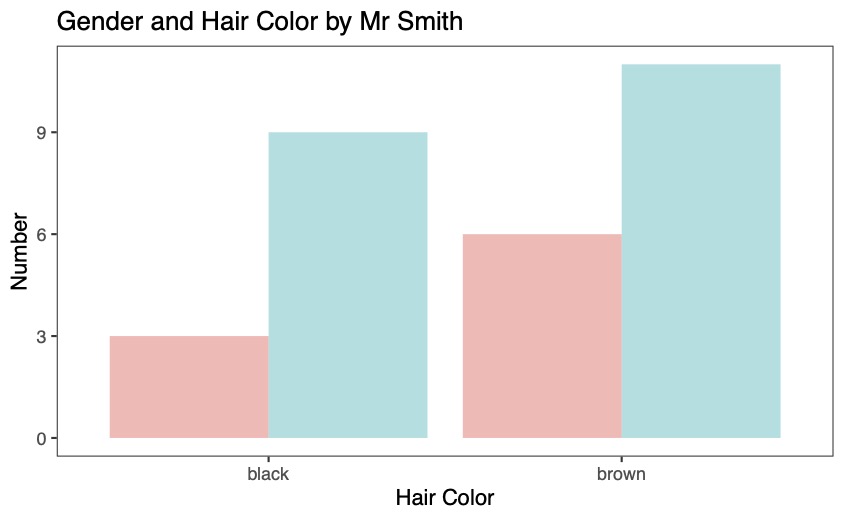
Here is some R code we wrote last year in our stats unit.
starwars %>% filter(hair_color=="black" | hair_color=="brown") %>%
 drop_na(sex) %>%
    ggplot(aes(hair_color,fill=sex))+ geom_bar(position = "dodge",
          alpha=0.5)+ theme_bw()+ theme(panel.grid.major =
element_blank(), panel.grid.minor= element_blank(), legend.position = "name")+
labs(title = "Gender and Hair Color by Mr Smith",
x="Hair Color", y="Number")
And here is the plot

Have a great day.
Subscribe to my newsletter
Read articles from Kevin Smith directly inside your inbox. Subscribe to the newsletter, and don't miss out.
Written by

Kevin Smith
Kevin Smith
I am an ex-pat AP Calculus and AP Statistics teacher working at a large International School in Sarajevo. I teach my students R programming with RStudio using the ggplot and tidyverse packages for visualizations. Last summer I completed my Google Data Analytics Certification. I am currently working on my AWS Cloud Practitioner certification. I am also studying networking with the goal of taking the CCNA exam in six months. I am fascinated by cloud technology and networking and I want to continue learning more with the end goal of being proficient in AWS Data Analytics and AWS Big Data.