Installing Xdebug 3 on MacOS and Debug in VS Code
 ScriptMint
I always found setting up Xdebug as one of the most difficult job. But today, I did it under 5 minutes.
Hi, I am a Full Stack Developer working with Laravel, Vue.js & Tailwind CSS.
If you don't use right tool for debugging, you may end up spending your whole day by doing nothing.
How do you debug your code in PHP? Do you use var_dump or dd in Laravel? Many of us also use logger to log output & figure out the problem in multiple steps. Spatie built a debugging tool called Ray that one can use to simplify the operation over dd or logger.
I like to debug Laravel application with Xdebug. Xdebug is an extension for PHP, and provides a range of features to improve the PHP development experience.
Today after I reset my MacBook, I had to setup Xdebug and I did the installation under 5 minutes. So I thought to write a blog explaining how easy it is to setup Xdebug.
Earlier, whenever I used to install Xdebug, I had to look for multiple articles to make it work. Let me clarify, you don't need any Chrome Extension and also you don't need too much configurations. Its super simple.
I use Homebrew to install various packages on my MacBook. I have already installed PHP 8.1 using homebrew by running below command:
brew install php@8.1
Next, you need to install Xdebug PHP Extension which you can install using below command.
pecl install xdebug
My MacBook Setup for Development! Read this article here.
Next, you must enable this extension in your php.ini file. To enable it, locate the php.ini file location. In my case it is located under /usr/local/etc/php directory.
You can either edit your php.ini file and add some config option for Xdebug or create a separate config file for this extension. I choose to go with second option and created a file called ext-xdebug.ini under /usr/local/etc/php/conf.d directory. You just need to put below config in this ext-xdebug.ini file.
zend_extension="xdebug.so"
xdebug.mode=debug
xdebug.start_with_request=yes
If you wish edit your php.ini file, you can put these lines at the bottom.
Restart the PHP service using brew command:
brew servcies restart php
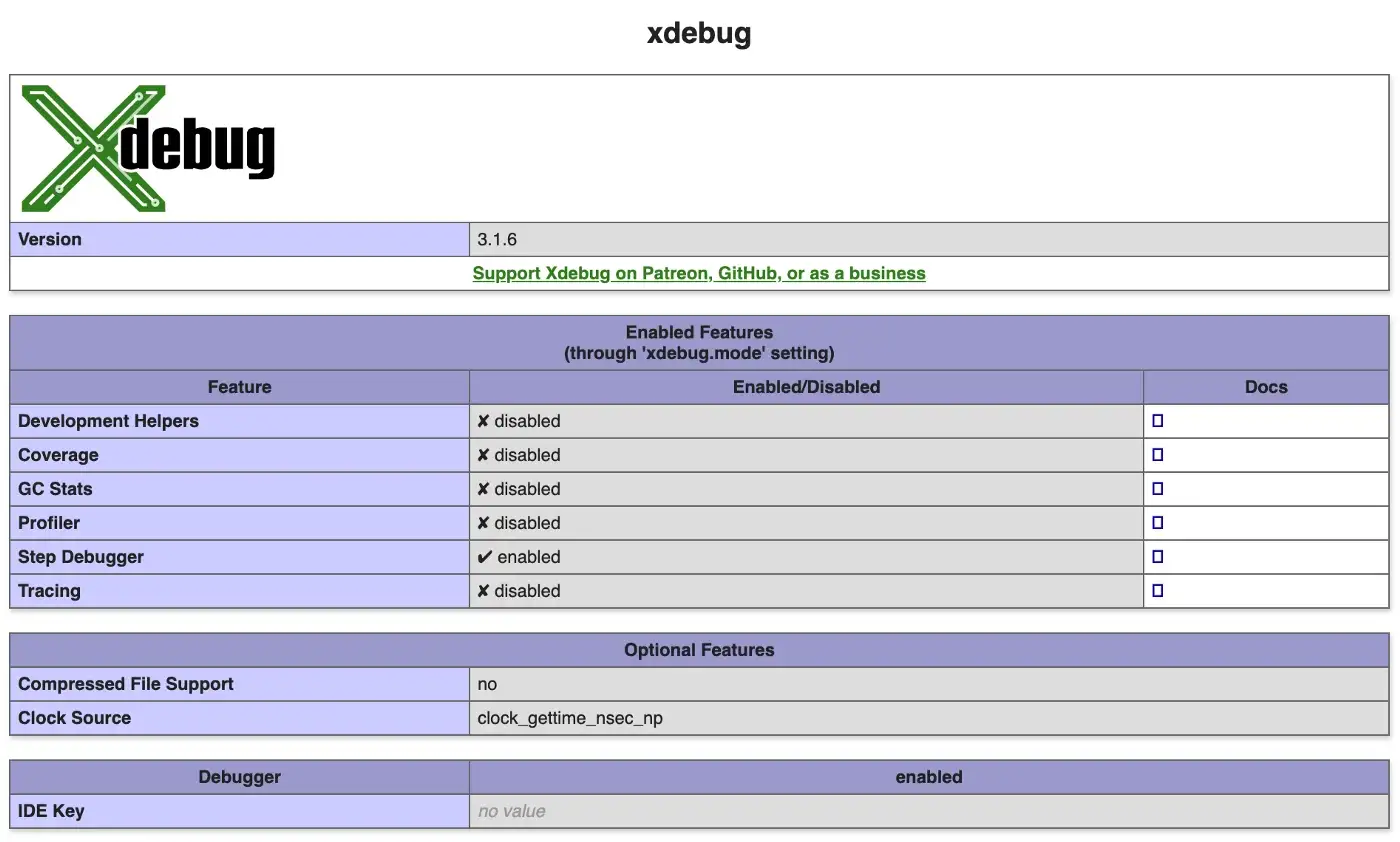
Next, you can run php --version command to check if shows Xdebug extension.

Alternatively, You can call phpinfo function in any PHP file and it should show Xdebug related information.
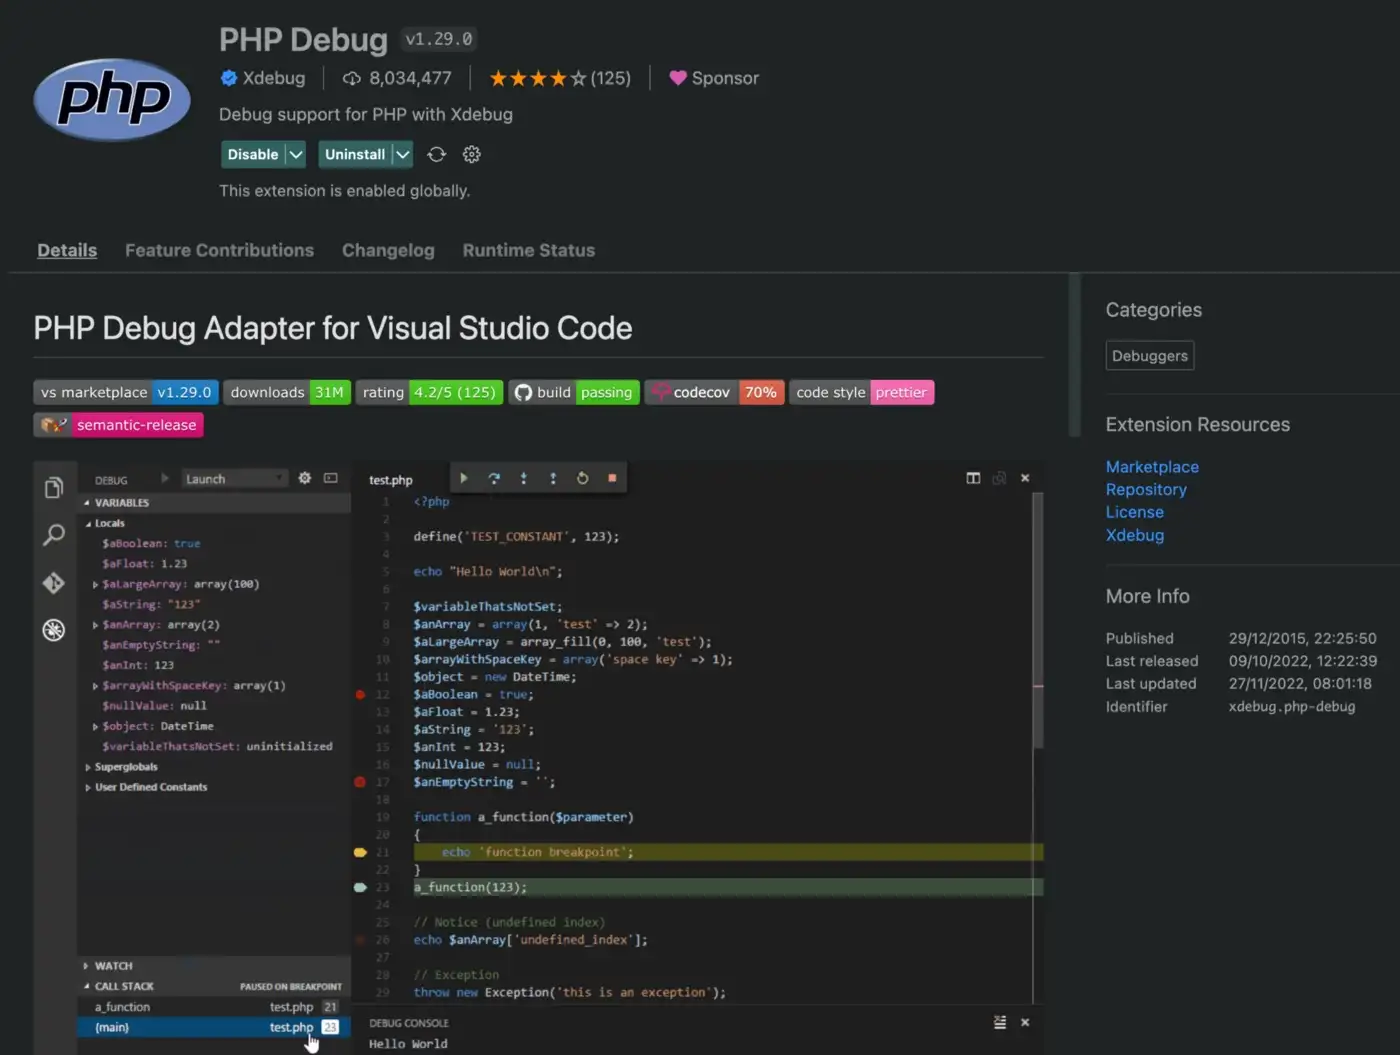
Next, Open VS Code & Install PHP Debug Extension.
Now, open your project in VS Code, create launch.json config file under .vscode directory with following content:
{
    "configurations": [
        {
            "name": "Listen for Xdebug",
            "type": "php",
            "request": "launch",
            "port": 9003,
        }
    ]
}
This is project specific setting which you need to do in every project wherever you wish to debug your application using Xdebug.
By default Xdebug is listening to port 9003 as you can see in the VS Code PHP Debug extension.
That's all you need to do. Its super simple.
Now its time to debug your application. Open any PHP file, put a breakpoint, press F5 to start debugging and navigate to your browser. You will be redirected back to the VS Code at the same line where you put a breakpoint.
Here, I opened Laravel's web.php file and put a breakpoint. Here is the screenshot of debugging:
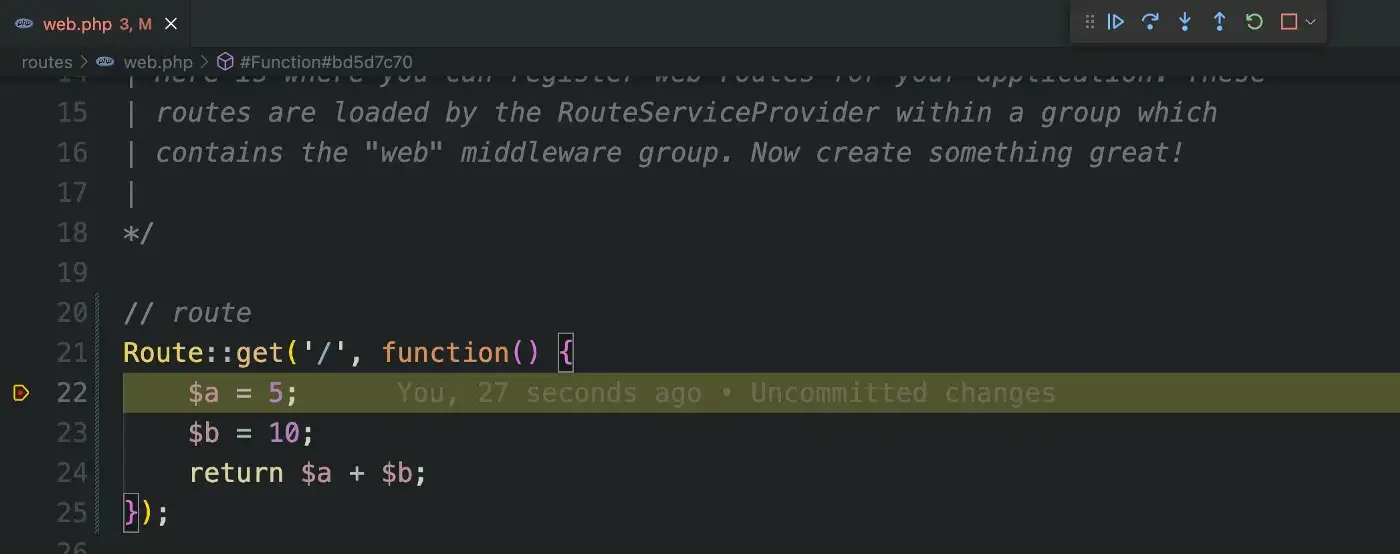
You can use the control buttons to perform various moves.
I love code debugging using Xdebug. It can save your precious time & also improves the productivity.
Subscribe to my newsletter
Read articles from ScriptMint directly inside your inbox. Subscribe to the newsletter, and don't miss out.
Written by
