Exploratory Data Analysis on Meteorological Data.
 Muhammad Abuzar
This blog article is a sum up of EDA done in this repository. The data is taken from Kaggle here.
About Dataset and the motive behind the attempt:
It is a 10 years meteorological data of Finland taken from 2006 to 2016. Various factors like temperature, humidity and visibility were recorded multiple times a day. We have a Null Hypothesis H0 which states "Does the Apparent temperature and humidity compared monthly across 10 years of the data indicate an increase due to Global warming."
Our aim is to prove or disprove this Hypothesis.
Data Overview
The data shape is 96453 by 11. Features include :
- Formatted Date
- Summary
- Precipitate Type
- Temperature (Celsius)
- Apparent Temperature
- Humidity
- Wind Speed
- Wind Bearing
- Visibility
- Pressure (millibars)
- Daily Summary
All these features are self explanatory so we'll just dive into the process of EDA.
Wind Speed
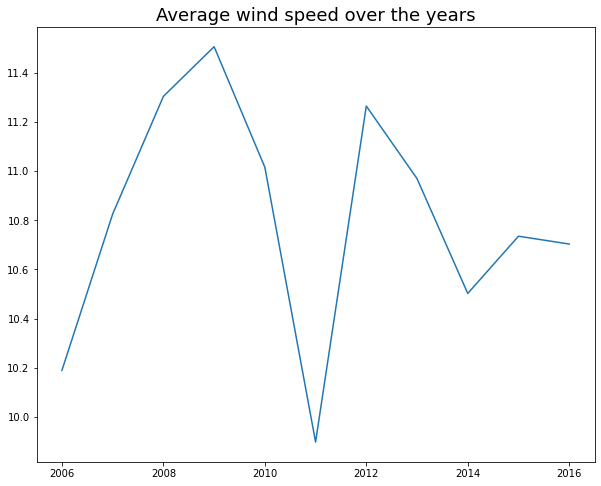
As show below, the wind speed over the years have been consistent, fluctuating between 10 and 11 with a few anomalies.
Visibility
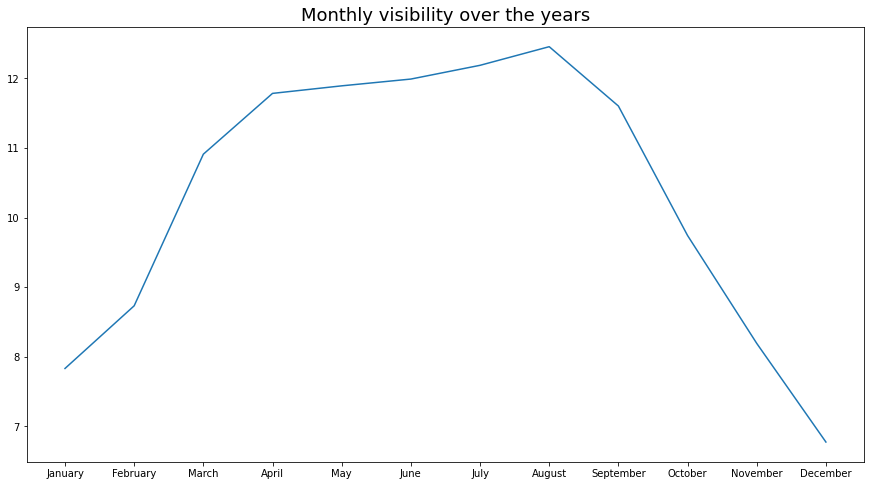
Average monthly visibility during the decade shows that visibility peaked during summer months and was at its minimum during winters, which is obvious as during winters, the air is usually colder and more moist than in other seasons. This causes the air to become denser, leading to a higher concentration of water droplets and particles in the atmosphere. These particles scatter and absorb light, reducing its visibility. Additionally, the shorter days and longer nights in winters also lead to reduced visibility due to less sunlight.
Temperature
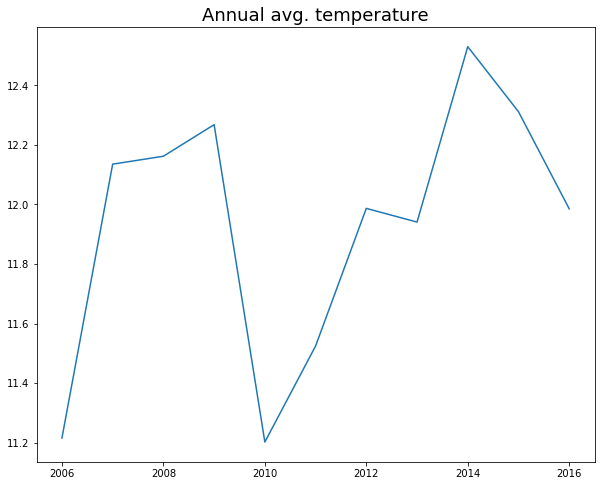
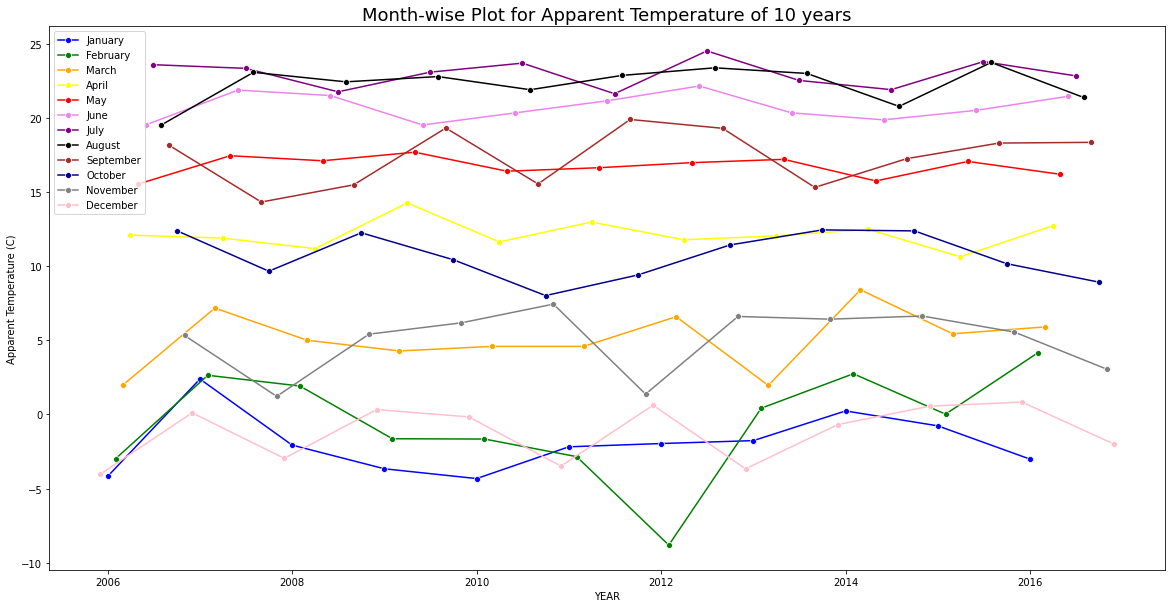
The temperature, however, has increased slightly over the years. The least annual average temperature was recorded in the early 3 years while the highest recorded annual temperature was recorded in the last 3 years. Temperature peaked during 2014 and 2015.
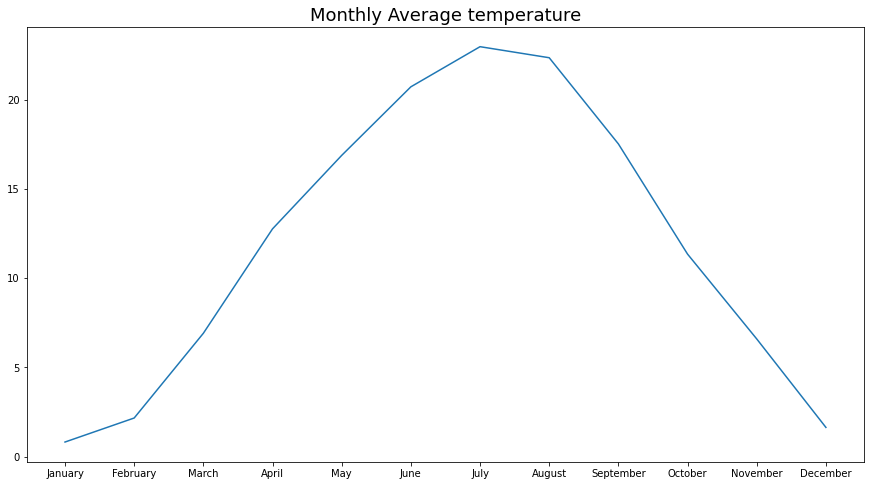
Monthly average temperature bar though shouldn't come as a surprise. Max average temperature was recorded during summer months.
Humidity
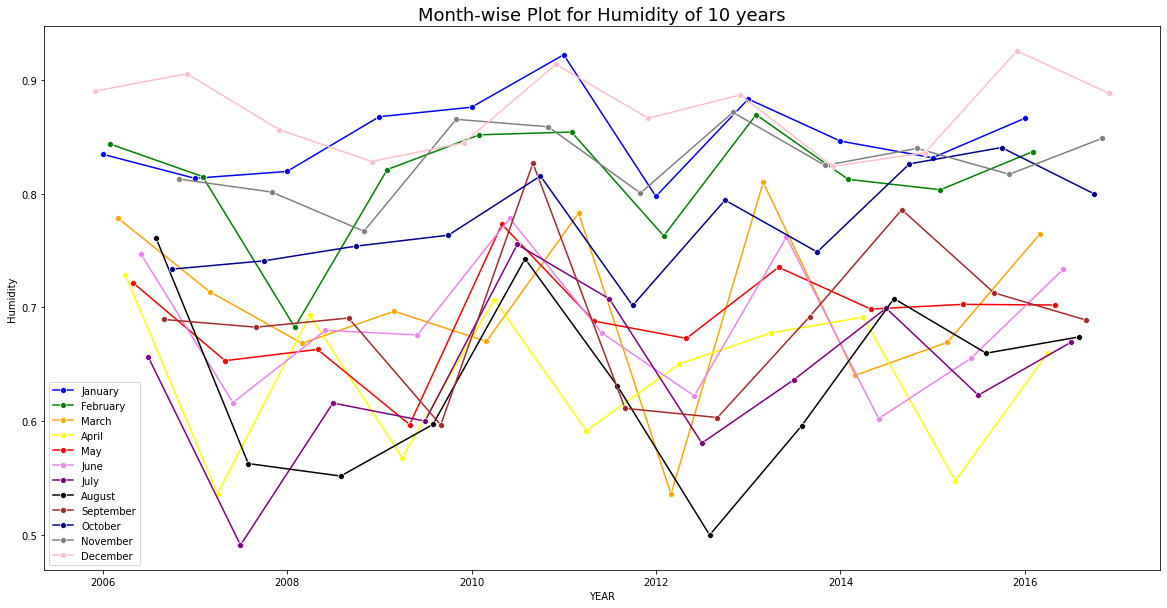
Monthly average humidity over the years has been consistent as well, the variations are seasonal due to natural factor.
Humidity vs Apparent Temperature Comparisons
These are average humidity vs temperature plots for all the months over the 10 years.
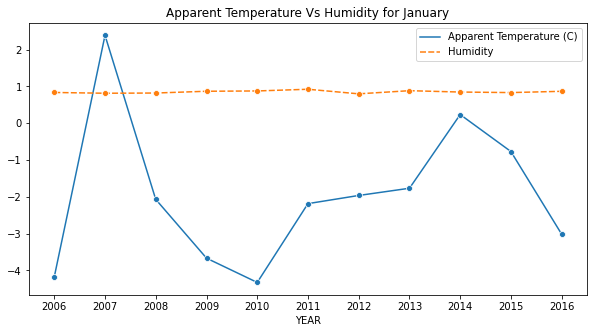
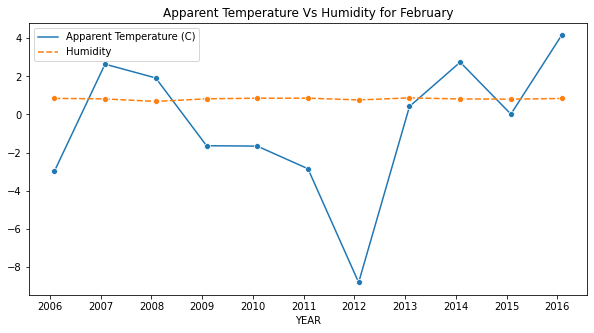
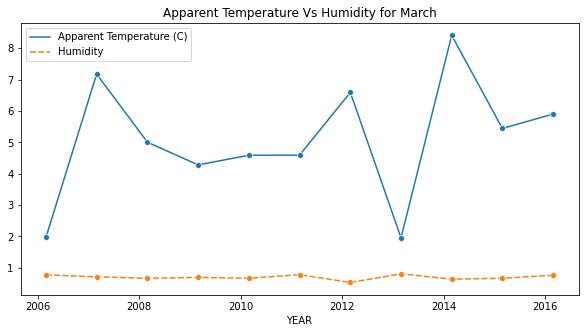
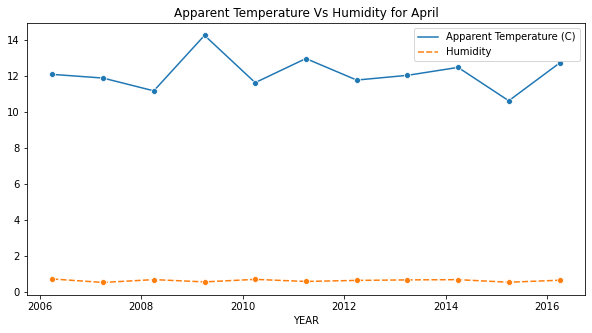
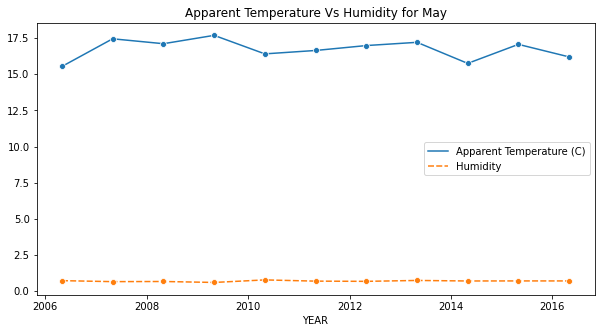
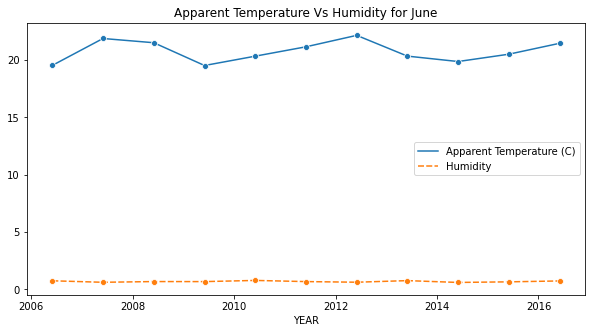
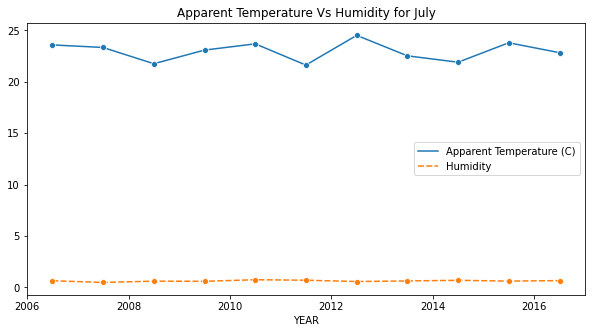
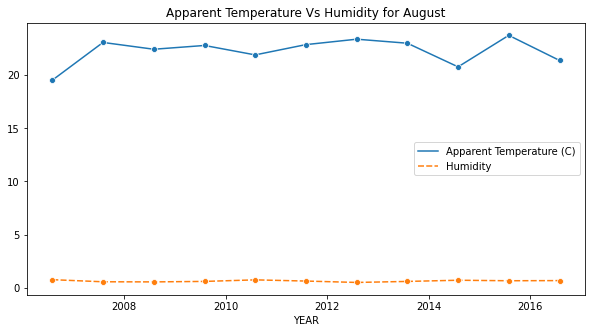
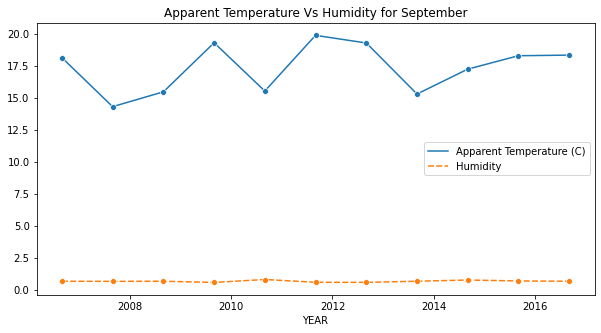
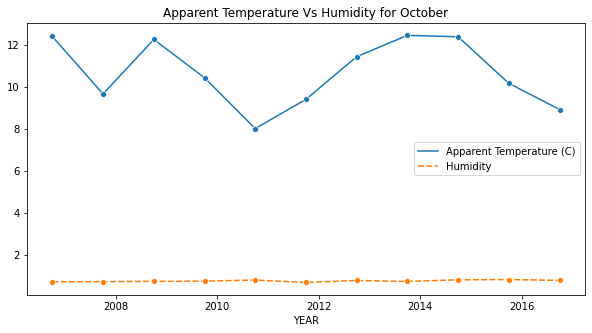
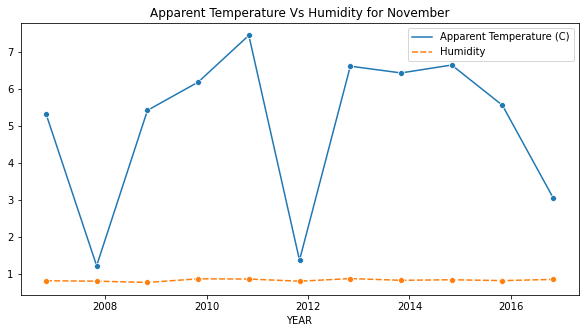
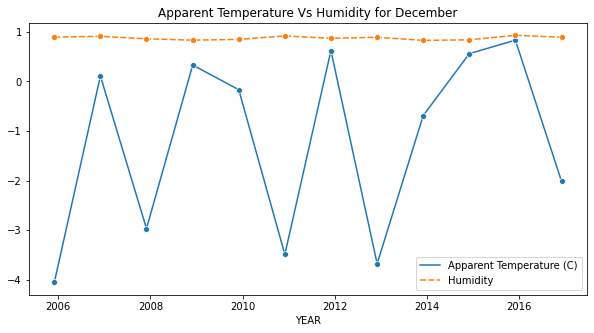
Its evident that the humidity has been consistent over the years but temperature has seen a slight increase. Even a slight increase at a geological scale has devastating effects not only on human health and safety, but to the ecosystem as well. Bear in mind that Finland is a North European country, where the effects of global warming are less compared to countries in Asia Pacific region. Nonetheless this has resulted in earlier blooming of plants and flowers, as well as an increase in the number of pests and diseases that thrive in warmer conditions. The warmer temperatures have also led to the melting of glaciers and permafrost in northern Finland, which is causing the land to shift and erode. This is having an impact on the country's infrastructure and wildlife habitats. Furthermore, the warming climate is leading to more frequent and intense heatwaves and storms, which can cause damage to buildings and infrastructure, and pose a risk to human health. Overall, global warming is having a significant impact on Finland's environment, economy, and society, and the country is working to reduce its greenhouse gas emissions and adapt to the changing climate
Subscribe to my newsletter
Read articles from Muhammad Abuzar directly inside your inbox. Subscribe to the newsletter, and don't miss out.
Written by

Muhammad Abuzar
Muhammad Abuzar
I am a graduating Software Engineer, learning Full Stack Web Development and Data Sciences.