Data Insights with MindsDB

Recently I was discussing with a colleague that SQL is a pervasive part of a data stack. Their counterargument was SQL has not yet penetrated the ML world. While I was researching that idea, I encountered MindsDB, an AutoML platform that integrates SQL like interface on top of ML algorithms
Introduction
MindsDB brings machine learning into databases by employing the concept of AI Tables. It provides connectors to integrate with existing databases. These integrated datasets are used to generate predictions by executing SQL Queries.
But any seasoned data scientist will assure you that before training the model, the first step is understanding the data. Luckily MindsDB also provides a data analysis tool as part of its product.
In this blog, we will look at the data insights component of MindsDB by exploring the Manufacturing Industries dataset.
Running MindsDB
MindsDB can be installed either locally or using a cloud offering. Cloud offering allows a free trial of 30 days. For this article, we will run mindsdb using docker in our local environment. To get started with mindsDB, run the below command
docker run -p 47334:47334 -p 47335:47335 mindsdb/mindsdb
This runs mindsdb on api port 47334. The Mysql instance which holds the database objects is running on port 47335. Once the docker container indicates the instance has started, visit http://localhost:47334/ to open the console. This opens the below page showing a SQL interface.
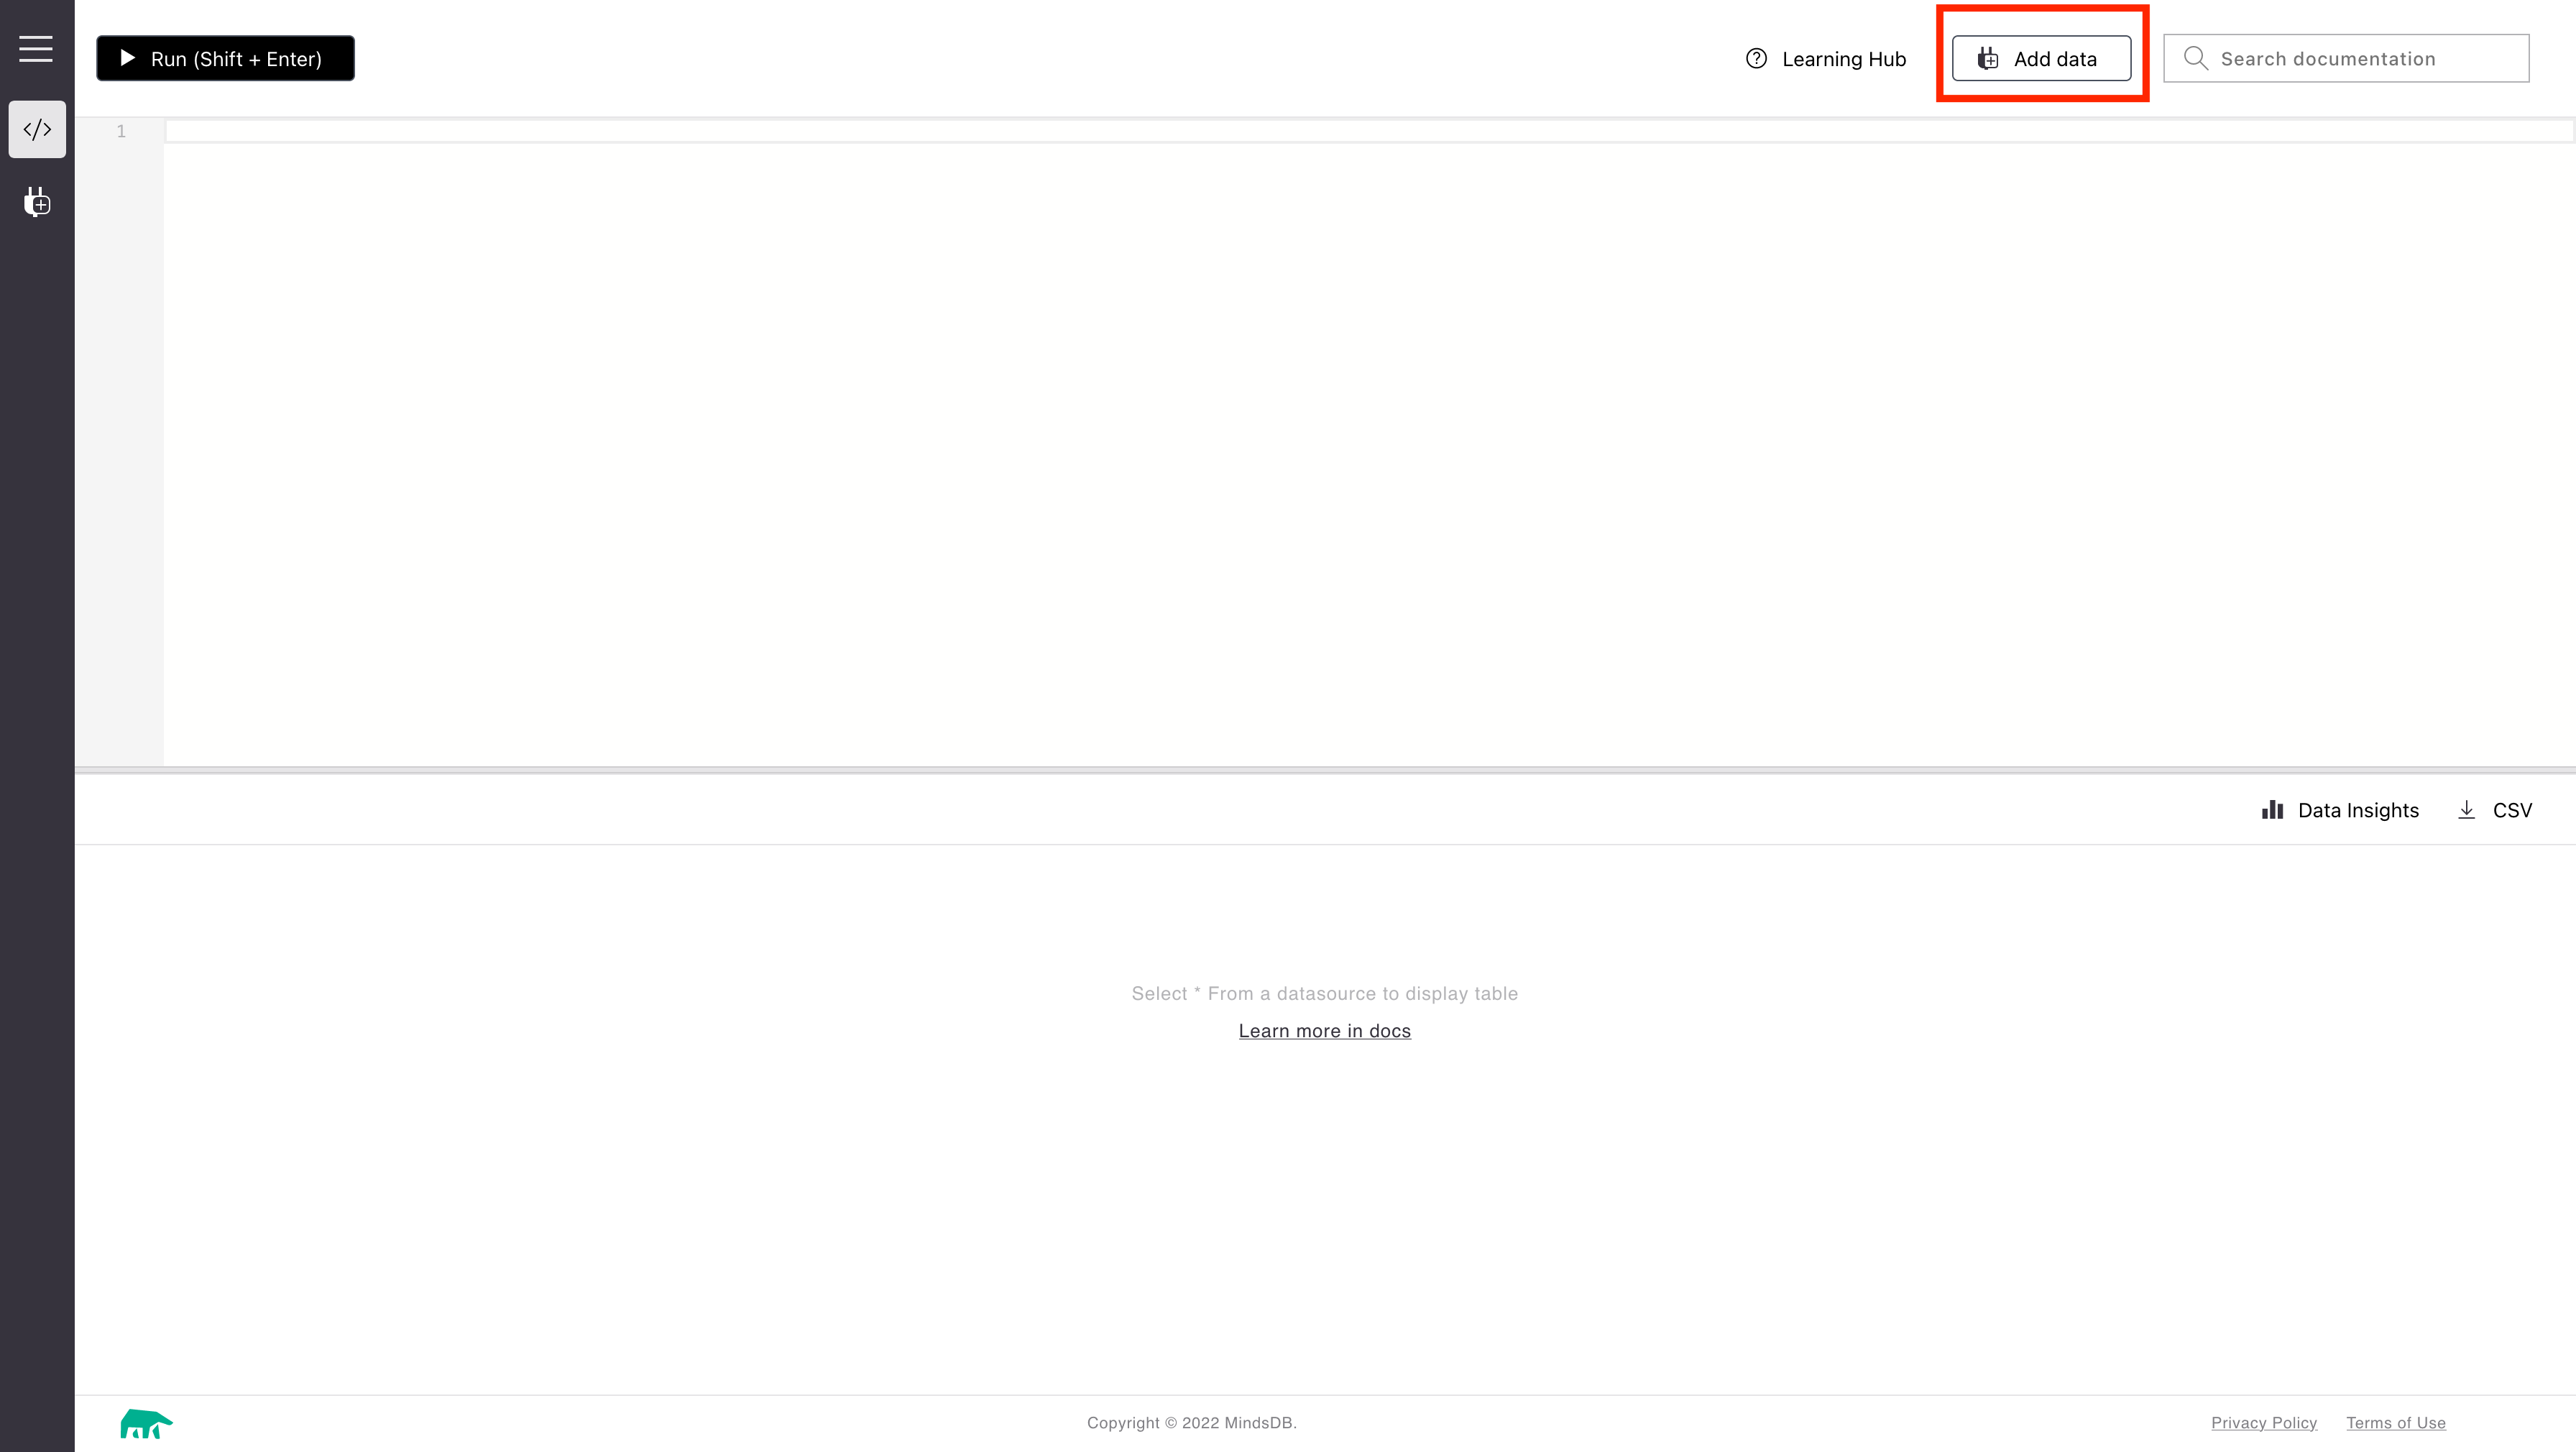
You can run the following command to look at the available data sources. show databases
Importing Dataset
Let's start by importing the manufacturing dataset from Kaggle. Once the CSV is downloaded into our local machine, click on Add Data as highlighted in the previous section screenshot. This opens a page showing all possible data import mechanisms using connectors which are illustrated below.
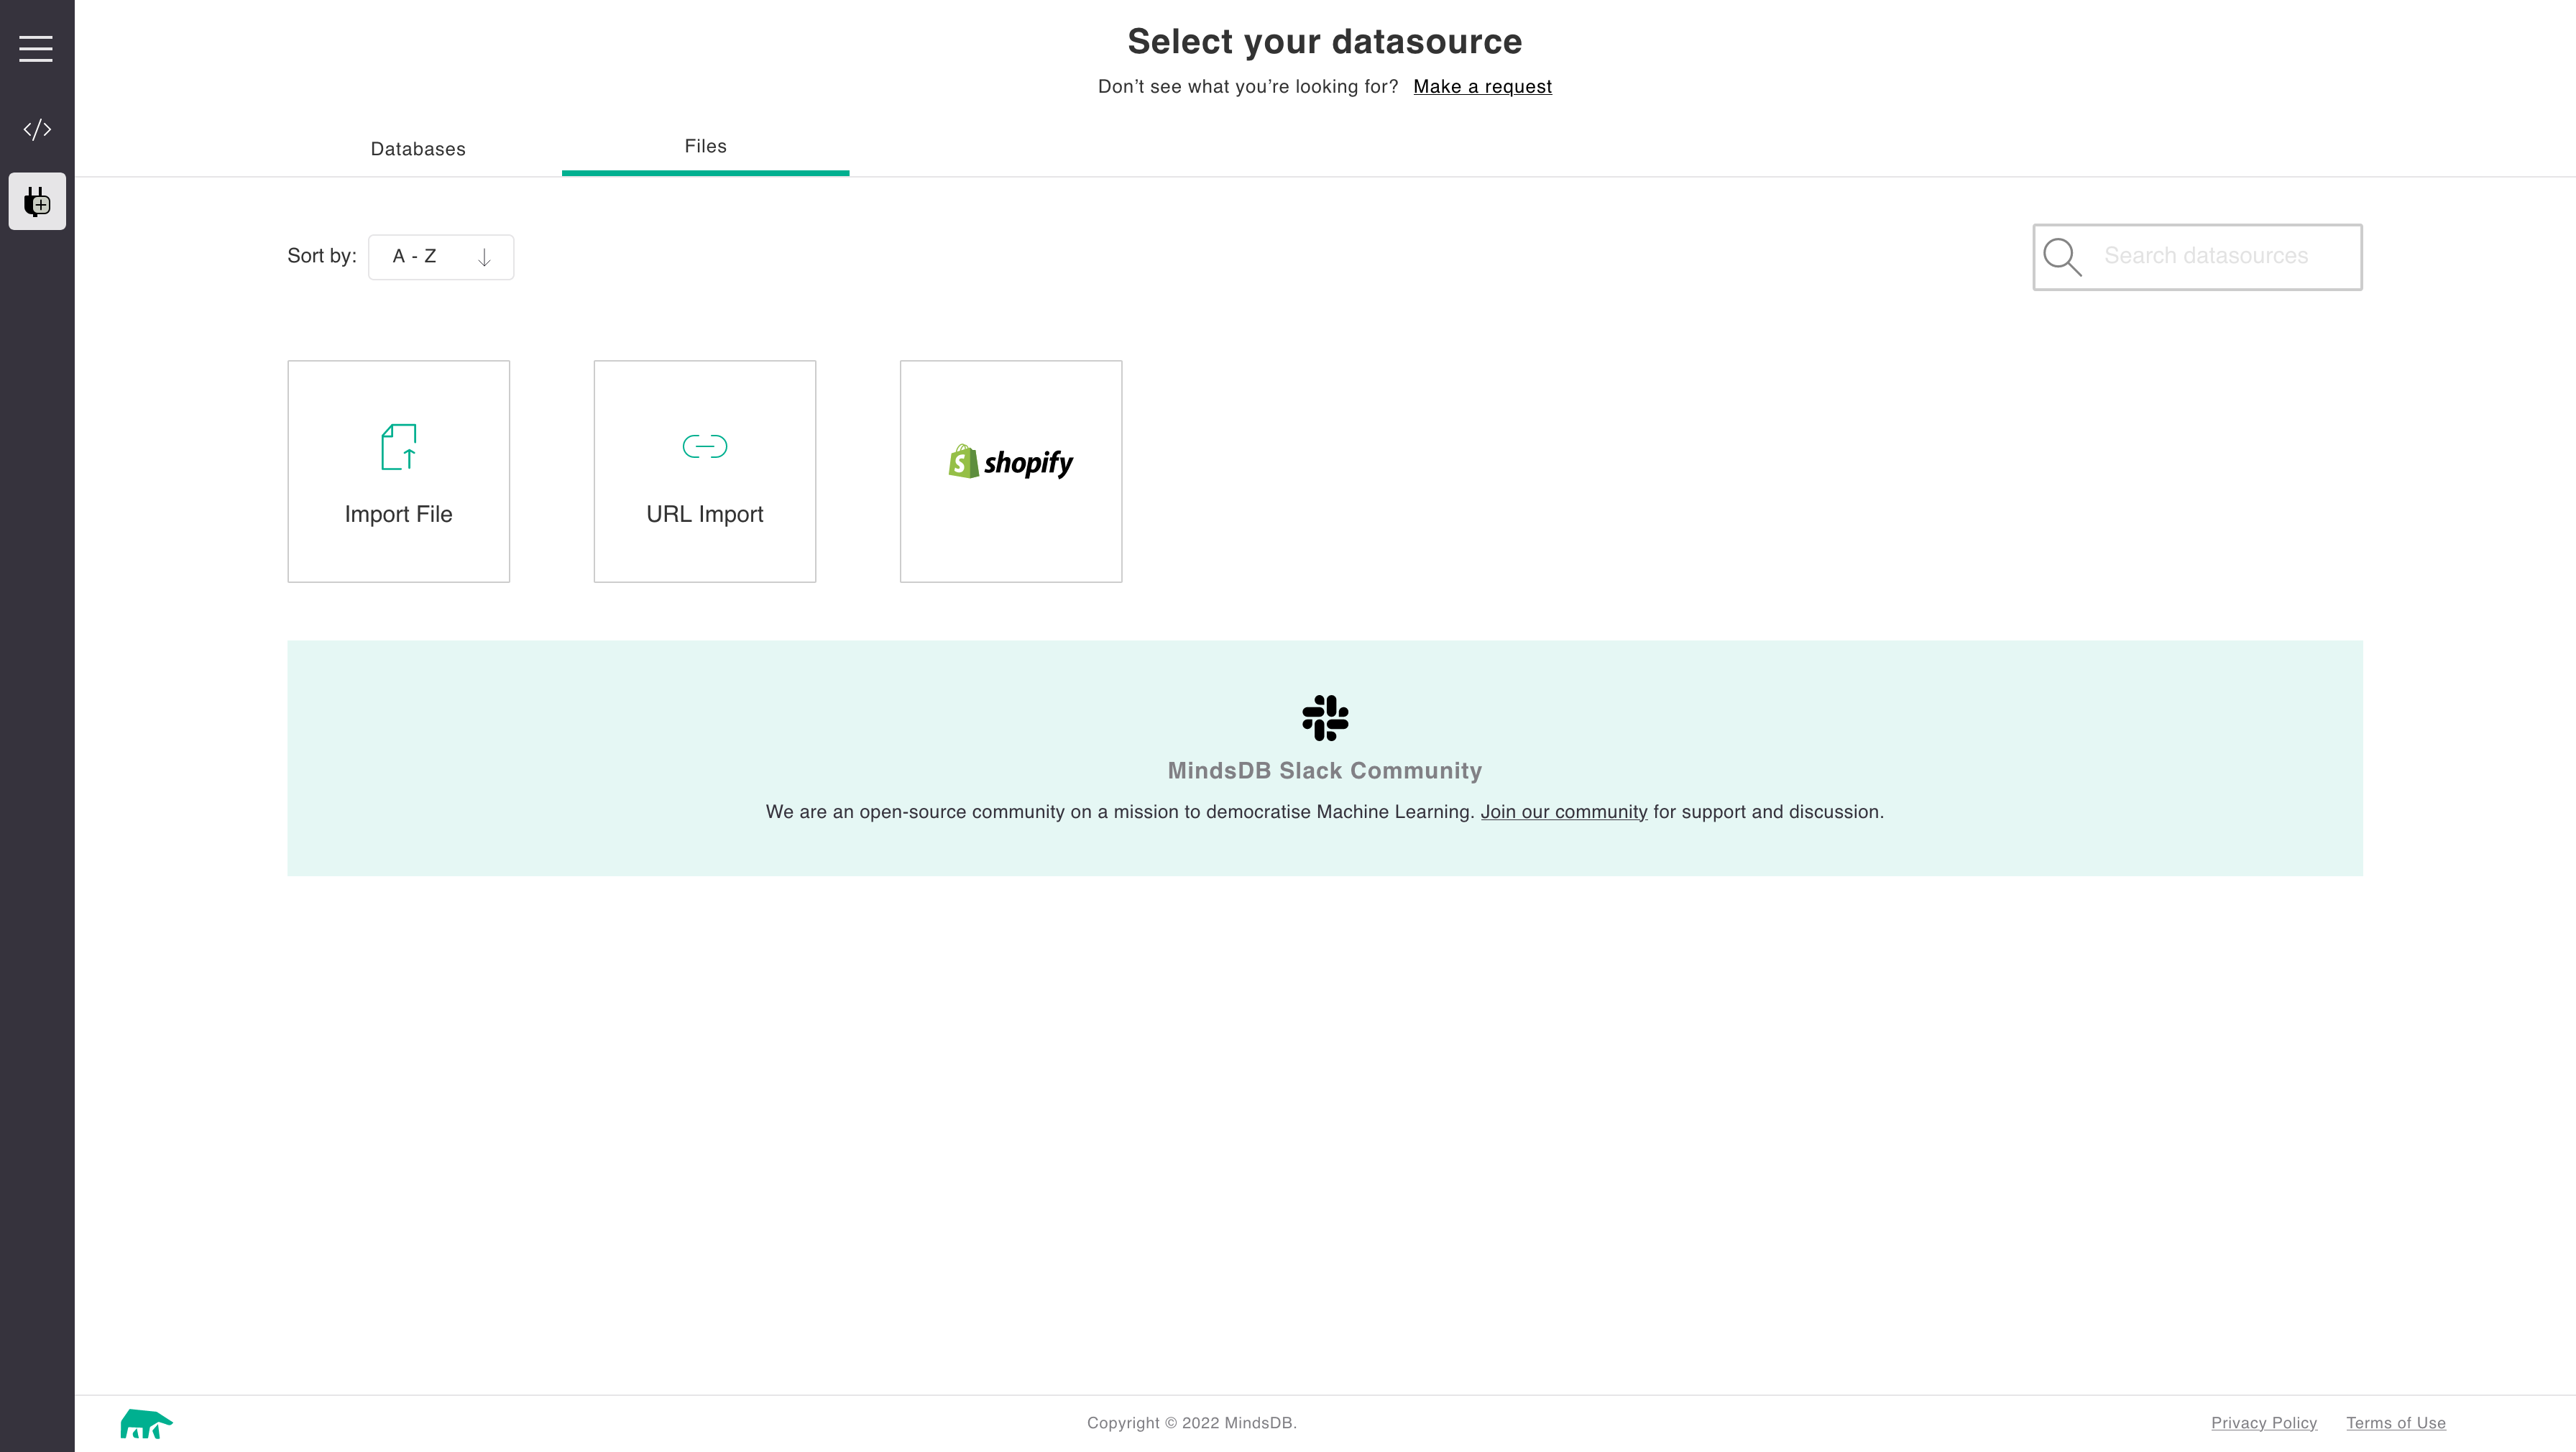
We will use file import and select the appropriate file from your downloaded folder. We should also provide a suitable name for the imported data so we can access the CSV dataset for further processing. Your screen should look like this during the import
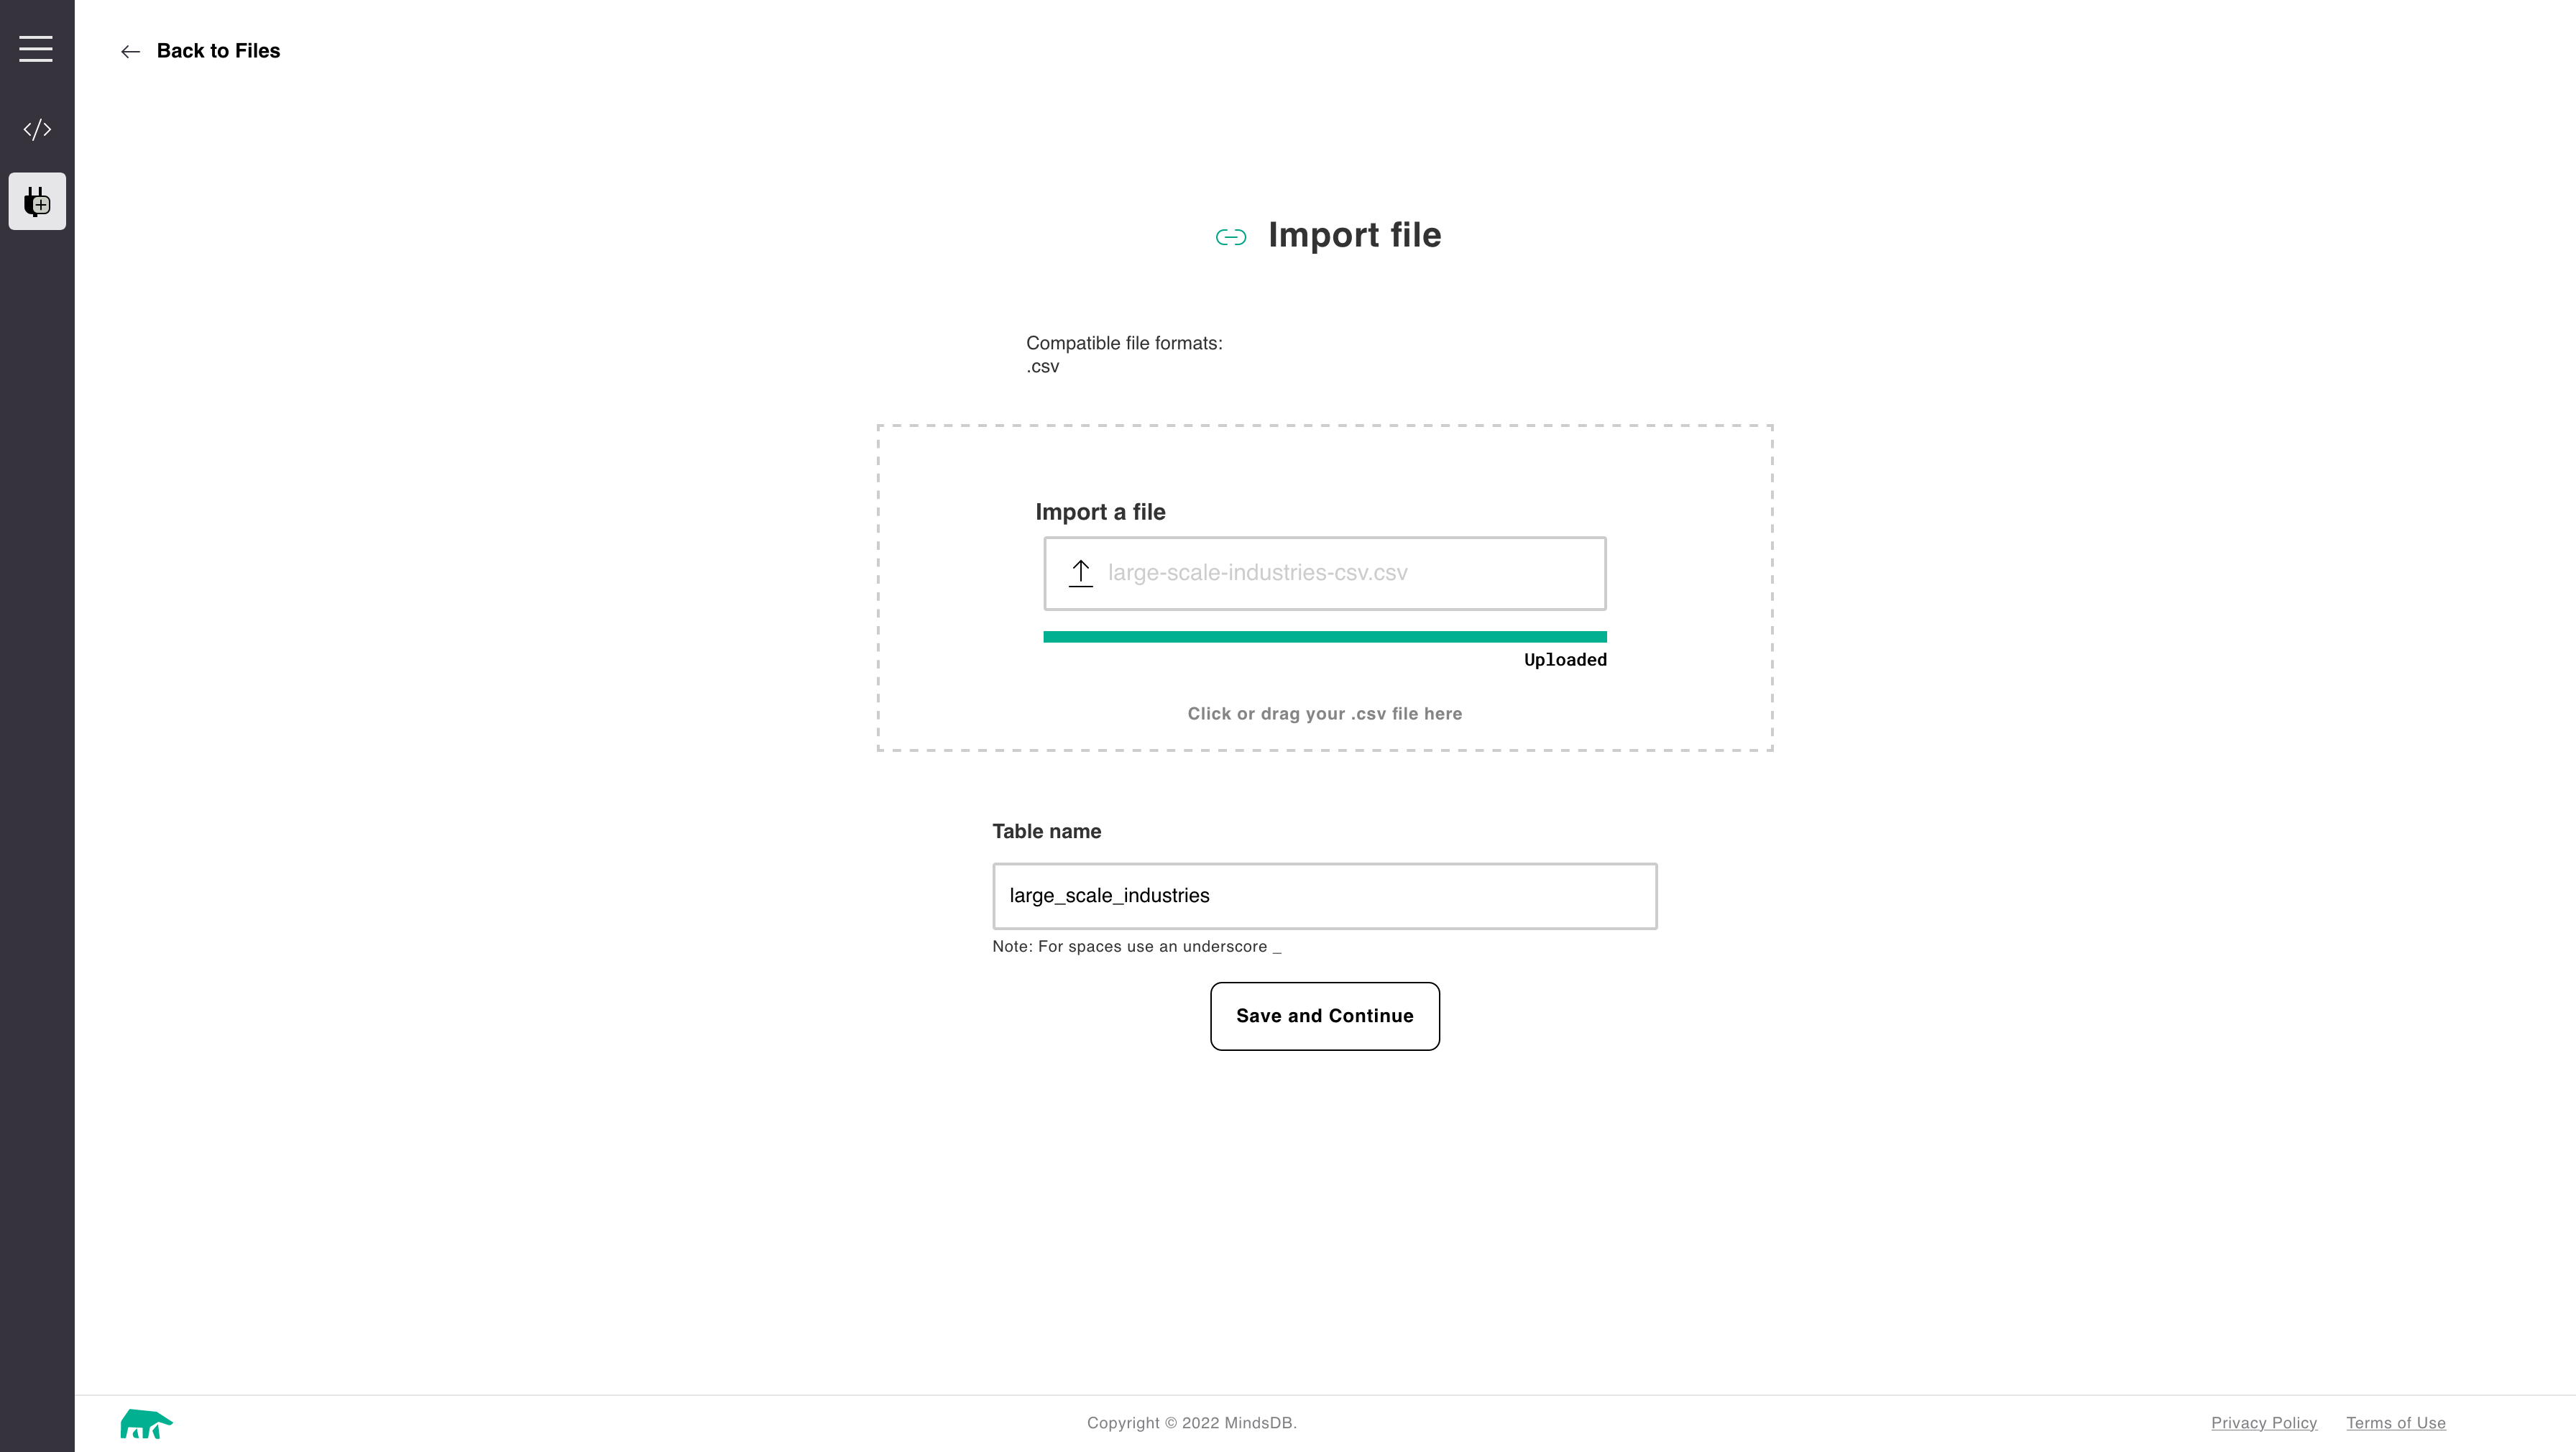
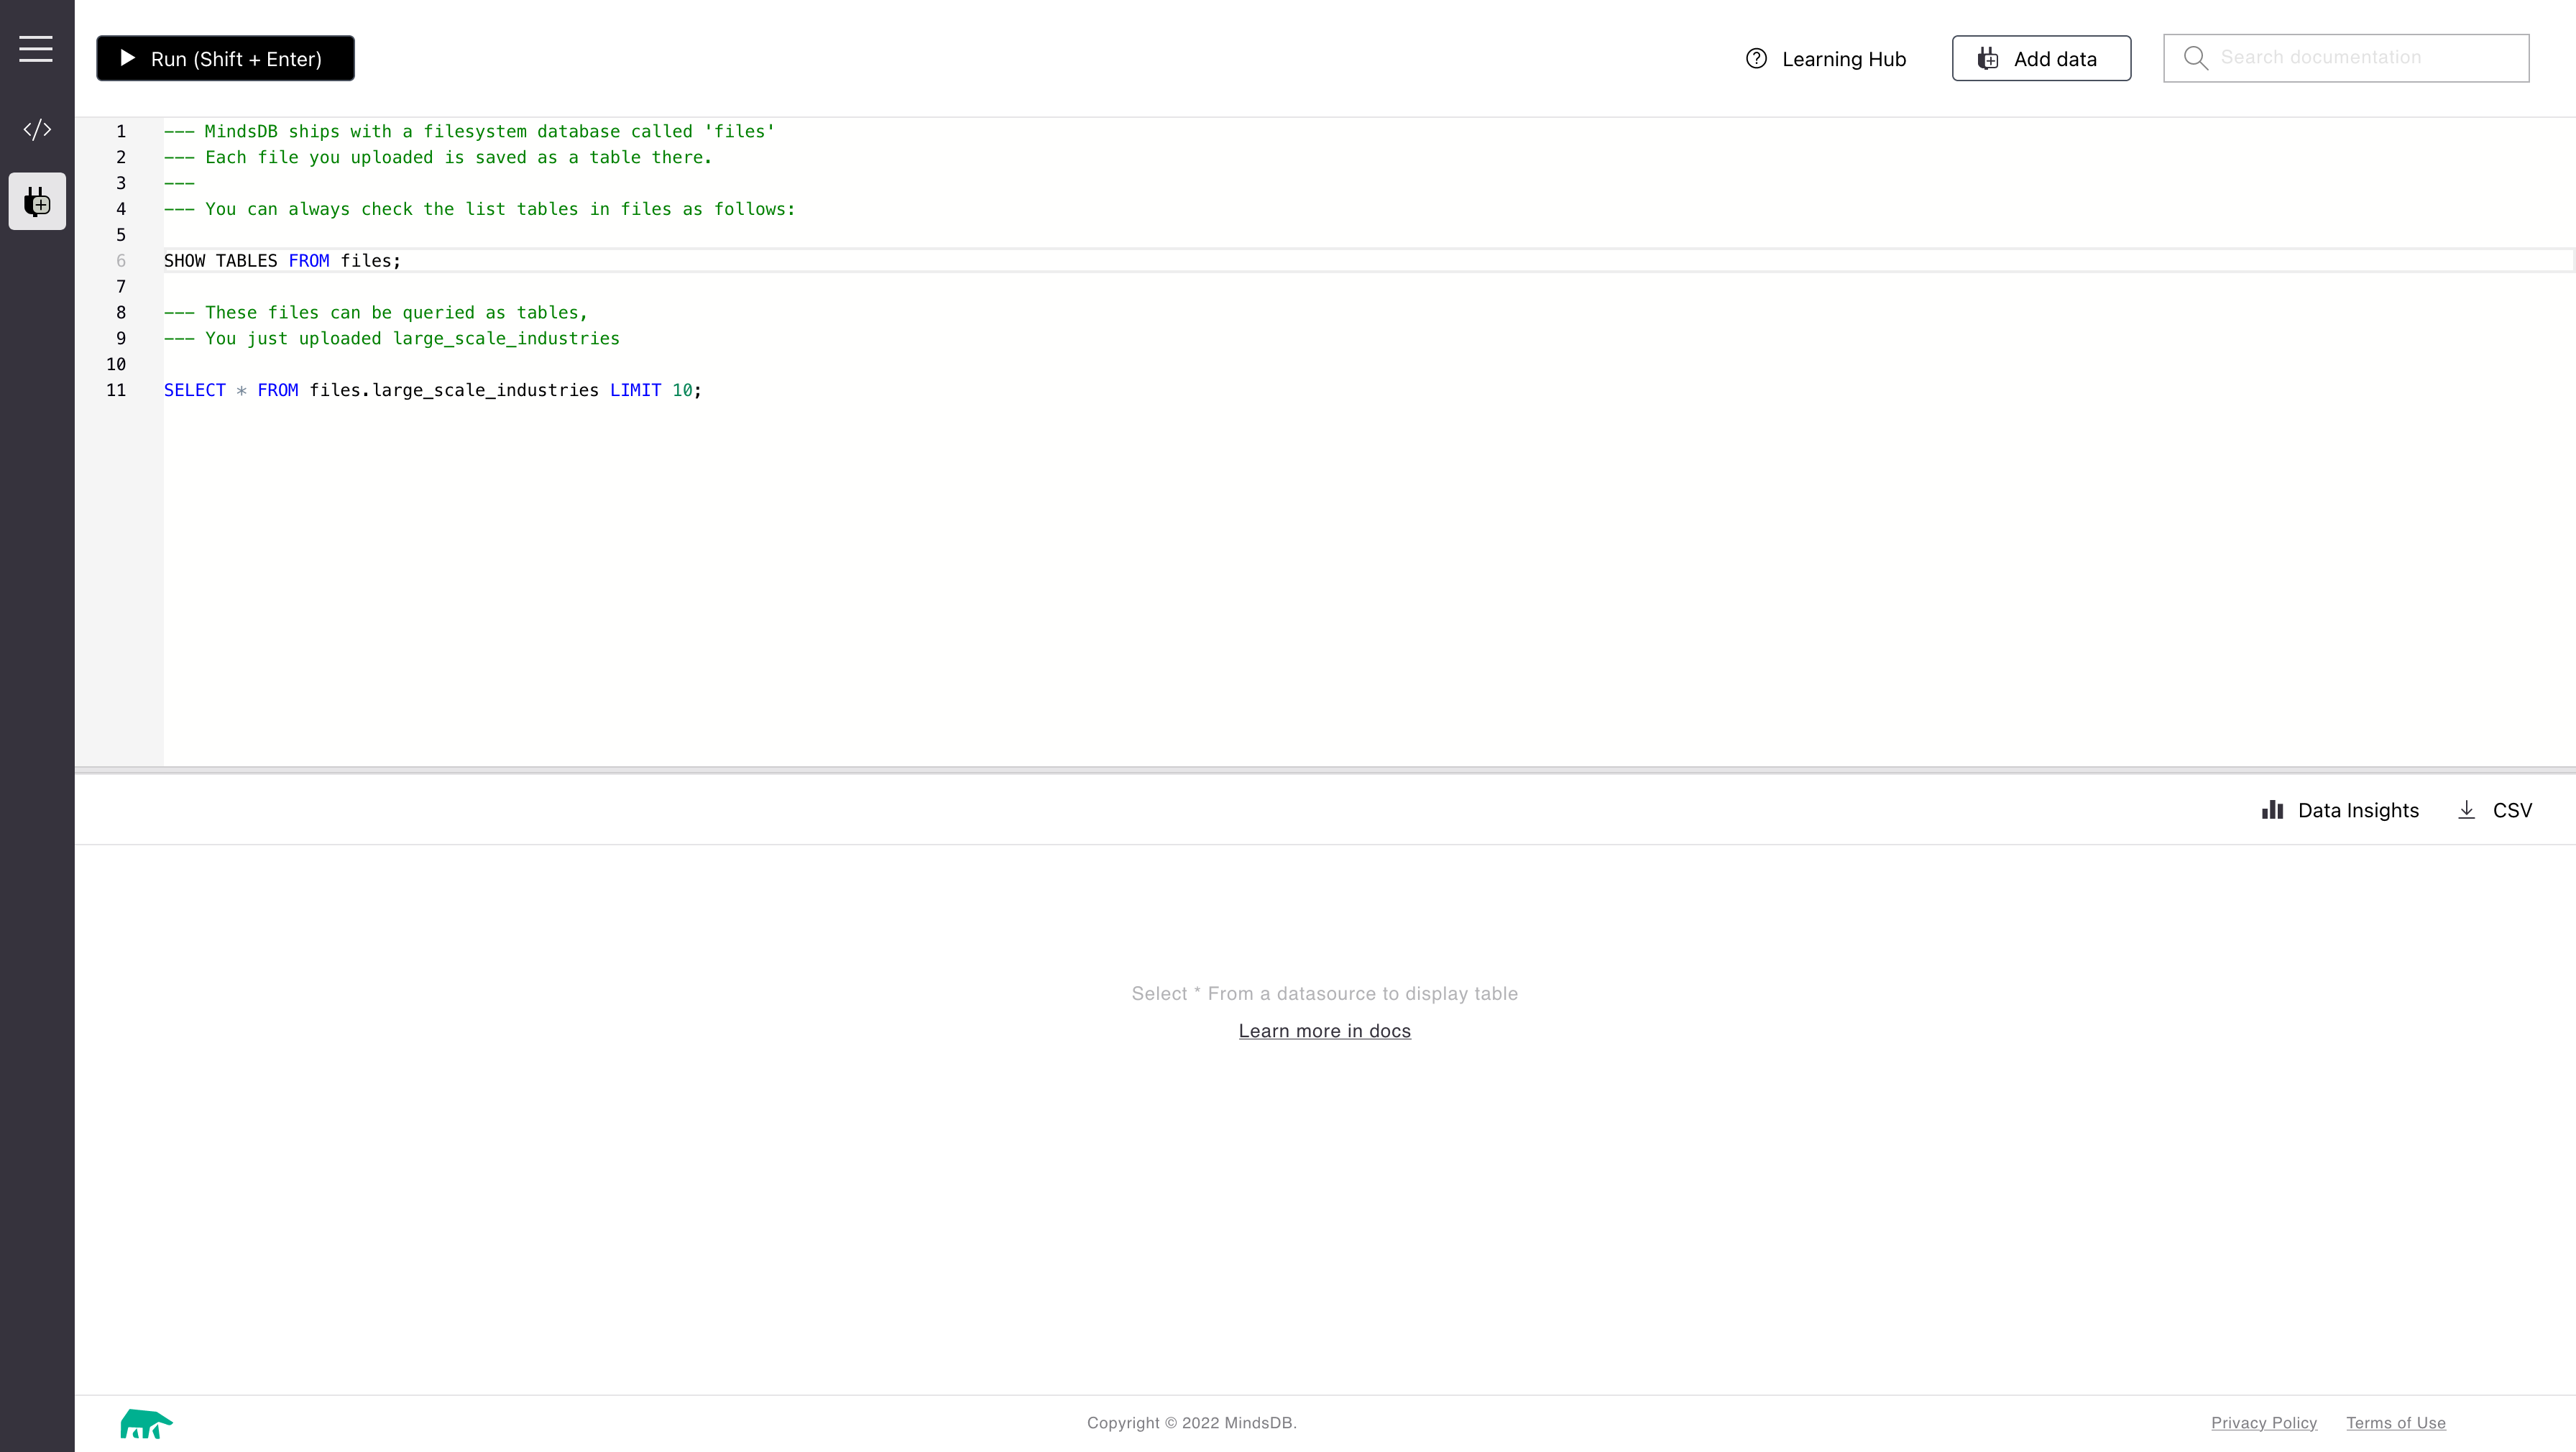
Click on save and continue. We are taken back to the console with convenient SQL commands showing how to access the data source.
Exploring Data
In this section, we will understand what the data is all about. We will look at a sample of the data by running the command SELECT * FROM files.large_scale_industries LIMIT 10;
This will show us 10 rows from the dataset.
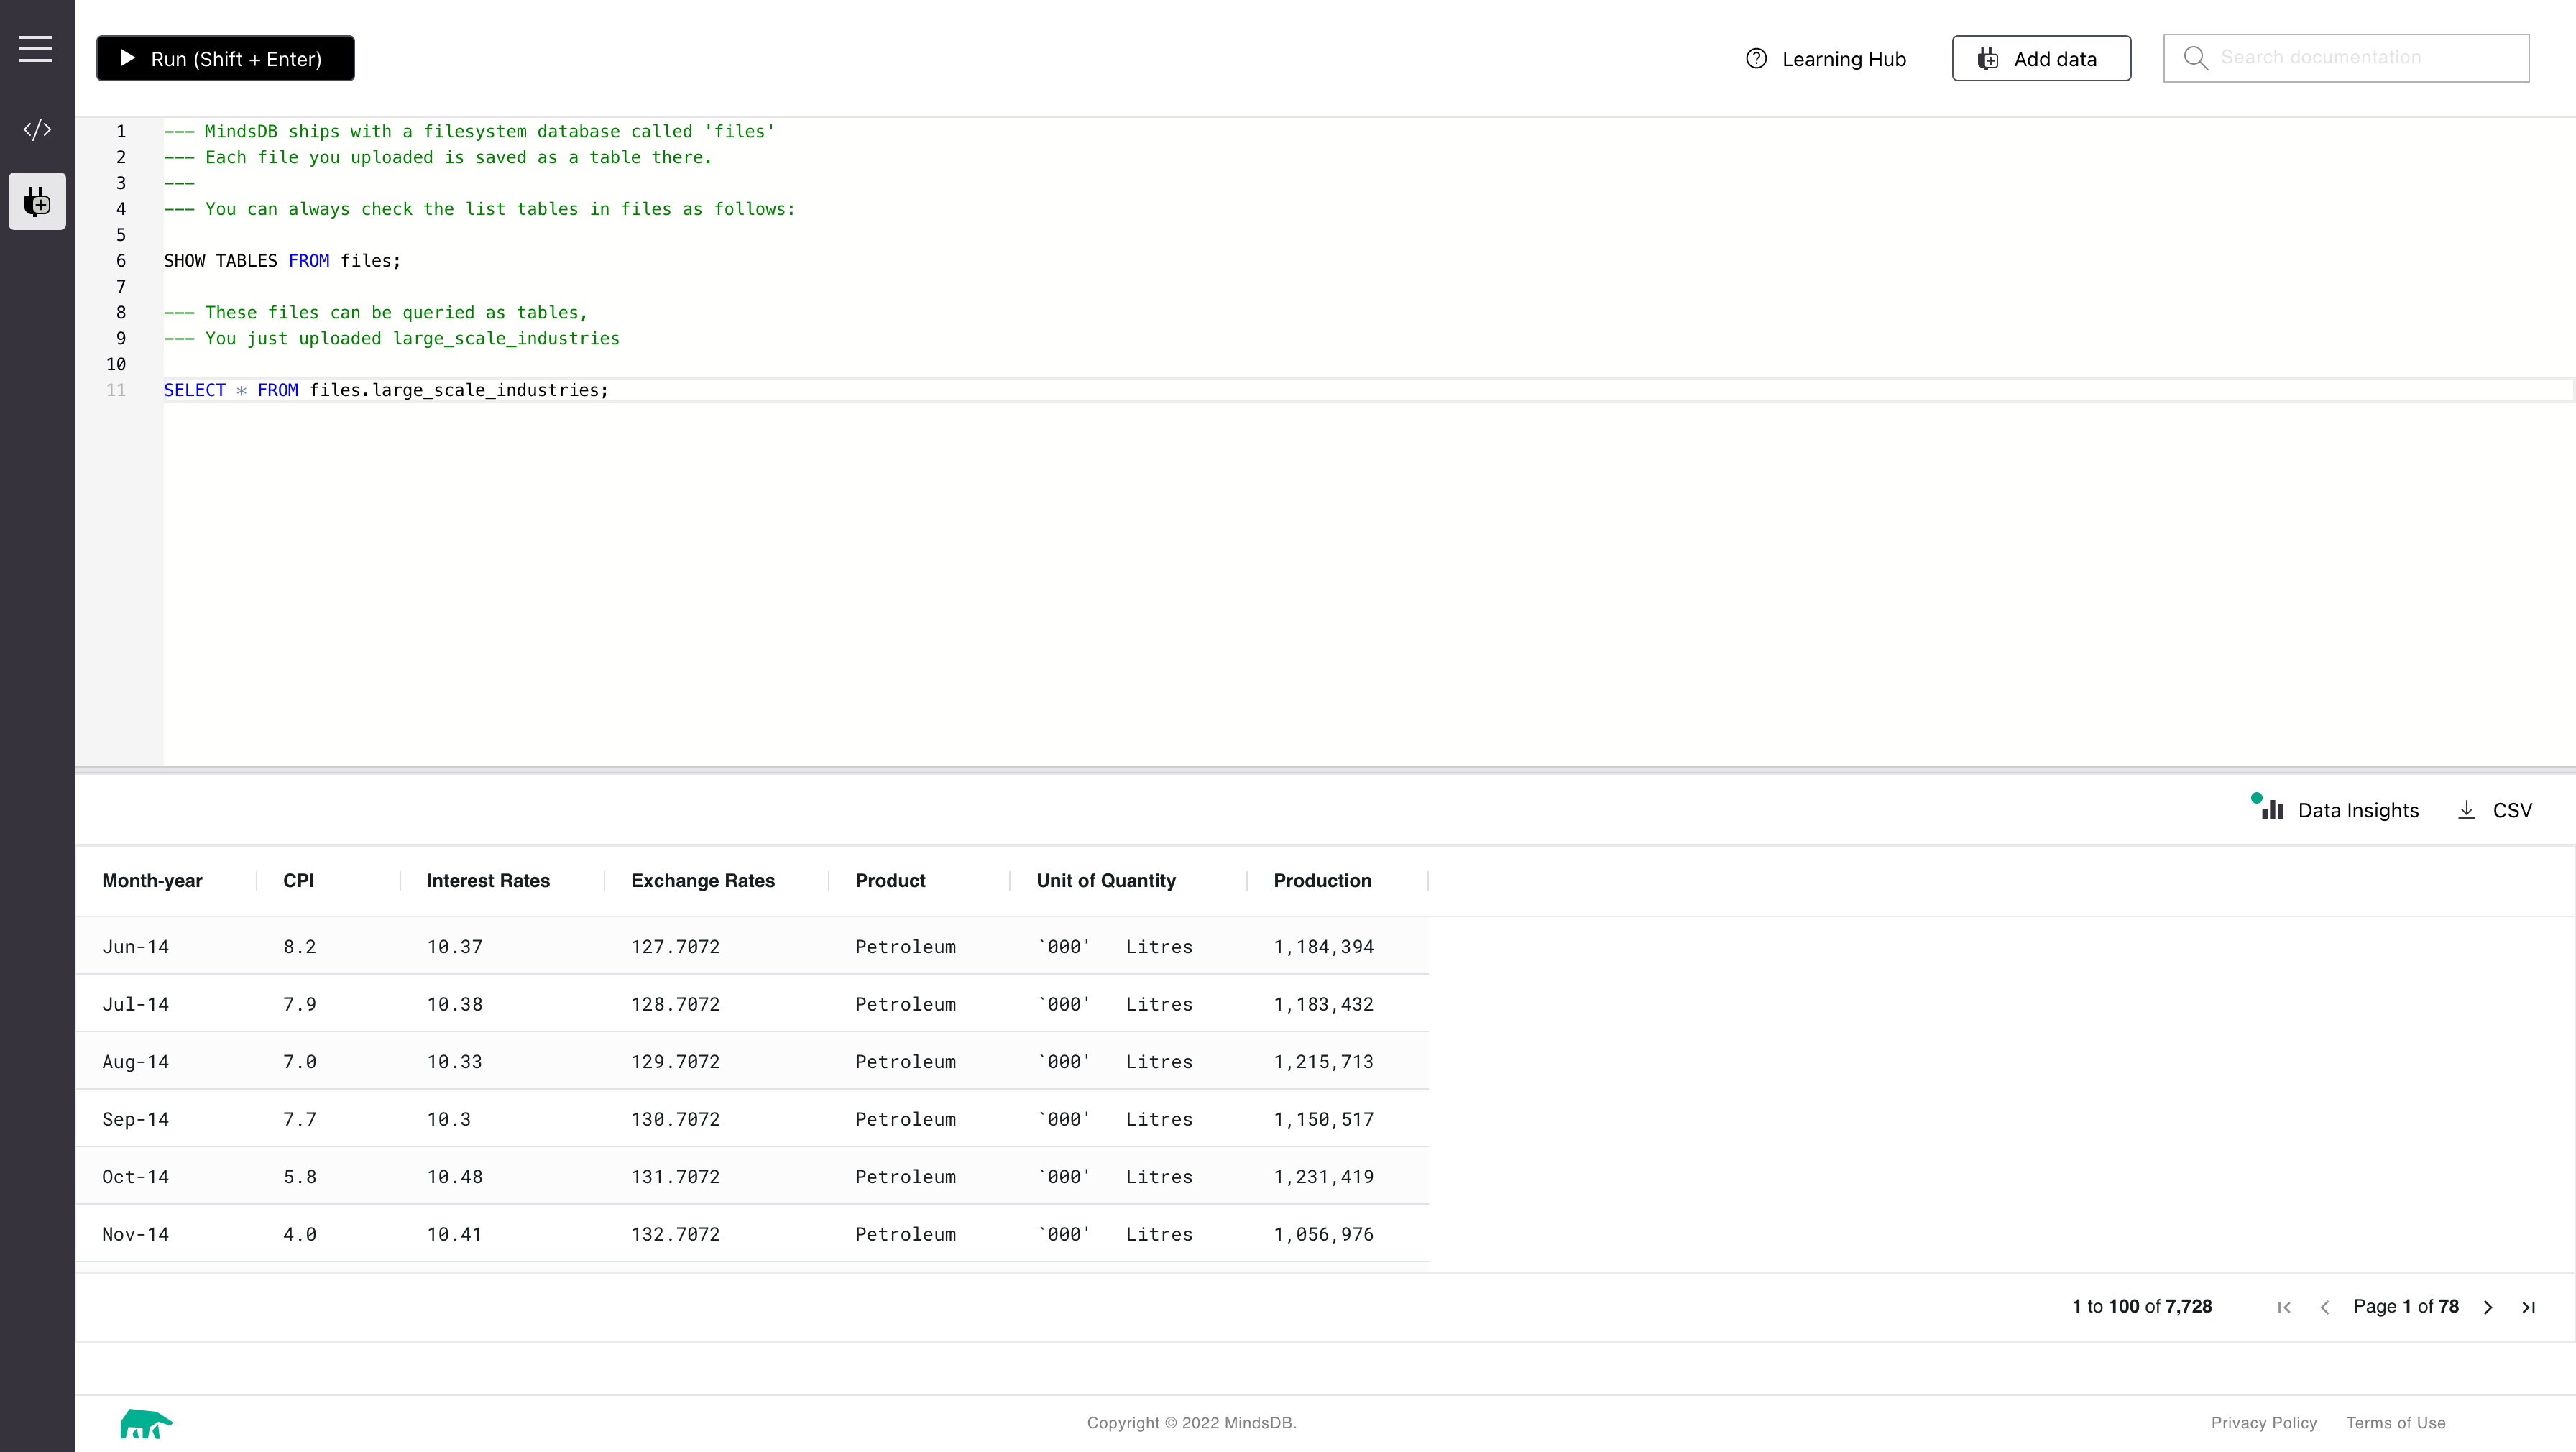
From the screenshot, we can see the following columns are present in the dataset
Month-year
CPI
Interest Rates
Exchange Rates
Product
Unit of Quantity
Production
Now if we run the query without the LIMIT, it will bring us the entire dataset
Data Insights
In the bottom part of the console(results pane), you will see the Data Insights label. Once a white dot appears on the green label, click on it to view the data analysis results.

To perform a complete analysis of your data, you can either go to a full-screen mode or stay in a pane mode and click on the Full Data Analysis button.
Once the analysis is complete, you can see the distribution of the various columns. I have provided below output for two columns
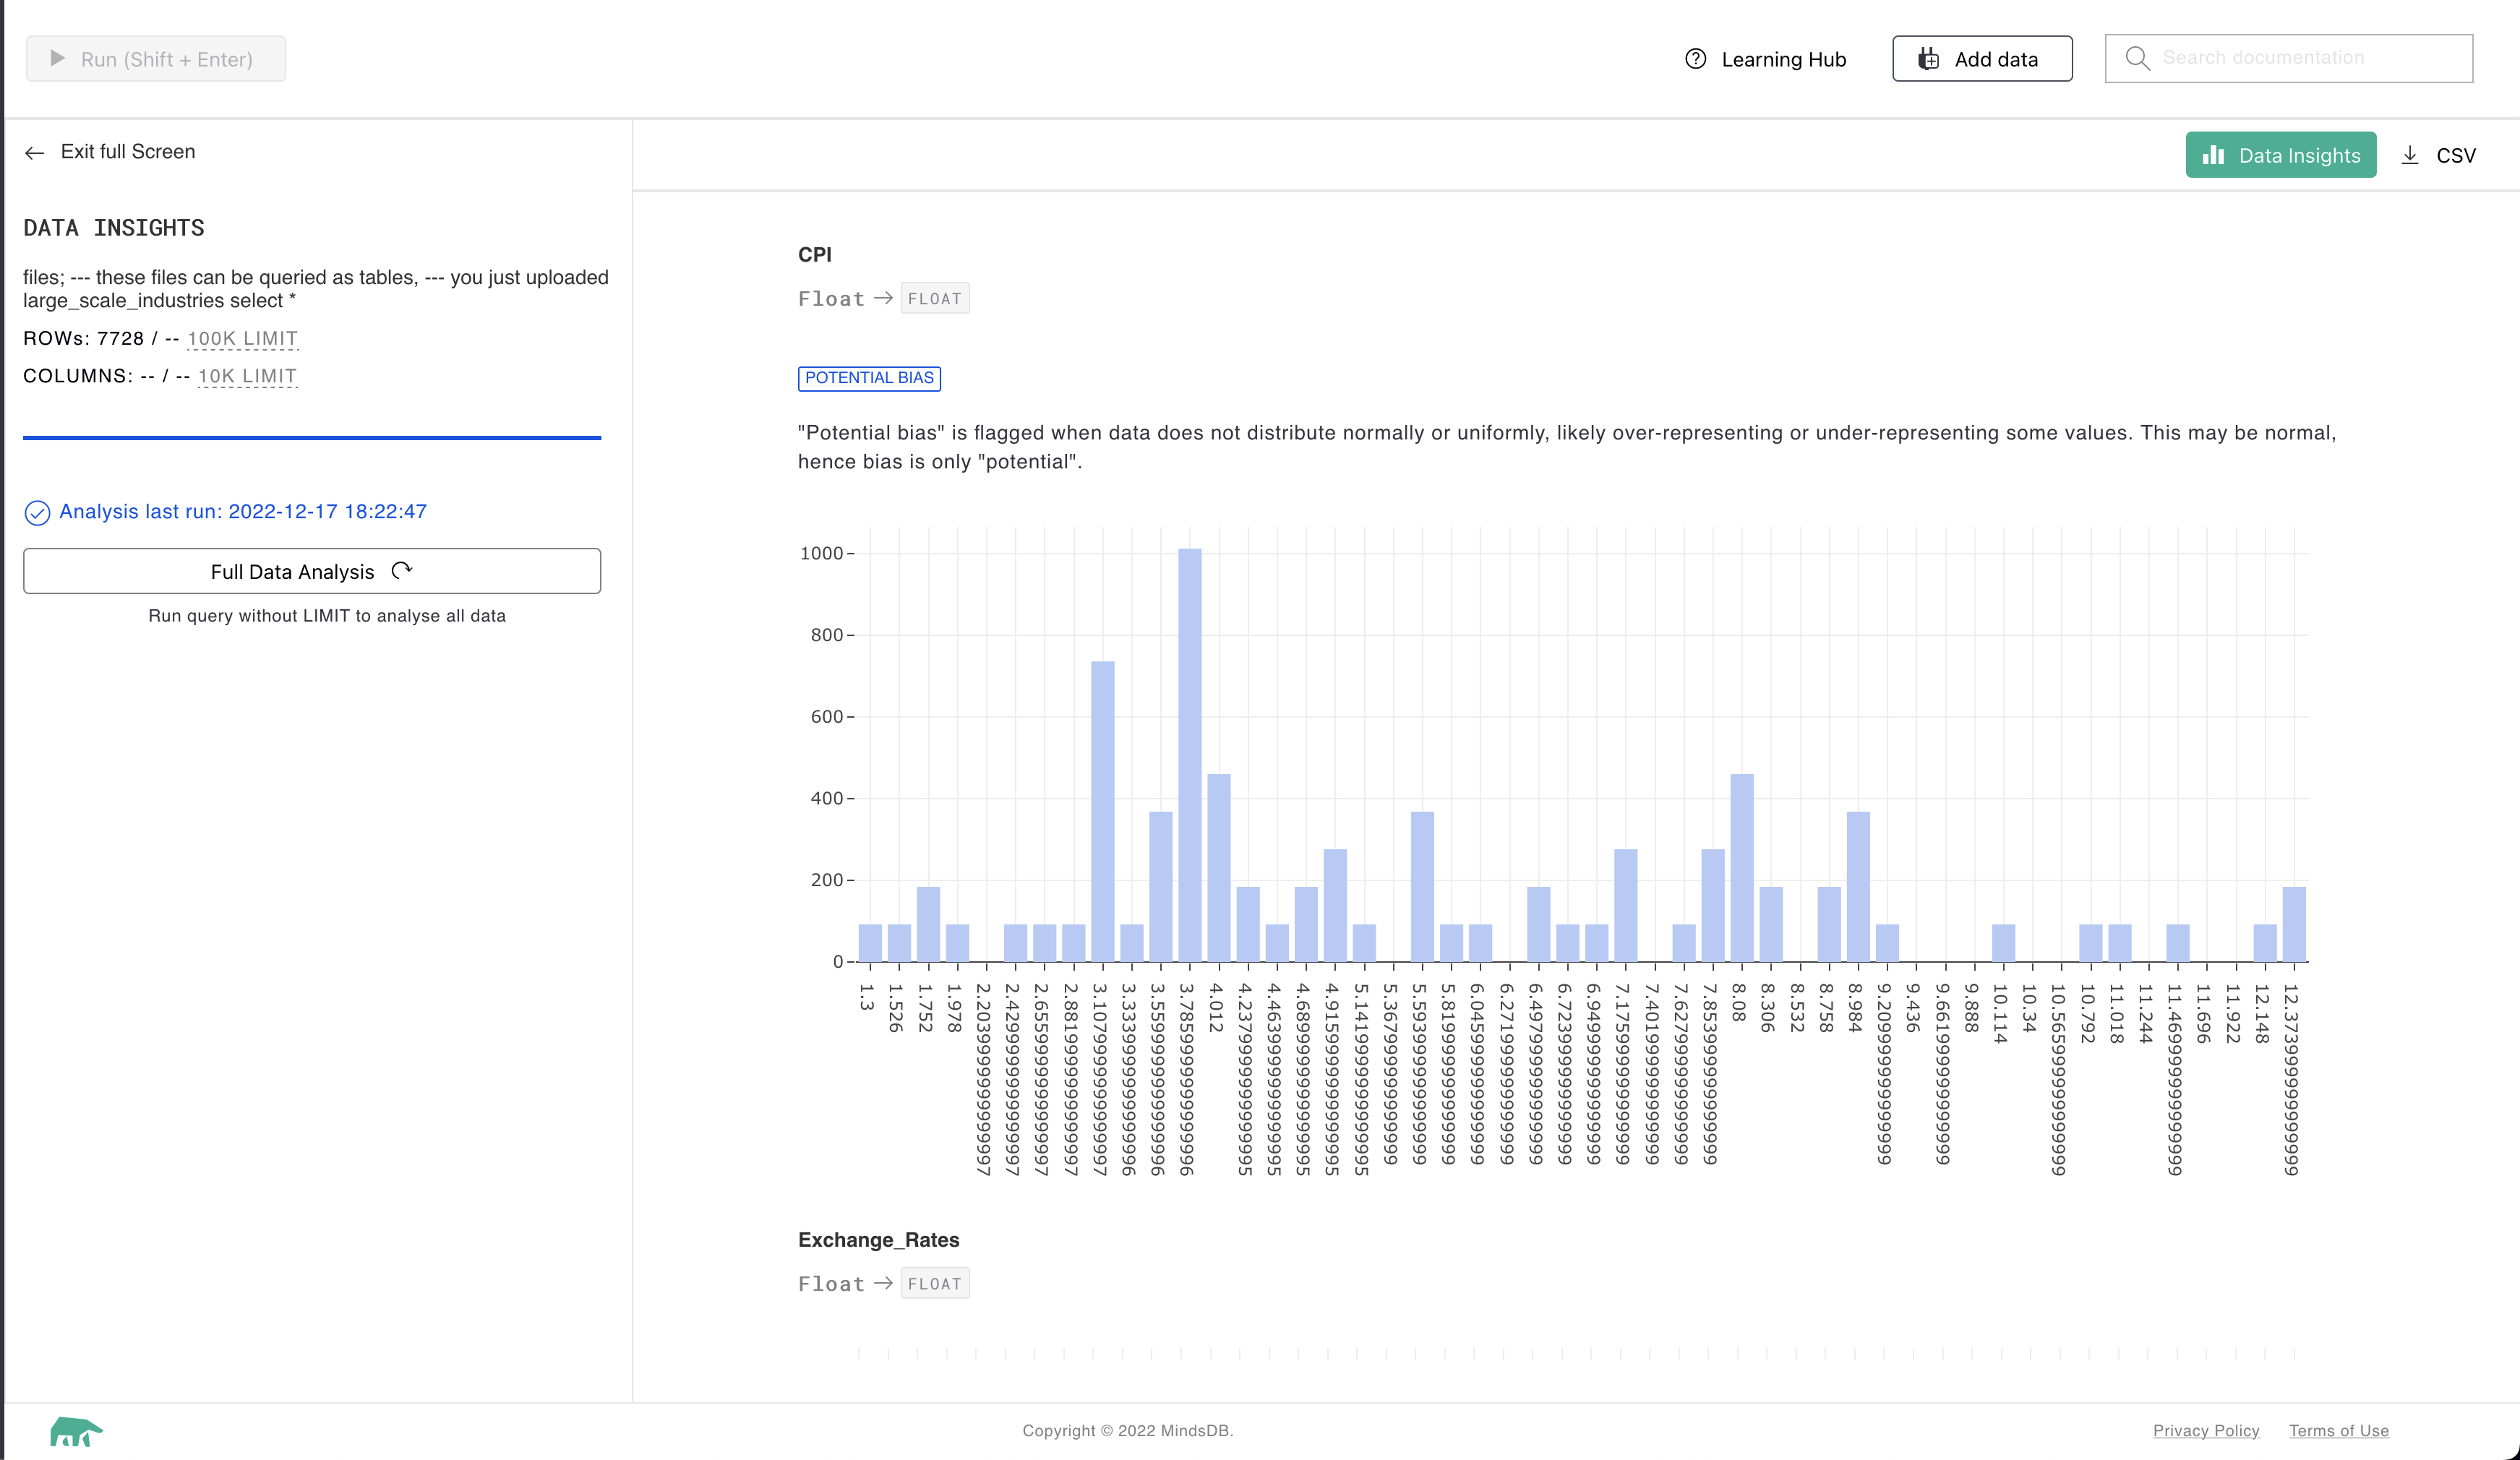
This is for the column CPI. The X-axis represents the actual value while Y-axis represents the count of the particular data point. The column is also flagged as Potential Bias which indicates that the dataset is not spread evenly.
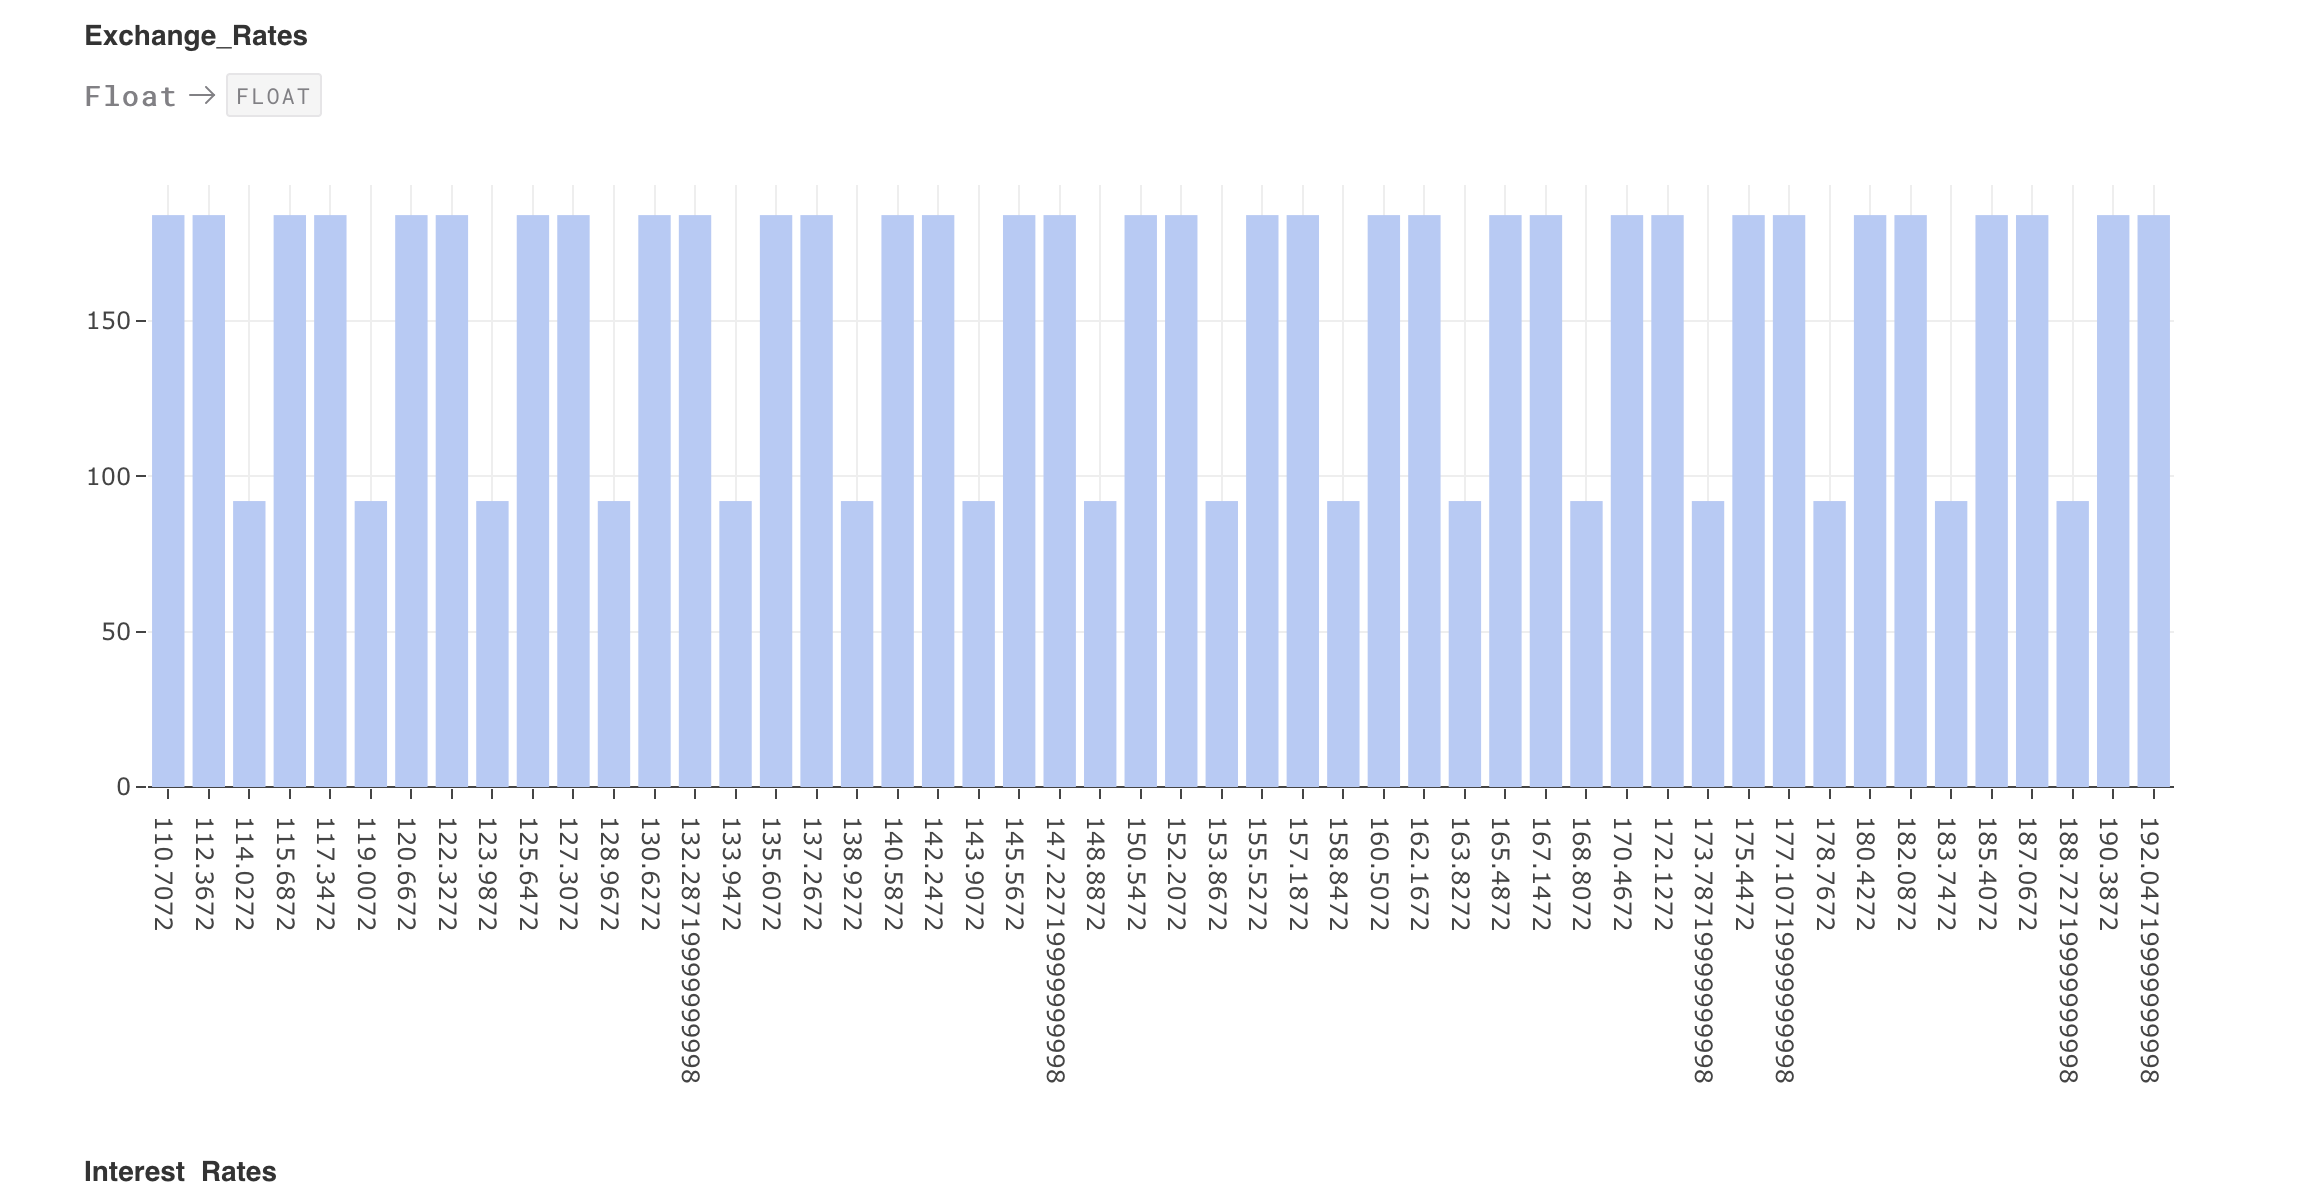
This represents another column Exchange Rates. The column data type is indicated at the top as Float and this shows a spread similar to the other column. Hovering over the bar shows the count of values.
This helps analysts and scientists understand the data before proceeding with further tasks of prediction and classification.
MindsDB has potential. I would encourage fellow practitioners to give a spin. The community is also active and is responding to GitHub issues.
Subscribe to my newsletter
Read articles from Rajagopal ParthaSarathi directly inside your inbox. Subscribe to the newsletter, and don't miss out.
Written by