Vector attribute manipulation of sf data
 joshua osoro
Table of contents
library(sf)
library(rKenyaCensus)
library(dplyr)
Vector attribute data is non-spatial data associated with geographic data. We shall play with geographic data courtesy of rKenyaCensus library that represents census data of 2010.
kenya_sf <- rKenyaCensus::KenyaCounties_SHP %>% st_as_sf()
kenya_sf %>% class()
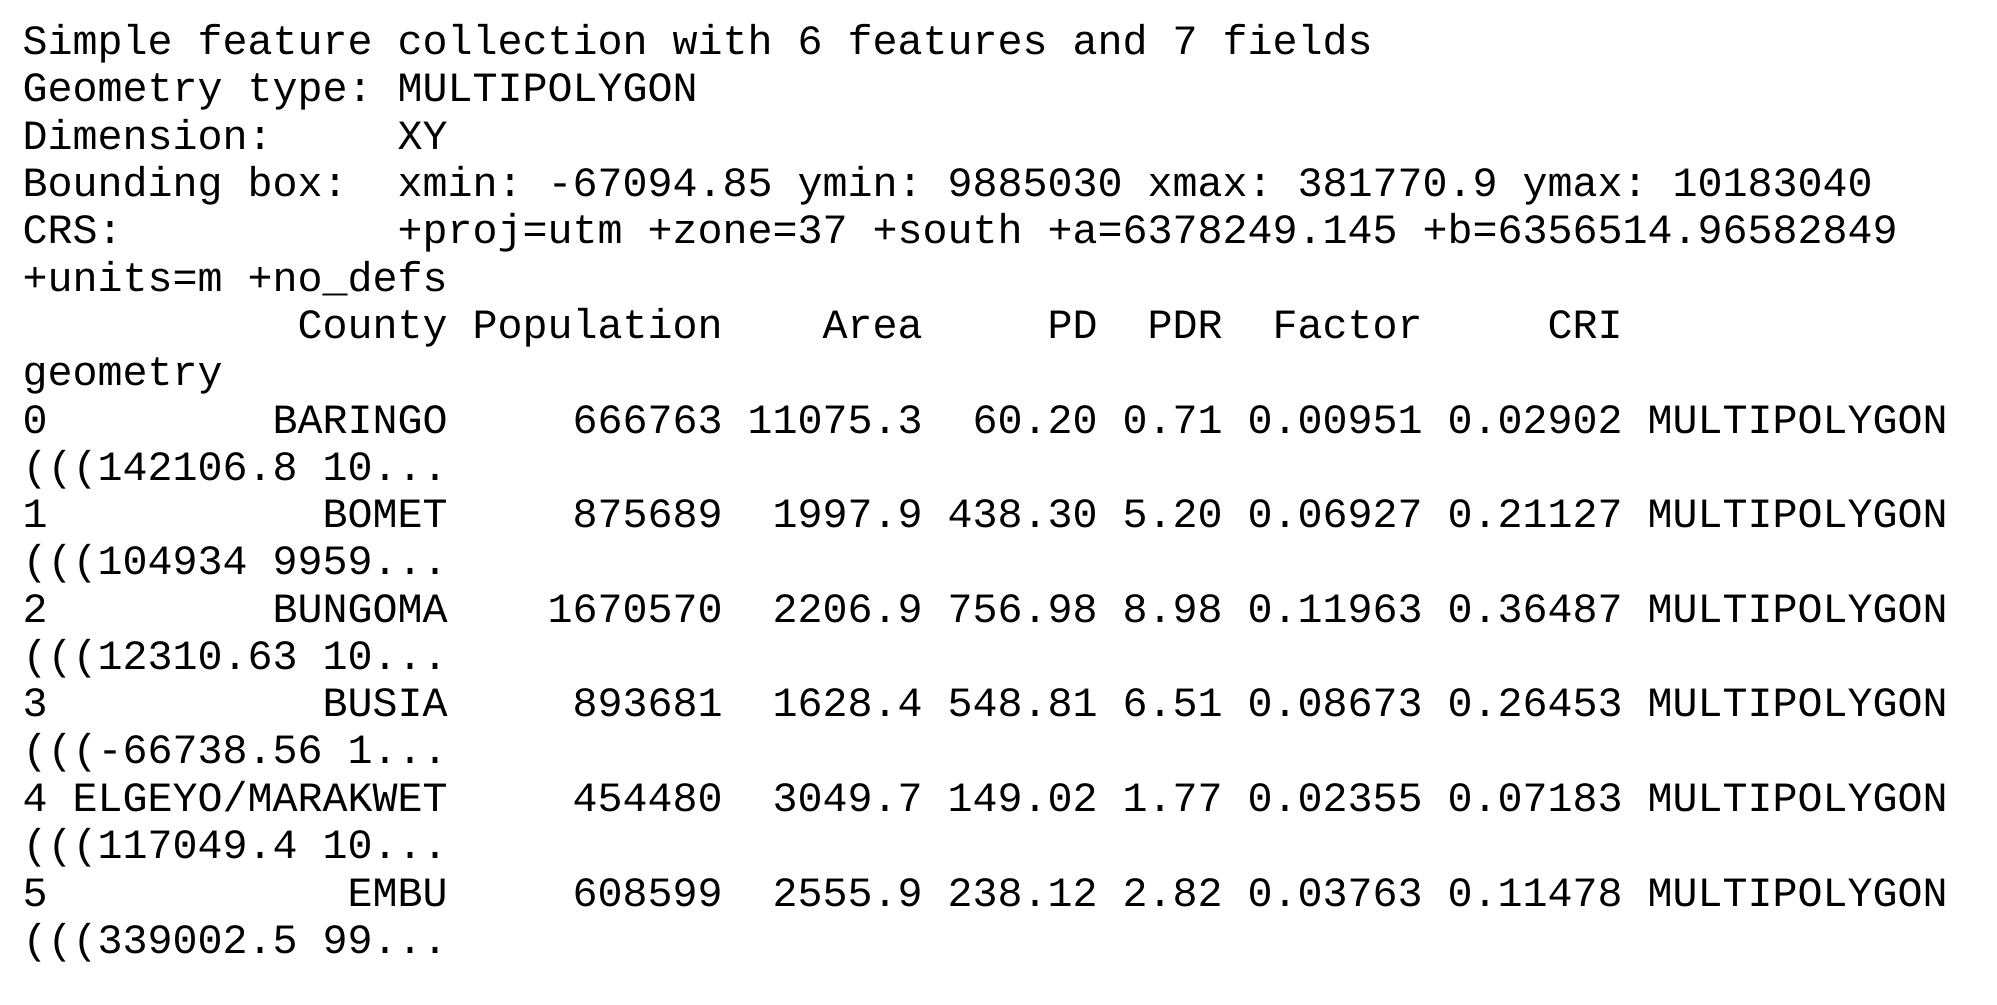
Take a peek into kenya_sf data
head(kenya_sf)
Filtering the sf dataset and plotting
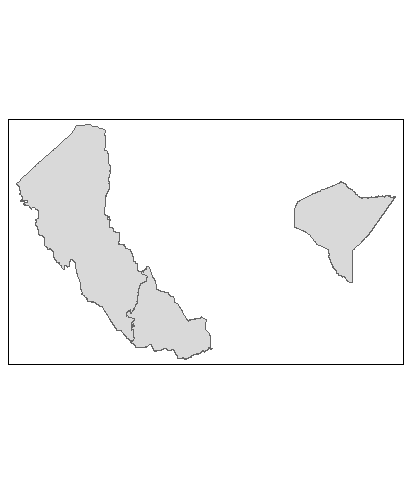
ke_subset_sf <-
  kenya_sf %>%
  filter(County %in% c("TURKANA", "SAMBURU", "MANDERA")) # dplyr filter func

ke_subset_sf %>% qtm()
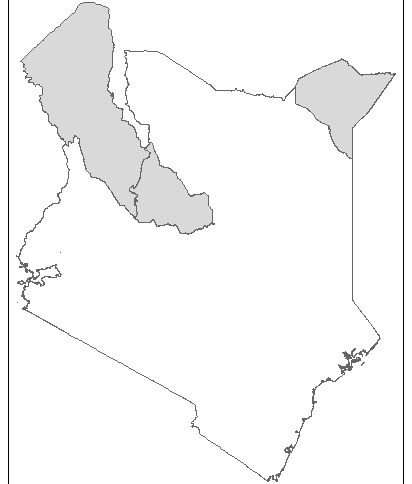
What is we want to get a geographical context in terms of the position of these counties relative to each other in Kenya? We simply add another layer that will represent Kenya.
tm_shape(st_union(kenya_sf)) +
    tm_fill("white") +
    tm_borders() +
    tm_shape(ke_subset_sf) +
    tm_fill() +
    tm_borders()
Vector attribute joining
Assuming we had collected some data on gender in these three counties and we need to merge it into the sf dataset…
gender_kenya <-
  rKenyaCensus::V1_T2.2 %>%  # distribution of population by sex in the counties
  filter(County %in% c("Samburu", "Mandera", "Turkana")) %>%
  select(1:3) # select the first three columns

gender_kenya %>% head()
We shall filter the data to get back the data for the counties of interest.
ke_subset_df <-
  gender_kenya %>%
  filter(County %in% c("Samburu", "Mandera", "Turkana")) %>%
  select(1:3) # select the first three columns

ke_subset_df
Realize that both datasets to be joined have a "County" column in common and therefore we shall join the datasets by that column.
ke_subset_df[, 1] <-
  stringr::str_to_upper(ke_subset_df$County)

ke_subset_df
We shall then use dplyr's left_join to join the two datasets by the County column. This operation successfully merges the two dataframe to give us an sf dataset with new attributes.
new_sf <- left_join(ke_subset_sf, ke_subset_df)
new_sf
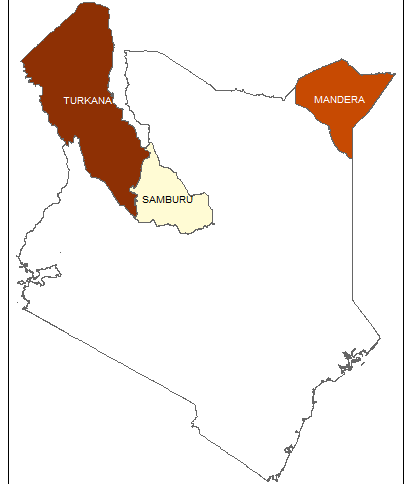
Consequently, we can now use the new attributes in our plotting. Though the example below is a little contrived, you can go ahead and use the new attributes.
tm_shape(st_union(kenya_sf)) +
    tm_fill("white") +
    tm_borders() +
    tm_shape(new_sf) +
    tm_fill("Male", legend.show = FALSE) +
    tm_borders() +
    tm_text("County", size = .6)
Thanks for reading.
Subscribe to my newsletter
Read articles from joshua osoro directly inside your inbox. Subscribe to the newsletter, and don't miss out.
Written by

joshua osoro
joshua osoro
Data Science enthusiast