Getting Started with Wolfram Mathematica
 Favour Olumese
Wolfram Mathematica is a software used for technical computing which includes, "neural networks, machine learning, image processing, geometry, data science, visualizations," etc, and it has "over 6,000 built-in functions."
It uses the Wolfram notebook interface which provides a rich format consisting of codes, texts, comments, diagrams (2D, 3D diagrams, etc.), etc. It also has a well-structured documentation with lots of examples to get a beginner started. It allows interfacing with other languages such as Visual Basic, Python, Haskell, Java, etc.
In this article, we would be discussing basic maths functions and how to go about writing them in the Wolfram Mathematica Notebook.
You can create a free account on Wolfram Cloud to follow this tutorial. After signing in, click on New Notebook.

We would start with the simplest maths functions.
BODMAS
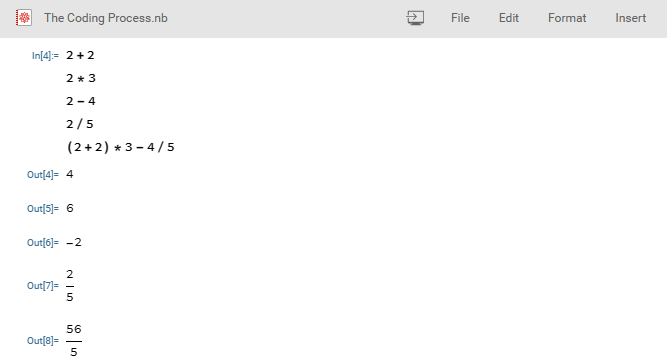
BODMAS is the acronym for Brackets, Orders, Divison, Multiplication, Addition, and Subtraction. It gives the order of precedence of the operators (from the left) in an arithmetic function.
Enter the operands with their operators (*, /, +, -) for the arithmetic operation you want to perform. To evaluate the operation, press Enter + Shift on your keyboard; if you are making use of the mobile application, click on the Wolfram symbol on the keyboard to evaluate the cell.
Formatting and Comments
To create a comment, we make use of the open and closing parentheses "()" and two asterisks "**".

To change the format, select;
Format >> Style Name >> Select the format you want
You can also use the following shortcuts;
| Shortcut Keys | Formats |
Alt + 1 | Title |
Alt + 4 | Section |
Alt + 5 | Subsection |
Alt + 6 | Subsubsection |
Alt + 7 | Text |
Alt + 8 | Code |
Alt + 9 | Input |
The input format is the Wolfram language input, while the code format is similar to the inline code format but in block form.
Special Symbols
To access the special symbols/characters in Mathematica, under the Insert tab, click on Special Characters.
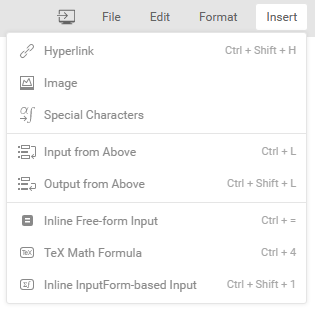
After clicking on it, you would see the special character at the side of your screen.
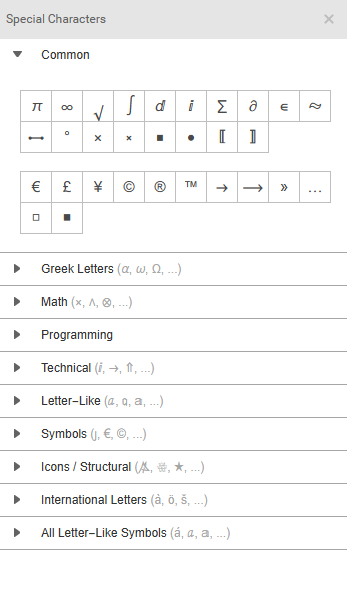
You can also insert special characters by typing their text representation.
Mathematica Code of Some Mathematical Symbols
| Symbol Name | Mathematica Code |
| Theta | \[Theta] |
| Pi | \[Pi] |
| Infinity | \[Infinity] |
| Square root | \[Sqrt] |
| Integral | \[Integral] |
| Summation symbol | \[Sum] |
| Alpha | \[Alpha] |
| Beta | \[Beta] |
| Gamma | \[Gamma] |
| Delta | \[Delta] |
Differentiation
To carry out differentiation, we make use of the capital "D". Considering the function below, we would perform the differentiation as shown in the diagram below.
$$f(x) = \sin^2 x \cos^3 y \tan^4 z$$
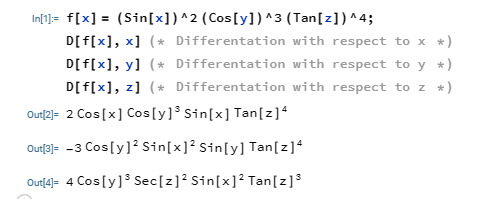
First, we write the function; next, we use the differentiation function (D) to differentiate it. In D[f[x],x] , we first write the function, and after the comma, we indicate what variable we are differentiating it with respect to (that is, the independent variable).
Note: Functions in Wolfram Mathematica start with capital letters, followed by an open square bracket, "[", and it ends with a closing square bracket, "]".
A semi-colon, ";", at the end of a line of code prevents the display of its output.
Higher Order Differentiation
To differentiate the function above with respect to y to the third order, we would make use of the code in the image below.
$$\frac {d^3f(x)}{dy^3}$$

In the code, we made use of a list containing the variable we are differentiating the function with respect to and the order. In this case, we are differentiated to the third order, which is why we used "3".
We could also do the below, but it is longer.

If you look closely, you would notice that both answers are the same. In this case, we embedded the lower order differentiation into the next order of differentiation with respect to y in each case.
Higher Order Differentiation with Respect to Several Variables
Still using our function above, we would differentiate the function with respect to x, y, and z.
$$\frac {d^3f(x)} {dx \hspace{1mm} dy \hspace{1mm} dz}$$
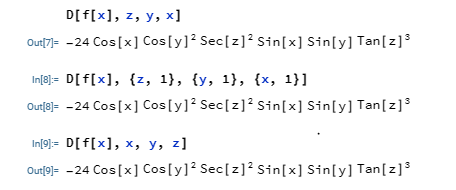
The above differentiation was done in three different ways in the image; in the first and second, we started with z to x, which is the normal way according to the Wolfram Mathematica documentation. In the second, you would notice that the order of differentiation is placed in a set with the variable it is differentiated with respect to. In the last, we started with x to z, and it still gave us the same answer. Sometimes, when we change the order, we would still have the same answer but in a different format. We could also use the long format.

Integration
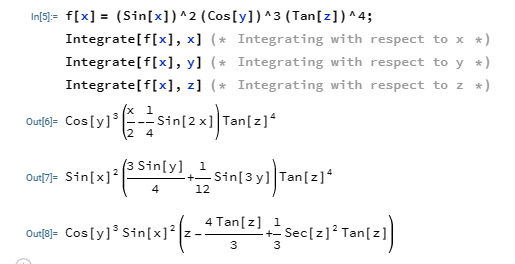
In Mathematica, we make use of the Integration function to integrate. Integration in Mathematica follows the same pattern as differentiation (discussed in the previous section of this article).
$$f(x) = \sin^2 x \cos^3 y \tan^4 z$$
$$\int f(x) = \int \sin^2 x \cos^3 y \tan^4 z$$
Using the same function used in the differentiation section; we integrate the function as shown in the diagram below.
Limits of Integration
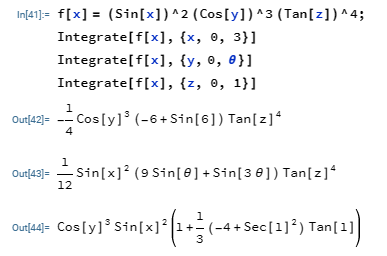
If the above function is to be integrated with limits, we put the variable we are integrating with respect to in a set with the lower and upper limits, e.g.; {x, 0, 3} would mean we are integrating with respect to x with its lower limit to be zero (0) and upper limit to be three (3).
$$\int^3_0 f(x) dx \hspace{1cm} \int^\theta_0 f(x) dy \hspace{1cm} \int^1_0 f(x) dz$$
Multiple Integrals
If we have;
$$f(x) = y \sin{x}\cos{y}$$
To integrate with respect to y first and x later, we would use the code in the image below.
$$\int dx \int y \sin{x} \cos{y} \hspace{1mm} dy$$

The Gradient of Several Variables
The gradient of several variables is the partial differentiation of a particular function in diverse orthonormal positions of the vector.
$$Grad \hspace{1mm} f(x) = \frac {\partial f(x)}{dx}i + \frac {\partial f(x)}{dy}j + \frac {\partial f(x)}{dz}k$$
To get the gradient of the function used in the differentiation section of this article, we use the code in the image below:

From the above, you would notice that the answer gotten is the set of d[fx]/dx, d[fx]/dy, d[fx]/dz . Check the answers we got when we differentiated with respect to each of the variables in the differentiation section of this article.
Working with Vectors
Unit Vector
If we have a position vector to be r = 2i + 3j + 5k , the unit vector would be:
$$\hat{r} = \frac {\overrightarrow{r}} {\mid r \mid} = \frac {2}{\sqrt{{2}^{2}+{3}^{2}+{5}^{2}}}i + \frac {3}{\sqrt{{2}^{2}+{3}^{2}+{5}^{2}}}j + \frac {5}{\sqrt{{2}^{2}+{3}^{2}+{5}^{2}}}k$$
$$\hat{r} = \frac {2}{\sqrt{38}}i + \frac {3}{\sqrt{38}}j + \frac {5}{\sqrt{38}}k$$
In Mathematica, we use the Normalize function to calculate the unit vector of a vector position.

Note:
$$\sqrt{ \frac {2}{19} } = \frac {2} {\sqrt{38}}$$
Dot Product
Dot product (also called a scalar product) is the product of two vectors to give us a scalar value. If we have a and b to be vector positions, the scalar/dot product (whose operator is represented by a dot) would be;
$$a.b = |a||b| \cos \theta$$
Theta is the angle between a and b. Using dot product on unit vectors (i, j, and k), we get;
$$i.i = j.j = k.k = 1$$
$$i.j = j.k = k.i = i.k = k.j = j.i = 0$$
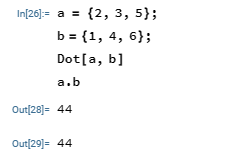
If we have a position vector, a = 2i + 3j + 5k, and another, b = 1i + 4j + 6k, the dot product would be;
$$a.b = 2(1)+3(4)+5(6) = 2 + 12 + 30 = 44$$
In Mathematica, we could use the Dot function or the dot (.) symbol to perform scalar product.
Cross Product
Cross product (also called vector product) is the product of two or more vectors to give us a vector. If we have a and b to be vector positions, the vector product (whose operator is represented by a cross) would be;
$$a \times b = |a||b| \sin{x}$$
Using the cross product on unit vectors (i, j, and k), we get;
$$i \times i = j \times j = k \times k = 0$$
$$i \times j = k \hspace{1.5cm} j \times i = -k$$
$$j \times k = i \hspace{1.5cm} k \times j = -i$$
$$k \times i = j \hspace{1.5cm} i \times k = -j$$
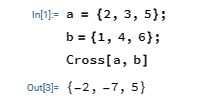
If we have a position vector, a = 2i + 3j + 5k, and another, b = 1i + 4j + 6k, the cross product would be the determinant of the matrix;

Using Mathematica, we make use of the Cross function to perform the vector product of vectors.
Replace All Function (/.)
In maths question, we tend to have questions which says something like, "as x tend to 0, or evaluate the function when x = 10, etc." The replace all function and the right arrow are used to achieve this. The replace function in Mathematica is /. , while the right arrow is -> .
If we have the function;
$$f(x) = y \sin{x}\cos{y}$$
which we hope to differentiate with respect to y when y = 3 and x = 2; our Mathematica code would be:

When pi is used with trigonometric functions, it is treated in radians (that is, pi equals 180 degrees instead of 3.142...).

In long form, our answer would be ;
$$\cos{\pi} \sin{\theta} - \pi \sin{\theta} \sin{\pi} = \cos{180} \sin{\theta} - \pi \sin{\theta} \sin{180}$$
Where Sin 180 = 0 and Cos 180 = -1; therefore our answer would be;
$$- \sin{\theta}$$
Directional Derivative
Directional derivative is the dot product of the gradient of a scalar field and the unit vector of a vector position.
$$D_uf(x)= u.Grad \hspace{1mm}f(x)$$
Where u is the unit vector of the vector position given.
Example:
If we have a function;
$$\tan^{-1} \frac{xy}{z}$$
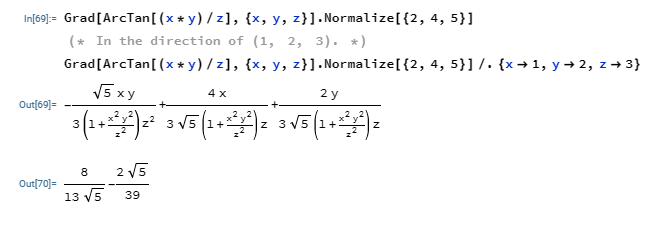
and we are to find the directional derivative at the point (2, 4, 5) in the direction (1, 2, 3).
The above question implies that the vector position is 2i + 4j + 5k, and x = 1, y = 2, and z = 3.
We would solve the question using all we have learnt from the previous sections.
Graph Plotting
2D Plot
To plot a 2D graph of a function, we make use of the Plot function. If we want to plot Sin x, we would enter the code as shown in the image below;
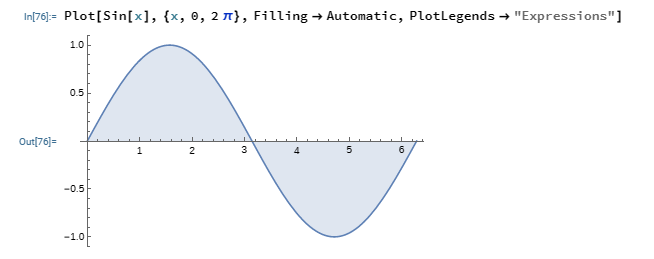
The first parameter in the Plot function is the function we hope to plot, the second is the range for the plot, while the other parameters are optional.
Multiple 2D Plots on the Same Graph
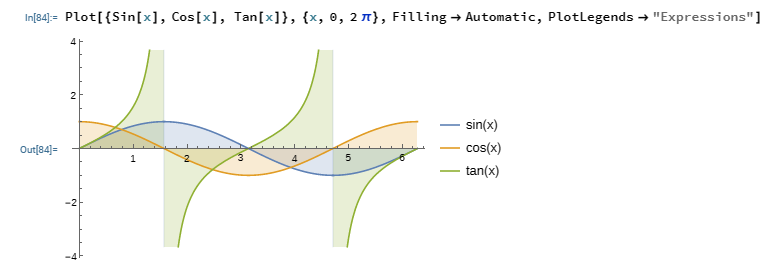
For multiple plots on the same graph, we place the functions we want to plot in a set as shown in the diagram below.
Plotting Piecewise Curves
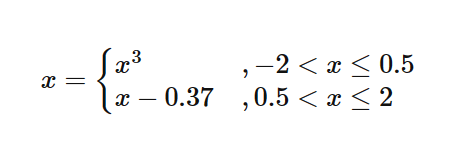
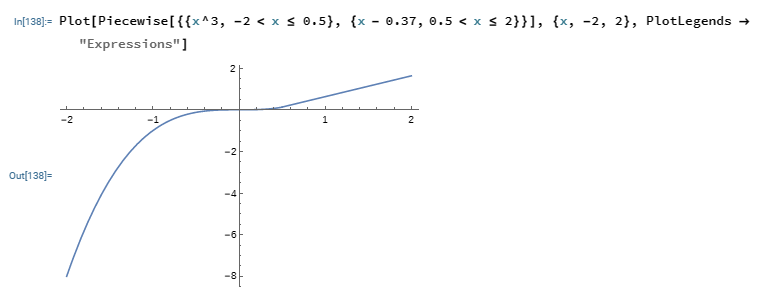
We would plot the piecewise curve using the Piecewise function nested in the Plot function as shown in the image below.
3D Plot
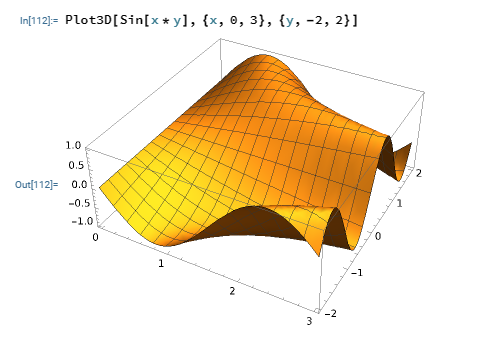
The Plot3D function is used to plot 3-dimensional diagrams. Three parameters are required in the Plot3D function (that is, the function to be plotted and the ranges of the two variables in the function).
Combining Two 3D Plots
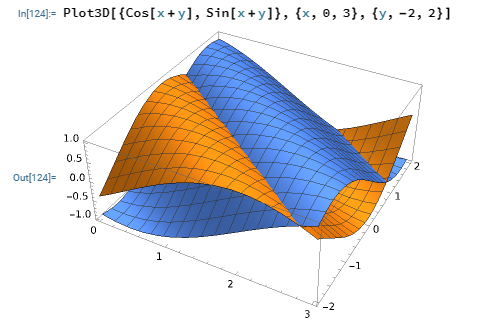
The functions to be plotted are placed in the set as the first parameter in the Plot3D function as shown in the image below.
Getting Help from the Documentation
To access the documentation, click on the Help tab and select Documentation.

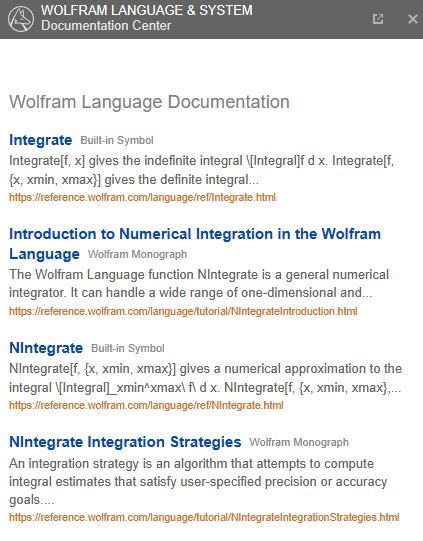
You would see the documentation on the side of the notebook.

You could also access the documentation of a built-in function by hovering over it and clicking on the info icon that displays.

Documentation related to the function info icon clicked would be visible in the sidebar.
Subscribe to my newsletter
Read articles from Favour Olumese directly inside your inbox. Subscribe to the newsletter, and don't miss out.
Written by

Favour Olumese
Favour Olumese
Hello, I am Favour. I am a Python enthusiast. The Coding Process is a place where I document and consolidate what I learn on my journey towards becoming a programmer. Kindly join me. I am also a poet and non-fiction writer. You could visit https://favourolumese.medium.com to read my writings. Thank you.