My First Data Analytics Portfolio Project with Power BI
 Muskan Kansal
I started my self-paced journey of learning Power BI 2 weeks ago and have built my first Power BI Report. I started from knowing nothing about data engineering and data analytics to learning a lot along the way. Power BI is a great tool for deriving insights and building narratives/stories from your raw data.
Why Power BI?
Power BI is a Microsoft application for loading, modeling and visualizing data. Our goal with power bi is to build dashboards that visualize and explains data to end user. Power BI provides each visual for a different purpose for free and also provides support for importing custom visuals. They make our report more appealing.
Power Bi is free to get started with. You don't require to sign up to build a report but if you wish to publish your report you need to have a Microsoft account.
Power BI allows users to load data from various sources and the power query editor makes it use to clean, filter and query data. Power BI Query provides a lot of different options to enrich our source data.
Power BI supports a 3-step process.
Connect to your Data Source and filter, and clean your raw data if needed
Build relationships within the table/query to build a data model.
Create reports that stand out with the help of this data model
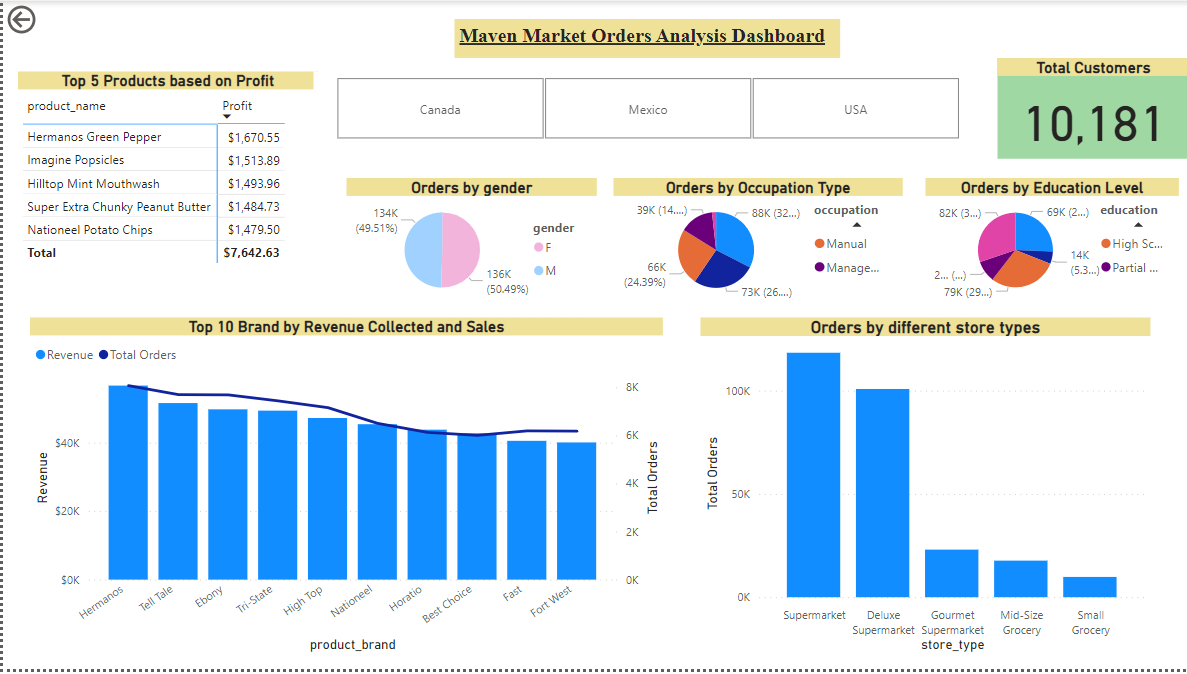
Visual used for Developing Report
Matrix - Displays the top 5 products by profitability
Card - Displays the number of customers whose data is present
Slicer - displays the list of countries where the sales took place in the form of tiles. Can be used to further filter down our report based on the country selected.
Pie Chart - Displays orders based on gender type (Male or Female), education level and Occupation type (Manual, Managerial, Professional, Management, Skilled Manual)
Line and Stacked Column Chart - To display total Revenue earned by the top 10 brands. The line indicates the total orders received by each of them
Stacked Column Chart - It displays total orders that took place across different store types
Resources Used
Microsoft Power BI with Desktop Training Course | Udemy - A beginner-friendly course to get you started with Power BI
Get started with Power BI Desktop - Power BI | Microsoft Learn
Learnings from Project
How to import data into power bi and data disabling refresh setting for the table
Creating table relationships and two-way filters
Creating DAX Measures and Calculated Columns
Understanding the type of visual to use for different purposes
Publishing Report
Subscribe to my newsletter
Read articles from Muskan Kansal directly inside your inbox. Subscribe to the newsletter, and don't miss out.
Written by
