Visualize The Virtual Memory
 Bhanuprakash Eagala
Hi there, Hope you are doing well : )
Welcome to another interesting topic! As a Computer Science enthusiast, I enjoy Reading, Exploring, Experimenting, and learning a few things on the way. My interests lie mostly but are not limited to the areas of Operating Systems, Computer Organization and Architecture, And Network Programming.
Understanding the concepts at a system level requires knowledge of a wide range of topics and this learning is a never-ending journey. It needs us to get our hands dirty and learn things more practically. This is what I have tried, a practical way of learning, by doing.
What is this Article about?
In this write-up, the goal is to learn some fundamentals of Memory management. I will explain a bit about Virtual Memory and How it works, but the main goal of this article is to dive into the contents of virtual memory while a process is running and visualize different parts of it.
And, We will use /proc to find and modify the variables(in this example, ASCII string) contained inside the virtual memory of a running process, and learn some cool things along the way!
I am using the following environment:
Linux Distro: Ubuntu 22.04 LTS
Compiler: (gcc (Ubuntu 11.3.0-1ubuntu1~22.04) 11.3.0)
Python : Python 3.10.6
Intro to Virtual Memory
Today we are going to enter into the realm of Virtual Memory, One of the fantastic techniques used by Modern Operating Systems to execute Complex Applications that require more RAM(Primary Memory) than the available physical memory or to run multiple programs simultaneously, and some other cases, in which the finite memory of Computers might not sufficient enough.
Virtual memory is a memory management technique that uses both hardware and software to enable a computer to compensate for physical memory shortages, temporarily transferring data from Random Access Memory to disk storage. Mapping chunks of memory to disk files enables a computer to treat secondary memory as though it were main memory.
How it Works
I am sure you can find plenty of information about Virtual Memory out there, with in-depth explanations. As the main goal of this article is not about going into depth on how Virtual Memory works, I'll just write a few lines, giving you a quick and higher-level view of this concept.
When an application is in use, data from that program is stored in a physical address using RAM. A memory management unit (MMU) maps the address to RAM and automatically translates addresses. The MMU can, for example, map a logical address space to a corresponding physical address. If at any point, the RAM space is needed for something more urgent, data can be swapped out of RAM and into virtual memory. The computer's memory manager is in charge of keeping track of the shifts between physical and virtual memory. If that data is needed again, the computer's MMU will use a context switch to resume execution. While copying virtual memory into physical memory, the OS divides memory with a fixed number of addresses into either pagefiles or swap files. Each page is stored on a disk, and when the page is needed, the OS copies it from the disk to the main memory and translates the virtual addresses into real addresses.
However, the process of swapping virtual memory to physical is rather slow. This means using virtual memory generally causes a noticeable reduction in performance. Because of swapping, computers with more RAM are considered to have better performance.
This is just a higher-level view of how Virtual Memory works. You can read more about it on the internet. For now, here are some key points you should know before you read on:
Each process has its own virtual memory
The amount of virtual memory depends on your system's architecture
Each OS handles virtual memory differently, but for most modern operating systems, the virtual memory of a process looks like the following:
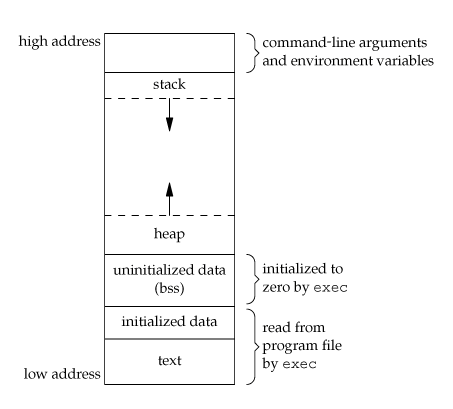
In the high memory addresses, we can see but are not limited to:
-> The command line arguments and environment variables
-> The Stack, growing "downwards". This may seem different from theory(intuitively, the stack grows upward), but this is the way the stack is implemented in virtual memory
In the low memory addresses we can find:
-> Our executable
->The heap, growing "Upwards"
The heap is a portion of memory that is dynamically allocated using malloc in C
Note: Virtual Memory is not the same as RAM
Virtual Memory Demo with C strings
Let's start with a C Program
#include <stdio.h>
#include <stdlib.h>
#include <string.h>
/**
* main - uses strdup to create a new string, and prints
* the address of the new duplicated string
*
*Return : EXIT_FAILURE if malloc failed. Otherwise EXIT_SUCCESS
*/
int main(void){
    char *s;
    s = strdup("Bhanuprakash");
    if(NULL == s){
        fprintf(stderr, "Can't allocate mem with malloc\n");
        return (EXIT_FAILURE);
    }
    printf("%p\n", (void*)s);
    return (EXIT_SUCCESS);
}
strdup:
Do you reckon strdup creates a copy of the string "Bhanuprakash"?
Yes. strdup has to create a new string which means it has to reserve space for it. In my terminal, a quick look at its man page can confirm:

Now, Based on what we said earlier about virtual memory, Can you guess where this duplicate string will be located?
At a high or low memory address in the process memory model diagram above?
Yes, you are right. It is in the lower addresses(in the heap memory). Let's compile and run our small C program to confirm once:

So, our duplicated string is located at the address 0x5606a945d2a0. That's great. But, is this a low or high memory address?
Let's dive further to get this answer.
Range of the Virtual Memory of a Process
The size of the virtual memory of a process depends on the system's architecture. As I am using a 64-bit machine, theoretically the size of each process' virtual memory is 2 to the power of 64(2^64) bytes. In theory, the highest memory address possible is 0xffffffffffffffff , and the lowest is 0x0.
0x5606a945d2a0 is small compared to 0xffffffffffffffff, so the duplicated string is probably located at a lower memory address. Now, It's time to look into the concept called /proc file system.
The proc filesystem
In Linux, everything is a file. As you can see in the following screenshot of my current root folder(represented as /), there are different kinds of files. We will not be going into all of them in this article, but a bit of knowledge about proc directory.

from the man pages of proc:

We will focus on two of the files in proc directory
/proc/[pid]/mem
/proc/[pid]/maps
mem
From the man page of proc: used to access the pages of a process's memory.

maps
From man proc:
/proc/[pid]/maps
              A file containing the currently mapped memory regions and their access permissions.  See mmap(2) for some further information  about memory mappings.
Permission to access this file is governed by a ptrace access mode PTRACE_MODE_READ_FSCREDS check; see ptrace(2).
The format of the file is:
address           perms offset   dev   inode   pathname
00400000-00452000 r-xp 00000000 08:02 173521  /usr/bin/dbus-daemon
00651000-00652000 r--p 00051000  08:02 173521 /usr/bin/dbus-daemon
00652000-00655000 rw-p 00052000 08:02 173521  /usr/bin/dbus-daemon
00e03000-00e24000 rw-p 00000000 00:00 0       [heap]
00e24000-011f7000 rw-p 00000000 00:00 0       [heap]
                           ...
35b1800000-35b1820000 r-xp 00000000 08:02 135522 /usr/lib64/ld-2.15.so
35b1a1f000-35b1a20000 r--p 0001f000 08:02 135522  /usr/lib64/ld-2.15.so
35b1a20000-35b1a21000 rw-p 00020000 08:02 135522  /usr/lib64/ld-2.15.so
35b1a21000-35b1a22000 rw-p 00000000 00:00 0
35b1c00000-35b1dac000 r-xp 00000000 08:02 135870  /usr/lib64/libc-2.15.so
35b1dac000-35b1fac000 ---p 001ac000 08:02 135870  /usr/lib64/libc-2.15.so
35b1fac000-35b1fb0000 r--p 001ac000 08:02 135870  /usr/lib64/libc-2.15.so
35b1fb0000-35b1fb2000 rw-p 001b0000 08:02 135870  /usr/lib64/libc-2.15.so
                  ...
f2c6ff8c000-7f2c7078c000 rw-p 00000000 00:00 0    [stack:986]
                  ...
7fffb2c0d000-7fffb2c2e000 rw-p 00000000 00:00 0   [stack]
7fffb2d48000-7fffb2d49000 r-xp 00000000 00:00 0   [vdso]

The address field is the address space in the process that the mapping occupies.  The perms field is a set of permissions:

                  r = read
                  w = write
                  x = execute
                  s = shared
                  p = private (copy on write)
The  offset field is the offset into the file/whatever; dev is the device (major:minor); inode is the inode on that device. 0 indicates that no inode is associated with the memory region, as would be the case with BSS (uninitialized data).

The pathname field will usually be the file that is backing the mapping.For ELF files, you can easily coordinate with  the  offset
field by looking at the Offset field in the ELF program headers (readelf -l).

There are additional helpful pseudo-paths:

[stack]
The initial process's (also known as the main thread's) stack.

[stack:<tid>] (from Linux 3.4 to 4.4)
A  thread's  stack (where the <tid> is a thread ID).  It corresponds to the /proc/[pid]/task/[tid]/ path.  This field was removed in Linux 4.5, since providing this information for a process with large numbers of threads is expensive.
[vdso] The virtual dynamically linked shared object.  See vdso(7).

[heap] The process's heap.

If the pathname field is blank, this is an anonymous mapping as obtained via mmap(2).  There is no easy way to coordinate this  back
to a process's source, short of running it through gdb(1), strace(1), or similar.

pathname is shown unescaped except for newline characters, which are replaced with an octal escape sequence.  As a result, it is not
possible to determine whether the original pathname contained a newline character or the literal \012 character sequence.

If the mapping is file-backed and the file has been deleted, the string " (deleted)" is appended to the pathname.  Note that this is ambiguous too.
Under Linux 2.0, there is no field giving pathname.
This means that we can look at the /proc/[pid]/mem file to locate the heap of a running process. If we can read from the heap, we can locate the string.
pid
A process is an instance of a program, with a unique process ID. This process ID (PID) is used by many functions and system calls to interact with and manipulate processes. We can use the program ps to get the PID of a running process(man ps).
Now, we have a bit of background knowledge on Virtual Memory, We will work with the following simple C Program that infinitely loops and prints a string "KeepLearning"
#include <stdio.h>
#include <stdlib.h>
#include <string.h>
#include <unistd.h>

int main(void){
    char *s;
    unsigned long int i;
    s = strdup("KeepLearning");
    if(s == NULL){
        fprintf(stderr, "Can't allocate mem with malloc\n");
        return (EXIT_FAILURE);
    }
    i = 0;
    while(s){
        printf("[%lu] %s (%p)\n", i, s, (void*)s);
        sleep(1);
        i++;
    }
    return (EXIT_SUCCESS);
}
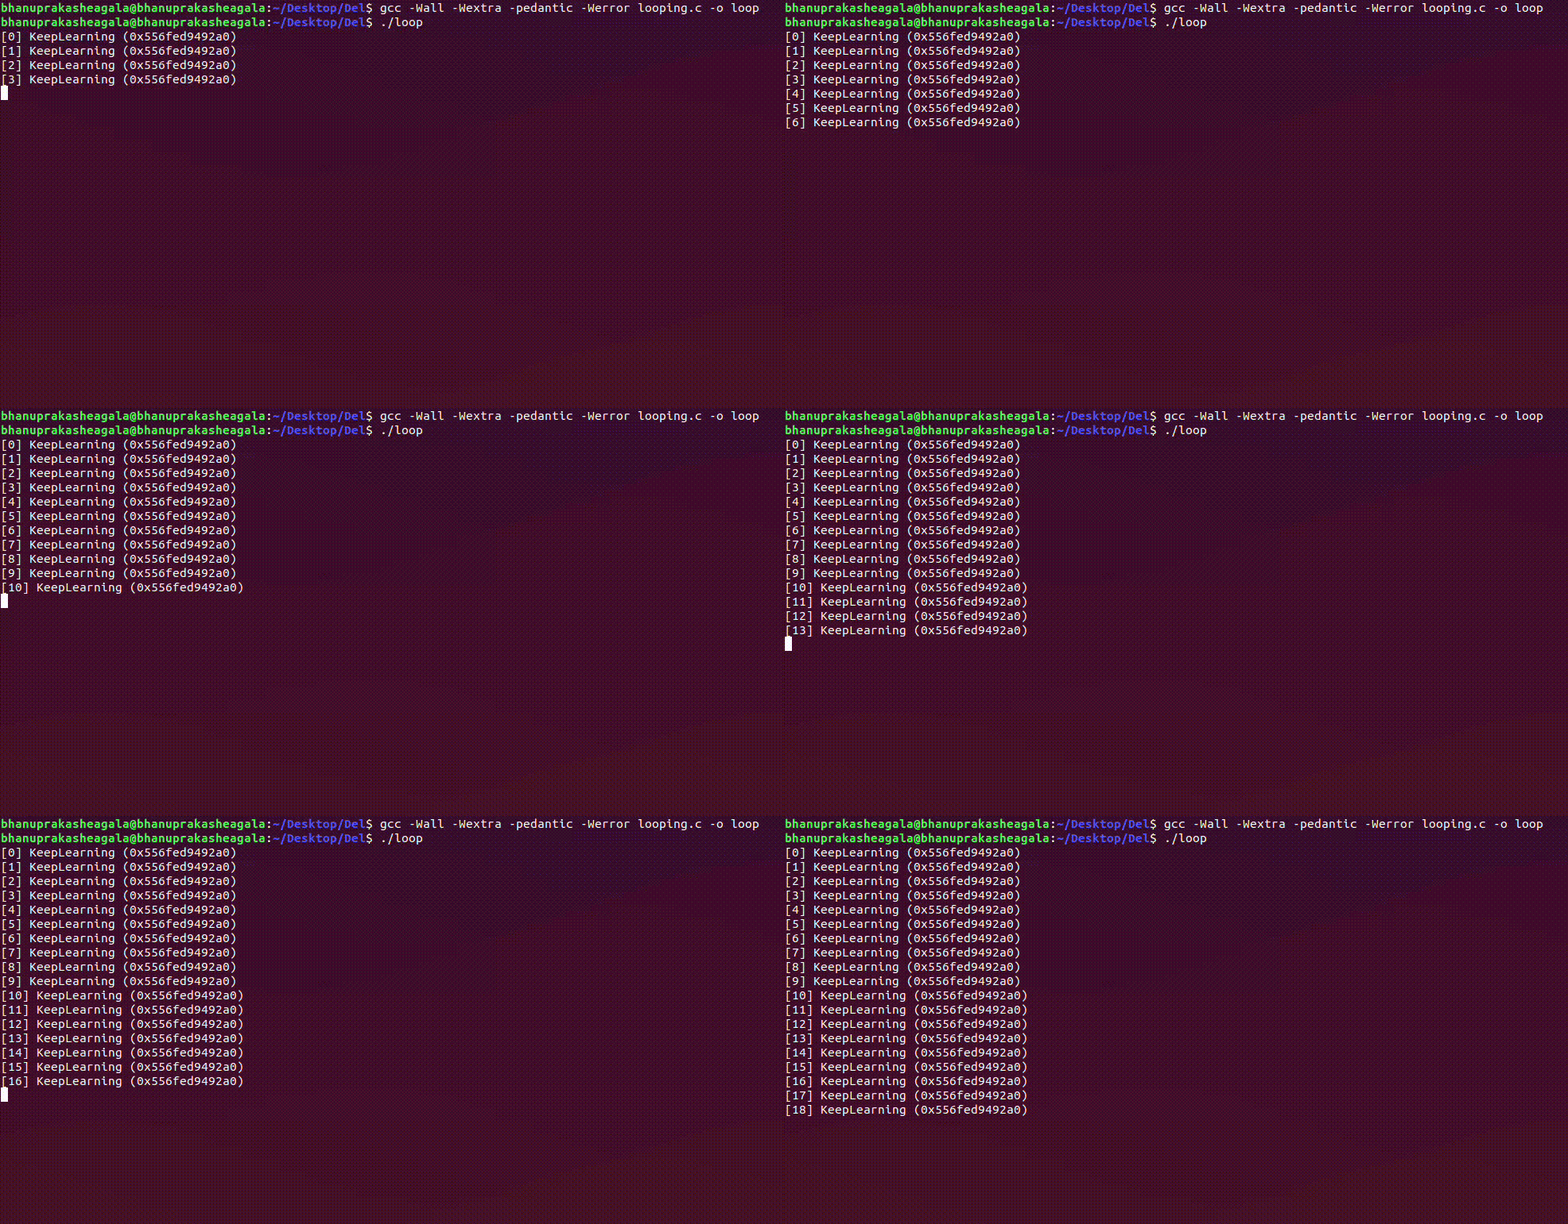
Compiling and running the above code gives the following output, and it continues indefinitely running until we kill the process.
Looking at /proc
While the program is in execution(Now, It's a running Process), the first thing we need is the PID of the above process. So, we use ps command and we filter out only this process using the grep command by using one of the Inter Process Communication mechanisms used by Operating Systems called Pipes.

In the above example, the PID is 9983 (It will be different each time we run it, and it's mostly a different number if you are trying it on your system). As a result, the maps and mem files we want to look at are located in the /proc/14832 directory:
/proc/14832/maps
/proc/14832/mem
A quick look into this /proc/14832 directory:
bhanuprakasheagala@bhanuprakasheagala:~/Desktop/Del$ cd /proc/14832
bhanuprakasheagala@bhanuprakasheagala:/proc/14832$ ls -l
total 0
-r--r--r--  1 bhanuprakasheagala bhanuprakasheagala 0 Jan 26 16:27 arch_status
dr-xr-xr-x  2 bhanuprakasheagala bhanuprakasheagala 0 Jan 26 16:27 attr
-rw-r--r--  1 bhanuprakasheagala bhanuprakasheagala 0 Jan 26 16:27 autogroup
-r--------  1 bhanuprakasheagala bhanuprakasheagala 0 Jan 26 16:27 auxv
-r--r--r--  1 bhanuprakasheagala bhanuprakasheagala 0 Jan 26 16:27 cgroup
--w-------  1 bhanuprakasheagala bhanuprakasheagala 0 Jan 26 16:27 clear_refs
-r--r--r--  1 bhanuprakasheagala bhanuprakasheagala 0 Jan 26 16:25 cmdline
-rw-r--r--  1 bhanuprakasheagala bhanuprakasheagala 0 Jan 26 16:27 comm
-rw-r--r--  1 bhanuprakasheagala bhanuprakasheagala 0 Jan 26 16:27 coredump_filter
-r--r--r--  1 bhanuprakasheagala bhanuprakasheagala 0 Jan 26 16:27 cpu_resctrl_groups
-r--r--r--  1 bhanuprakasheagala bhanuprakasheagala 0 Jan 26 16:27 cpuset
lrwxrwxrwx  1 bhanuprakasheagala bhanuprakasheagala 0 Jan 26 16:27 cwd -> /home/bhanuprakasheagala/Desktop/Del
-r--------  1 bhanuprakasheagala bhanuprakasheagala 0 Jan 26 16:27 environ
lrwxrwxrwx  1 bhanuprakasheagala bhanuprakasheagala 0 Jan 26 16:27 exe -> /home/bhanuprakasheagala/Desktop/Del/loop
dr-x------  2 bhanuprakasheagala bhanuprakasheagala 0 Jan 26 16:27 fd
dr-xr-xr-x  2 bhanuprakasheagala bhanuprakasheagala 0 Jan 26 16:27 fdinfo
-rw-r--r--  1 bhanuprakasheagala bhanuprakasheagala 0 Jan 26 16:27 gid_map
-r--------  1 bhanuprakasheagala bhanuprakasheagala 0 Jan 26 16:27 io
-r--r--r--  1 bhanuprakasheagala bhanuprakasheagala 0 Jan 26 16:27 limits
-rw-r--r--  1 bhanuprakasheagala bhanuprakasheagala 0 Jan 26 16:27 loginuid
dr-x------  2 bhanuprakasheagala bhanuprakasheagala 0 Jan 26 16:27 map_files
-r--r--r--  1 bhanuprakasheagala bhanuprakasheagala 0 Jan 26 16:27 maps
-rw-------  1 bhanuprakasheagala bhanuprakasheagala 0 Jan 26 16:27 mem
-r--r--r--  1 bhanuprakasheagala bhanuprakasheagala 0 Jan 26 16:27 mountinfo
-r--r--r--  1 bhanuprakasheagala bhanuprakasheagala 0 Jan 26 16:27 mounts
-r--------  1 bhanuprakasheagala bhanuprakasheagala 0 Jan 26 16:27 mountstats
dr-xr-xr-x 59 bhanuprakasheagala bhanuprakasheagala 0 Jan 26 16:27 net
dr-x--x--x  2 bhanuprakasheagala bhanuprakasheagala 0 Jan 26 16:27 ns
-r--r--r--  1 bhanuprakasheagala bhanuprakasheagala 0 Jan 26 16:27 numa_maps
-rw-r--r--  1 bhanuprakasheagala bhanuprakasheagala 0 Jan 26 16:27 oom_adj
-r--r--r--  1 bhanuprakasheagala bhanuprakasheagala 0 Jan 26 16:27 oom_score
-rw-r--r--  1 bhanuprakasheagala bhanuprakasheagala 0 Jan 26 16:27 oom_score_adj
-r--------  1 bhanuprakasheagala bhanuprakasheagala 0 Jan 26 16:27 pagemap
-r--------  1 bhanuprakasheagala bhanuprakasheagala 0 Jan 26 16:27 patch_state
-r--------  1 bhanuprakasheagala bhanuprakasheagala 0 Jan 26 16:27 personality
-rw-r--r--  1 bhanuprakasheagala bhanuprakasheagala 0 Jan 26 16:27 projid_map
lrwxrwxrwx  1 bhanuprakasheagala bhanuprakasheagala 0 Jan 26 16:27 root -> /
-rw-r--r--  1 bhanuprakasheagala bhanuprakasheagala 0 Jan 26 16:27 sched
-r--r--r--  1 bhanuprakasheagala bhanuprakasheagala 0 Jan 26 16:27 schedstat
-r--r--r--  1 bhanuprakasheagala bhanuprakasheagala 0 Jan 26 16:27 sessionid
-rw-r--r--  1 bhanuprakasheagala bhanuprakasheagala 0 Jan 26 16:27 setgroups
-r--r--r--  1 bhanuprakasheagala bhanuprakasheagala 0 Jan 26 16:27 smaps
-r--r--r--  1 bhanuprakasheagala bhanuprakasheagala 0 Jan 26 16:27 smaps_rollup
-r--------  1 bhanuprakasheagala bhanuprakasheagala 0 Jan 26 16:27 stack
-r--r--r--  1 bhanuprakasheagala bhanuprakasheagala 0 Jan 26 16:25 stat
-r--r--r--  1 bhanuprakasheagala bhanuprakasheagala 0 Jan 26 16:27 statm
-r--r--r--  1 bhanuprakasheagala bhanuprakasheagala 0 Jan 26 16:25 status
-r--------  1 bhanuprakasheagala bhanuprakasheagala 0 Jan 26 16:27 syscall
dr-xr-xr-x  3 bhanuprakasheagala bhanuprakasheagala 0 Jan 26 16:27 task
-rw-r--r--  1 bhanuprakasheagala bhanuprakasheagala 0 Jan 26 16:27 timens_offsets
-r--r--r--  1 bhanuprakasheagala bhanuprakasheagala 0 Jan 26 16:27 timers
-rw-rw-rw-  1 bhanuprakasheagala bhanuprakasheagala 0 Jan 26 16:27 timerslack_ns
-rw-r--r--  1 bhanuprakasheagala bhanuprakasheagala 0 Jan 26 16:27 uid_map
-r--r--r--  1 bhanuprakasheagala bhanuprakasheagala 0 Jan 26 16:27 wchan
Contents of /proc/[pid]/maps
As we have seen earlier, the /proc/pid/maps file is a text file, so we can directly read it. The contents of the maps file of our process look like:
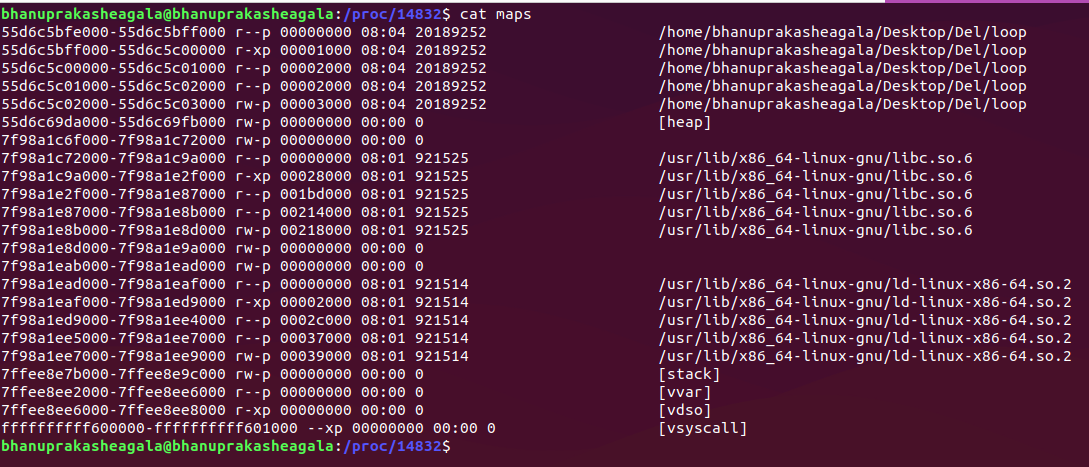
As we have said earlier, we can see that the Stack ([stack]) is located in high memory addresses and the Heap ([heap]) in the lower memory addresses.
Observing the [heap]
Using the maps file, we can find all the information we need to locate our string. You can observe the address range of heap as:
55d6c69da000 - 55d6c69fb000 rw-p 00000000 00:00 0 [heap]
This means, the heap:
Starts at address 55d6c69da000 in the virtual memory of a process
Ends at memory address 55d6c69fb000
Is a readable and writable(rw)
If you look at our (still running) looping program, out string is located at 0x5606a945d2a0 which lies in the above address range. This confirms that our string is located in the heap. Cool!
Replacing a string in the Virtual Memory
This is way cooler than just reading and checking the contents of a Virtual memory(In this case, Heap). If you observe the description(man page of proc) of the mem part above, we can see that this file can be used to access the pages of a process's memory through open, read, and lseek. Awesome!
So, can we access and modify the entire virtual memory of any process?
If we open the /proc/[pid]/mem file ( in our example, /proc/14832/mem) and seek to the memory address 0x5606a945d2a0, we can write to the heap of the running process, overwriting the "KeepLearning" string.
Let's do it by writing a script. We will be using Python3 for writing the script, but it can be done in any language. It will be a bit easier with Python as compared to some low-level languages like Cpp.
#!/usr/bin/env python3
'''
Locates and Replaces the first occurrence of a string in the heap
of a process.
Usage: python3 ./ScriptName.py PID Search_String Replace_by_String
Where:
- PID is the process ID of the target process
- Search_String is the ASCII string we are looking to overwrite
- Replace_by_String is the ASCII string we want to replace Search_String with
'''
import sys
def print_usage_and_exit():
    print('Usage: {} pid search write'.format(sys.arg[0]))
    sys.exit(1)
#check usage
if len(sys.argv) != 4:
    print_usage_and_exit()
#get the PID from args
pid = int(sys.argv[1])
if pid <= 0:
    print_usage_and_exit()
#get the Search string from input arguments
search_string = str(sys.argv[2])
if search_string == "":
    print_usage_and_exit()
#get the String with which we want to replace
write_string = str(sys.argv[3])
if write_string == "":
    print_usage_and_exit()

#open the maps and mem files of the process
maps_filename = "/proc/{}/maps".format(pid)
print("[*] maps: {}".format(maps_filename))
mem_filename = "/proc/{}/mem".format(pid))
print("[*] mem: {}".format(mem_filename))

#Try opening the maps file
try:
    maps_file = open('/proc/{}/maps'.format(pid), 'r')
except IOError as e:
    print("[ERROR] Can not open file {}:".format(maps_filename))
    print("  I/O error({}): {}".format(e.errno, e.strerror))
    sys.exit(1)
for line in maps_file:
    sline = line.split(' ')
    #Check if we found the heap
    if sline[-1][:-1] != "[heap]"
        continue
    print("[*] Found [heap]:")

    #Parse the line
    addr = sline[0];
    perm = sline[1];
    offset = sline[2];
    device = sline[3];
    inode = sline[4];
    pathname = sline[-1][:-1]
    print("\tpathname = {}".format(pathname))
    print("\taddresses = {}".format(addr))
    print("\tpermissions = {}".format(perm))
    print("\toffset = {}".format(offset))
    print("\tinode = {}".format(inode))

    #Check if there is a read and write permission
    if perm[0] != 'r' or perm[1] != 'w':
           print("[*] {} does not have read/write permission".format(pathname))
           maps_file.close()
           exit(0)
    #Get start and end of the heap in the Virtual Memory
    addr = addr.split("-")
    if len(addr) != 2:
        print("[*] Wrong address format")
        maps_file.close()
        exit(1)
    addr_start = int(addr[0], 16)
    addr_end = int(addr[1], 16)
    print("\tAddr start [{:x}] | end [{:x}]".format(addr_start, addr_end)

    #Open ans Read mem
    try:
        mem_file = open(mem_filename, 'rb+')
    except IOError as e:
        print("[ERROR] Can not open file {}:".format(mem_filename))
        print("   I/O error({}): {}".format(e.errno, e.strerror))
        maps_file.close()
        exit(1)

    #Read heap
    mem_file.seek(addr_start)
    heap = mem_file.read(addr_end - addr_start)

    # Find string
    try:
        i = heap.index(bytes(search_string, "ASCII"))
    except Exception:
        print("Can't find '{}'". format(search_string))
        maps_file.close()
        mem_file.close()
        exit(0)
    print("[*] Found '{}' at {:x}".format(search_string, i))

    #Write the new string
    print("[*] Writing '{}' at {:x}".format(write_string, addr_start + i))
    mem_file.seek(addr_start + i)
    mem_file.write(bytes(write_string, "ASCII"))

    #Close files
    maps_file.close()
    mem_file.close()

    #As there is only one heap in our example
    break
That's it. Remember that this script should be run with root privileges, otherwise, we won't be able to read or write /proc/[pid]/mem file, even if we are the owner of the process.
Running the Script
root@bhanuprakasheagala:/home/bhanuprakasheagala/Desktop/Del# python3 ReplaceStringInHeap.py 14832 KeepLearning "Learning Is FUN!"
[*] maps: /proc/14832/maps
[*] mem: /proc/14832/mem
[*] Found [heap]:
    pathname = [heap]
    addresses = 55d6c69da000-55d6c69fb000
    permisions = rw-p
    offset = 00000000
    inode = 0
    Addr start [55d6c69da000] | end [55d6c69fb000]
[*] Found 'KeepLearning' at 2a0
[*] Writing 'Learning Is FUN!' at 0x5606a945d2a0
root@bhanuprakasheagala:/home/bhanuprakasheagala/Desktop/Del#
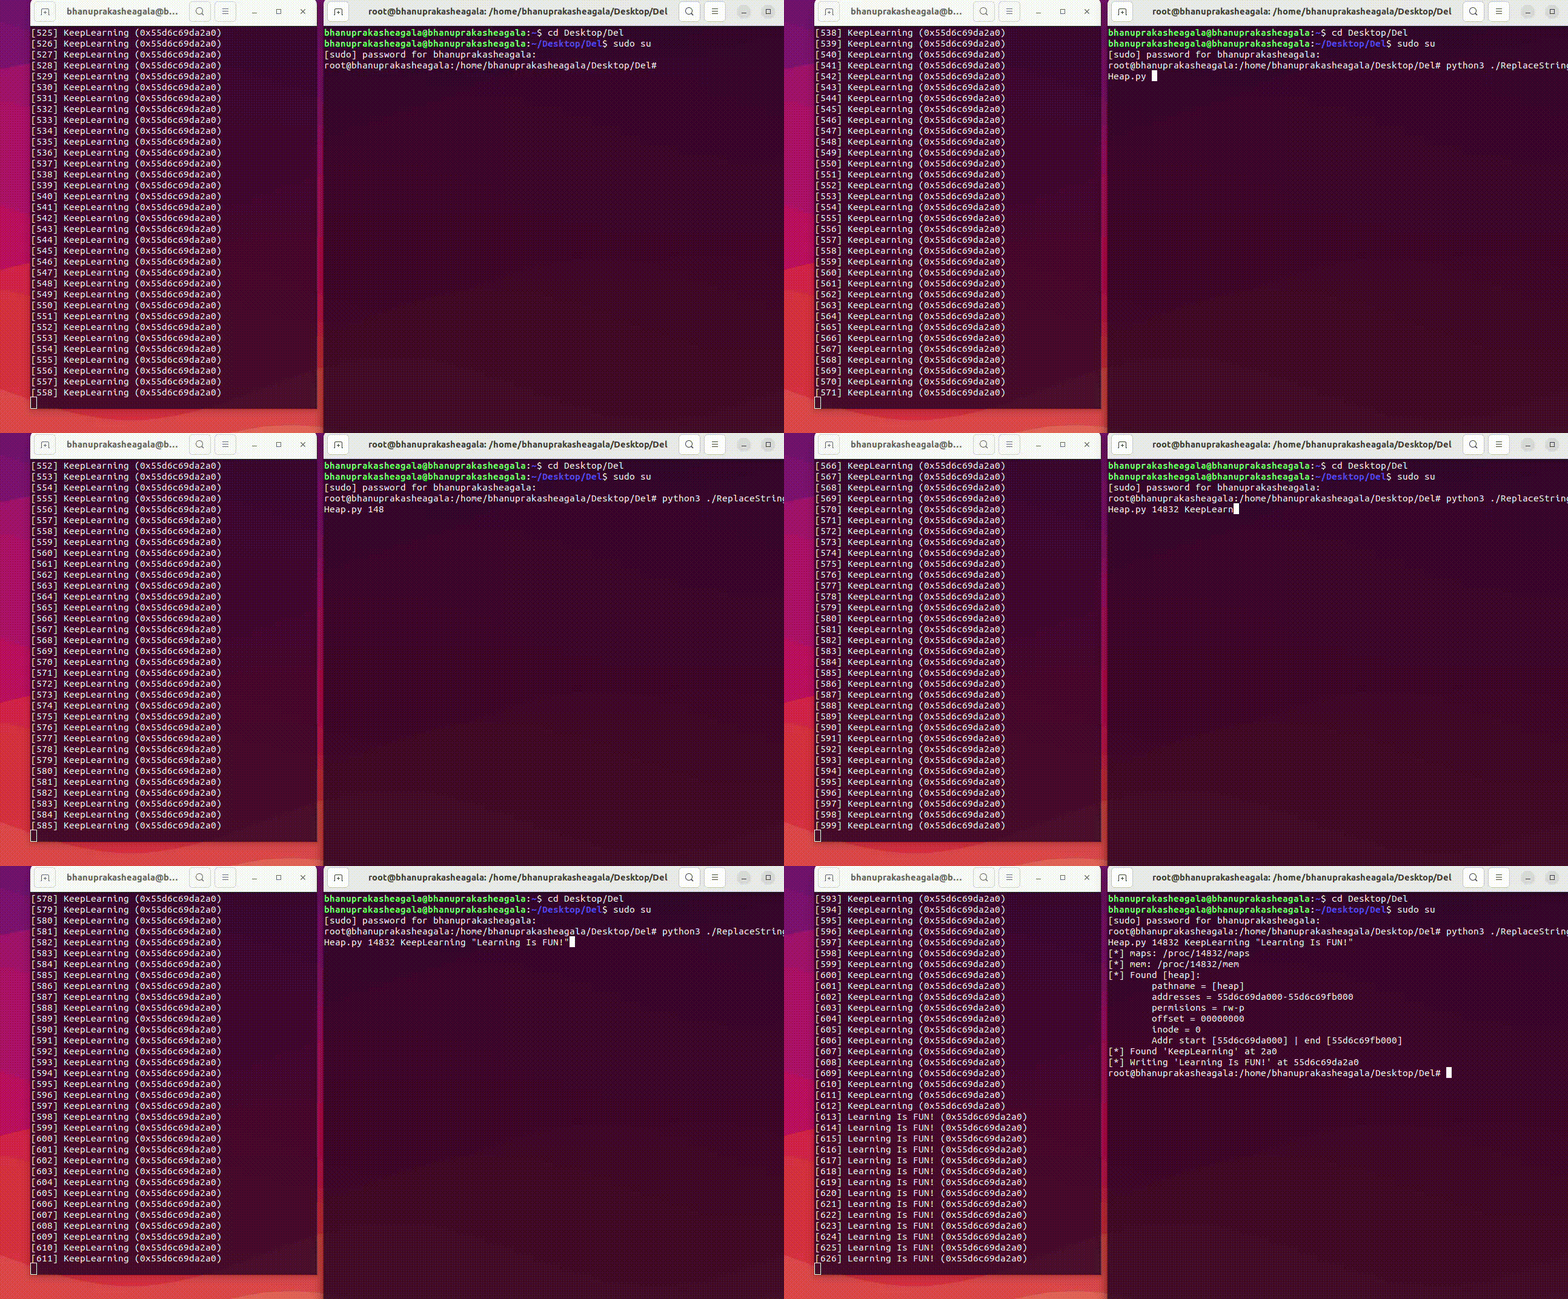
If we go back to our looping program, it should now print "Learning Is FUN!"
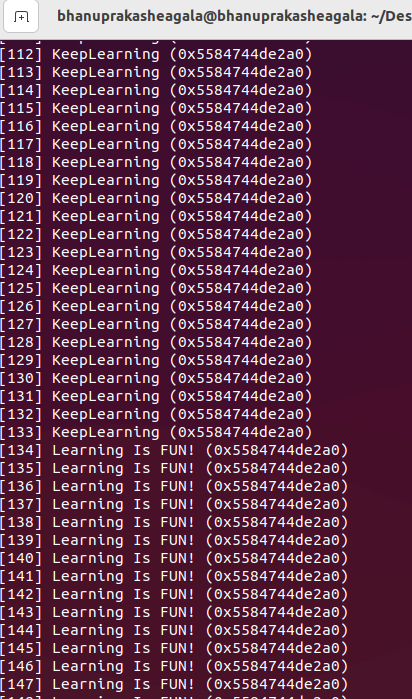
BANG** We have done it! We just hacked into a Virtual Memory of the process and modified its contents.
Here is a recorded GIF while running the script to modify the heap, along with the result on the left side.
Conclusion
Thanks for reading till the end. Hope you enjoyed and learned something interesting today!
I have been working on the above concept for the last few weeks and learned a lot of new things during this period. I have gone through a lot of resources on the Web, and Read a few Textbooks, without which it's impossible to learn these concepts. I am incredibly thankful to all the people out there Tech Communities, and Open Source developers who are helping by sharing their knowledge.
Please let me know your feedback as it will help me learn and improve, both my technical and writing skills. Thanks again, Have a great day!
Keep Learning.....
Subscribe to my newsletter
Read articles from Bhanuprakash Eagala directly inside your inbox. Subscribe to the newsletter, and don't miss out.
Written by
Bhanuprakash Eagala
Bhanuprakash Eagala
Computer Science enthusiast