Data Visualization
 Bella Eke
Table of contents

We have worked so hard in the last couple of months to gain valuable skills in data analytics and data science. Skills like SQL, Excel, Probability and Statistics, and A/B Testing theory/frameworks. Now is a great time to learn about data visualizations and storytelling.
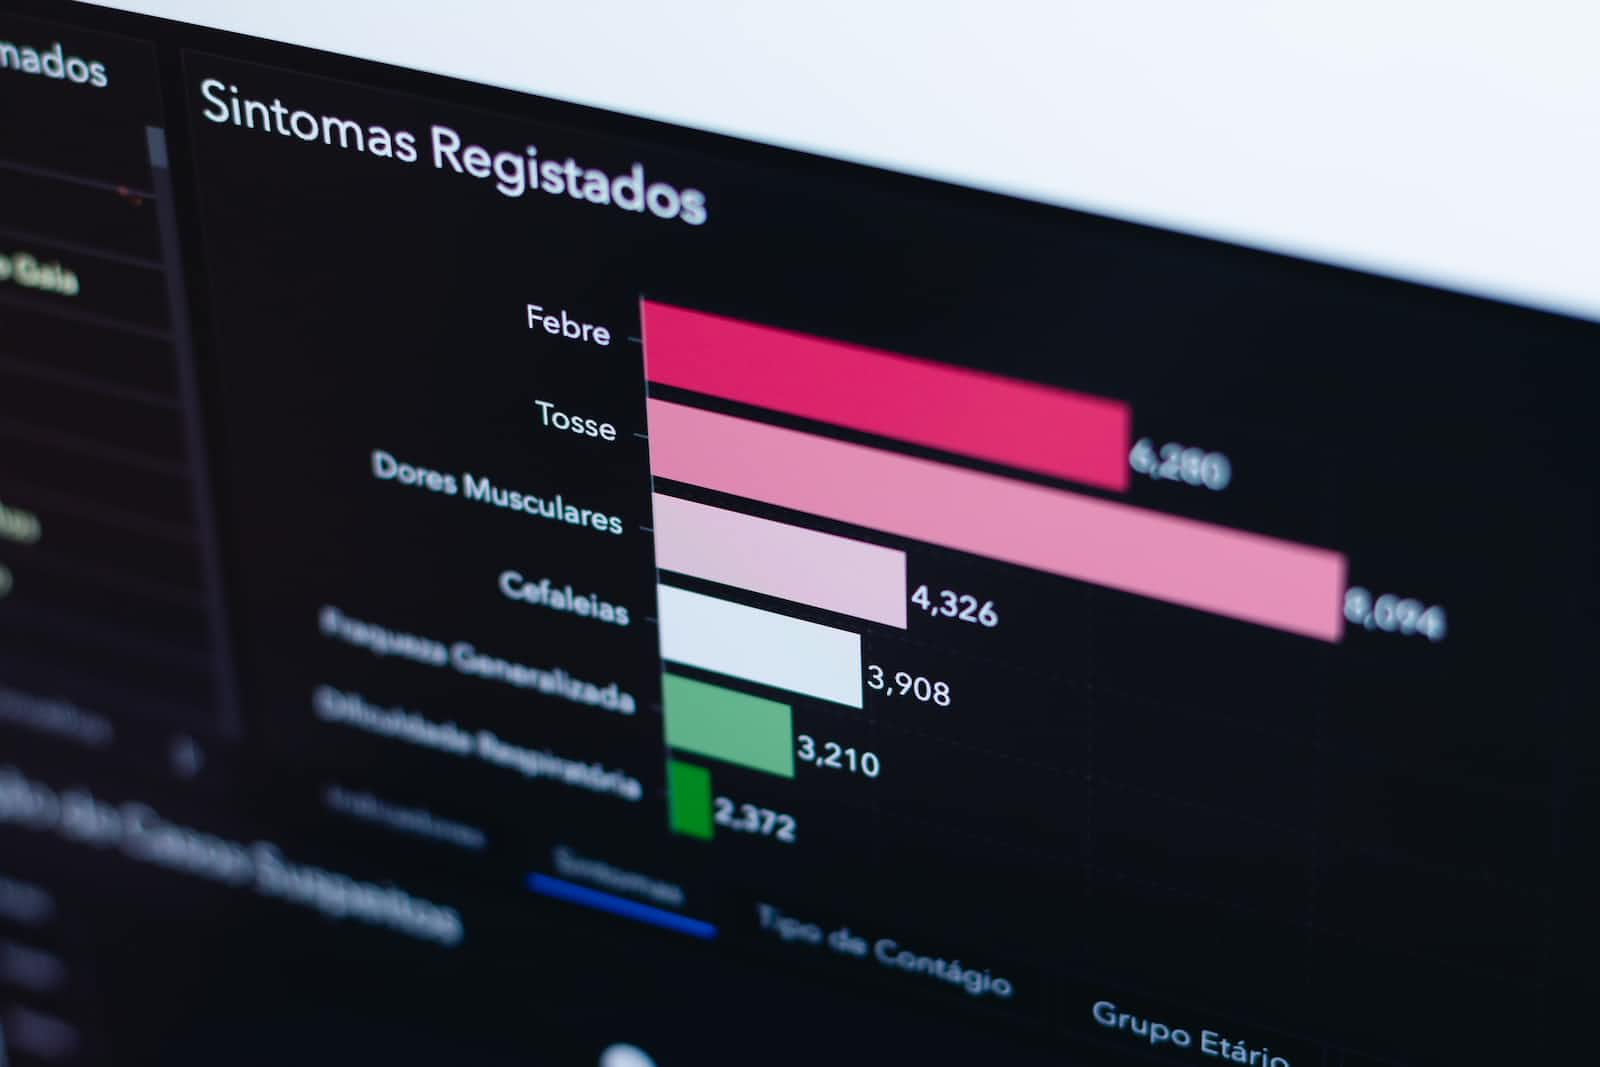
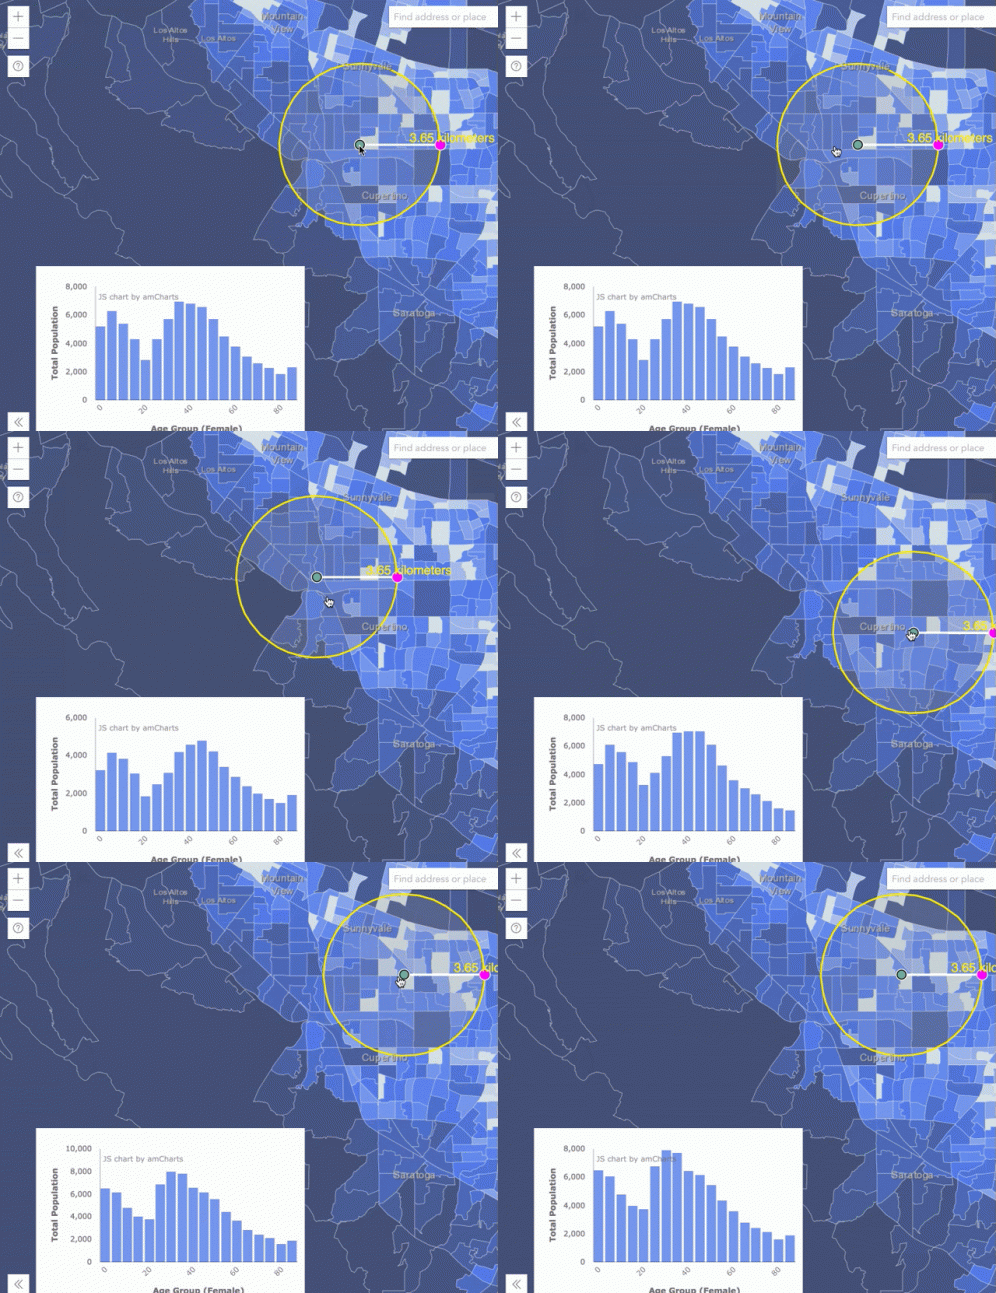
Visualization simply means using visuals/images to explain what your data is saying. This gives credence to the cliche that a picture is worth a thousand words. Using visuals gives a powerful representation of your data in a way that greatly impacts your business/company.
In the field of data, visualization, and business intelligence tools like Tableau, Power BI, and LookerStudio/Data Studio are widely used. They are all fundamentally similar and skills gained in one can be transferable to be used in the other.

The best way to learn how to use visualization tools is no other place than the tool's documentation and manufacturer's note. Other ways to learn how to use them are through youtube videos and tutorials. Many of these resources are free and easily accessible. There are also paid courses that can be accessed via MOOC's like Udemy, Coursera, data camp, etc. These MOOC's are usually well structured in bite-sized video lectures which can be consumed on the go and also come with learn-by-doing style lectures.
Visualization and storytelling is an art that helps to beautifully package all the heavy-duty analytics you have been doing. This is your 'aha moment' to bring your message home

It shows the great work you have done, in presenting your findings to your audience.
There are tons of public datasets with business problems that can be easily used to practice visualizations and storytelling. Forage also has real-life data analytics tasks from leading companies that can be used to practice and also build your data analyst project portfolio. Going through these tasks sequentially is highly recommended so as to have a first-hand experience of the daily tasks you would be expected to perform in your new role as a data analyst.
Most importantly, these tasks form part of your personal projects which you will use to pitch through your interviews to show that you actually know your stuff.
Now is the time to dive right in and start exploring these powerful visualization and business intelligence tools. 💚
Subscribe to my newsletter
Read articles from Bella Eke directly inside your inbox. Subscribe to the newsletter, and don't miss out.
Written by

Bella Eke
Bella Eke
I am a data professional known for my unique visual perception skills. My passion lies in unraveling the mysteries of this groundbreaking field and making it accessible to all. I thrive on simplifying the most complex concepts for everyone's benefit. Through the hashtags #DataBytes, #DataPills, and #DataDose, I daily disseminate knowledge, offering bite-sized portions of data insights. My mission is to enhance data literacy, a social responsibility I embrace as a way of giving back to humanity. Join me on this journey towards a data-driven future.