Browser Event loop: micro and macro tasks, call stack, render queue: layout, paint, composite
 Nik
NikThis article was initially published in my custom blog, but since I migrate to hashnode, I re-visited and re-wrote it
The article focuses on the event loop, the order of execution, and how developers can optimise code. The fully detailed schema:
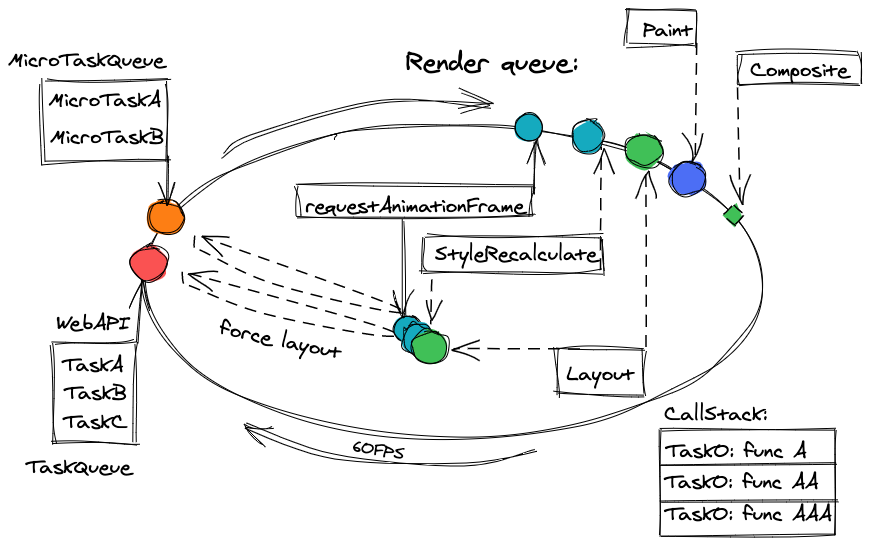
Event loop
Old operational systems didn't support multithreading and their event loop can be approximately described as a simple cycle:
while (true) {
    if (execQueue.isNotEmpty()) {
        execQueue.pop().exec();
    }
}
This code utilises all CPU. It was so in old OS. Modern OS schedulers are utterly complicated. They have prioritisation, execution queues, and many other technologies.
We can start describing the event loop as a cycle, which checks whether we have any pending tasks:
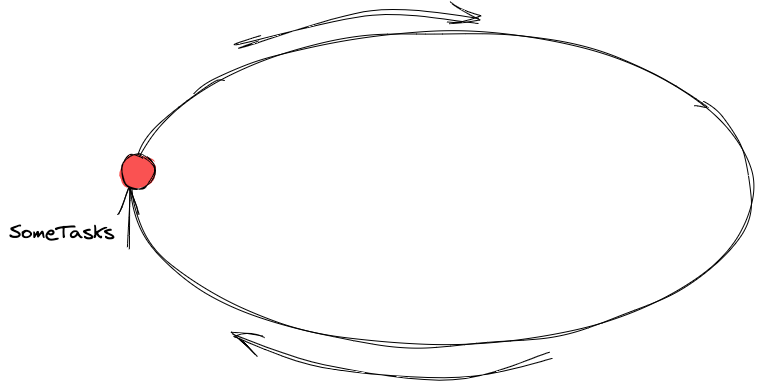
To get a task for the execution let's draft
✍️The list of triggers that can put a task into the event loop:
<script>tagPostponed tasks:
setTimeout,setInterval,requestIdleCallbackEvent handlers from browser API:
click,mousedown,input,blur,and etc.Some of the events are user-initiated like clicks, tab switching, etc.
Some of them are from our code:
XmlHttpRequestresponse handler,fetchpromise resolve, and so on
The promise state change. More about promises in my series
Observers like
DOMMutationObserver,IntersectionObserverRequestAnimationFrame
Almost everything we described above is planned through WebAPI (or browserAPI).
For example, we have such a line on our code: setTimeout(function a() {}, 100)
When we execute setTimeout the WebAPI postpones the task for 100ms. After 100ms WebAPI puts function a() into the queue. We can call it TaskQueue. EventLoop gets the task on the next cycle iteration and executes it.
We discussed tasks in our event loop. Both our JS code and browser should be able to work with DOM.
Our js code:
Reads the data of DOM elements: size, attributes, position, etc.
Mutates attributes: data- attr, width, height, position, CSS properties, etc.
Creates / removes HTML nodes
Browsers render the data so that the user can see the updates.
✍️Modern browsers execute both JS and render flow in the same thread. (except the cases, when we create a Web/Shared/Service worker).
That means, that the EventLoop should have "rendering" in the schema. The rendering flow is not a single operation. I'd say, it's render queue:
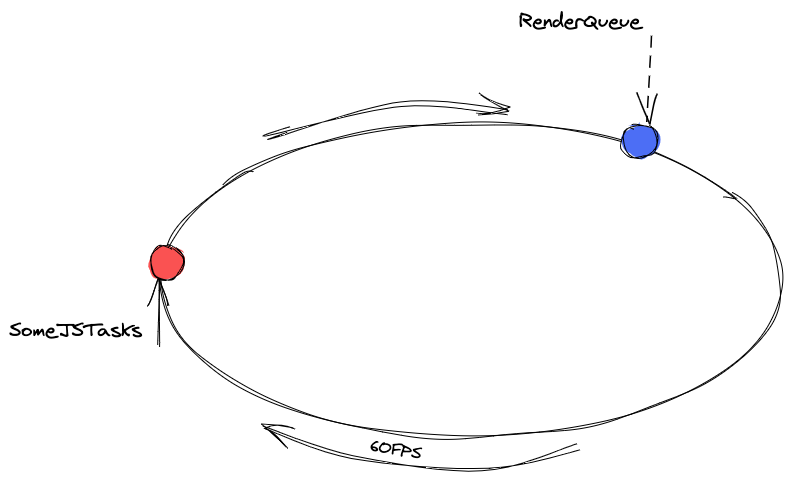
Now we have 2 sources for the tasks to execute for EventLoop. The first is the RenderQueue and the second one is "SomeJsTasks". Should the browser pick 1 task from the js tasks queue and then render the page? To answer the question let's take a look at the screen updating problem:
Screen updating
For browsers, the event loop is linked with frames, since EventLoop executes both JS code and renders the page. I'd suggest considering the frame as a single snapshot of the screen state, which a user sees in a moment.
✍️ Browsers are heading to show the updates on a page as quickly as possible, considering existing limits in hardware and software:
Hardware limits: Screen refresh rate
Software limits: OS settings, browser, and its settings, energy-saving settings, etc.
✍️ The vast majority of browsers / OS supports 60 FPS (Frames Per Second). Browsers try to update the screen at this particular rate.
When we use 60 FPS in the article it's better to keep in mind that we consider the most common frame rate and it could be changed in future
It means, that the browsers have timeslots of 16.6 ms (1000/60) for the tasks before they have to render a new frame (and rendering a new frame will also consume time).
Task queue and Micro Task Queue
Now it's time to decompose "SomeJsTasks" and to understand how it works.
Browsers use 2 queues to execute our code:
Task QueueorMacro Task Queueis dedicated to all events, postponed tasks, etc.Micro Task Queueis for promise callbacks: both resolved and rejected, and forMutationObserver. The single element from this queue is "Micro Task".
Now let's take a look at both of them:
Task queue
When the browser receives a new task, it puts the task into Task Queue. Each cycle Event Loop takes the task from the Task Queue and executes it. After the task is done, if the browser has time (the render queue has no tasks) Event Loop gets another task from Task Queue, and another task till the render queue receives a task to execute.
The first example:

We have 3 tasks: A, B, C. Event loop gets the first one and executes it. It takes 4 ms. Then the event loop checks other queues (Micro Task Queue and Render Queue). They are empty. Event Loop executes Task B. It takes 12 ms. In total two tasks use 16 ms. Then the browser adds tasks to Render Queue to draw a new frame. The event loop checks the render queue and starts the execution of tasks in the render queue. They take 1 ms approx. After these operations Event loop returns to TaskQueue and executes the last task C.
The event loop can't predict how much time a task will be executed. Furthermore, the event loop isn't able to pause the task to render the frame, as the browser engine doesn't know if it can draw changes from custom JS code or if it is some kind of preparation and not the final state. We just don't have an API for this.
✍️ During JS code execution all the changes which JS makes, won't be presented as a rendered frame to the user until the macro task and all pending micro-tasks are completed. However, JS code can calculate the DOM changes.
The second example:

We have only 2 tasks in the queue (A, B). The first task A takes 240ms. As 60FPS means that each frame should be rendered every 16.6ms, the browser loses approximately 14 frames. When task A ends the event loop executes tasks from the render queue to draw the new frame. Important note: Even though we lost 14 frames it doesn't mean we will render 15 frames in a row. It will be a single frame.
Before reviewing Micro Task Queue, let's talk about the call stack.
Call Stack
✍️ The call stack is a list that shows which functions with arguments are currently being called and where the transition will take place when the current function finishes the execution.
Let's look at the example:
function findJinny() {
  debugger;
  console.log('Dialog with Jinny');
}

function goToTheCave() {
  findJinny();
}

function becomeAPrince() {
  goToTheCave();
}

function findAFriend() {
   // ¯\_(ツ)_/¯
}

function startDndGame() {
  const friends = [];
  while (friends.length < 2) {
    friends.push(findAFriend());
  }
  becomeAPrince();
}
console.log(startDndGame());
This code will be paused on the debugger instruction.
We start our stack from inline code: console.log(startDndGame()); . it is the start of the call stack. Generally, chrome points out the reference to this line. Let's mark it as inline. Then we go down to the startDndGame function and findAFriend is called several times. This function wouldn't be presented in the call stack as it is ended before we get to the debugger. That's how the call stack looks like when we stop at debugger:
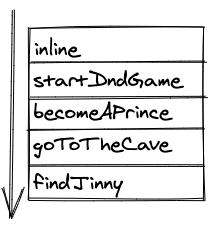
✍️When the call stack gets empty, the current task is done.
What are microtasks?
There are only 2 possible sources of micro tasks: Promise callbacks (onResolved/onRejected) and MutationObserver callbacks.
Microtasks have one main feature which makes them completely different:
✍️The microtask will be executed as soon as the call stack becomes empty.
Microtasks can create other microtasks which will be executed when the call stack ends. Each new microtask postpones the execution of a new macro task or the new frame rendering.
Let's check the example, where We have 4 microtasks in the micro task queue:

The first micro task to execute is A. A takes 200ms, and we have tasks in render queue. However, they will be postponed because we still have 3 more tasks in micro task queue. It means that after A Event loop takes micro task B, C and finally D. When the micro task queue gets empty, the event loop renders a new frame. In the example these 4 microtasks take 0.5 seconds to complete. All this time the browser UI was blocked and non-interactive.
✍️ Subsequent micro-tasks can block the website UI and make the page non-interactive.
This micro-task feature could be both advantage and a disadvantage. For example, when MutationObserver calls its callback as per DOM changes, the user won't see the changes on the page before the callback completes. Thereby, we can effectively manage the content which the user sees.
The updated event loop schema:
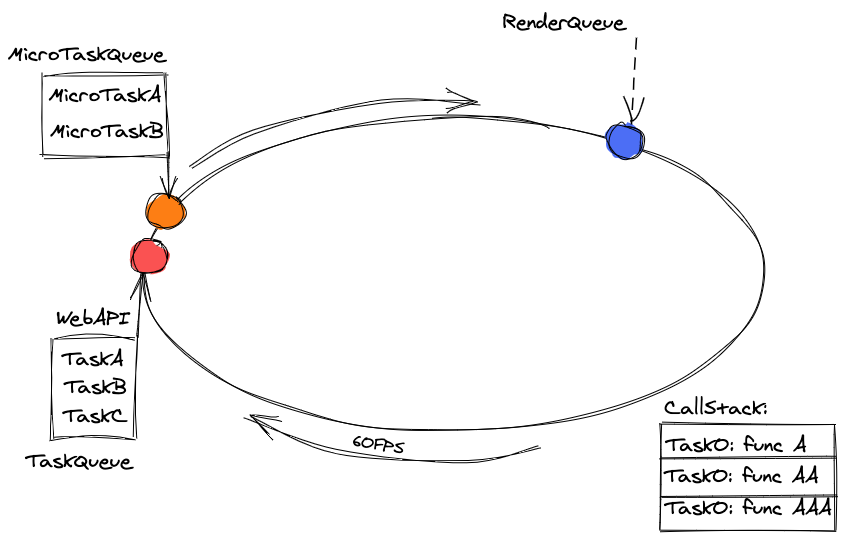
What is executed inside the render queue?
Frame rendering is not a single operation. Frame rendering has several stages. Each stage can be divided into substages. Here is the base schema of how a new frame gets rendered:

Let's dwell on each stage in more detail:
Request Animation Frame (RAF)

The browser is ready to start rendering, we can subscribe to it and calculate or prepare the frame for the animation step. This callback suits well for working with animations or planning some changes in DOM right before the frame gets rendered.
✍️ Some interesting facts about RAF:
RAF's callback has an argument
DOMHighResTimeStampwhich is the number of milliseconds passed since "time origin" which is the start of the document's lifetime. You may not need to useperformance.now()inside the callback, you already have it;RAF returns a descriptor (id), hence you can cancel RAF callback using cancelAnimationFrame. (like setTimeout);
If a user changes the tab or minimized the browser, you won't have a re-render which means you won't have RAF either;
JS code that changes the size of the elements or reads element properties may force requestAnimationFrame;
Safari call(ed) RAF after frame rendered. This is the only browser with different behavior. https://github.com/whatwg/html/issues/2569#issuecomment-332150901
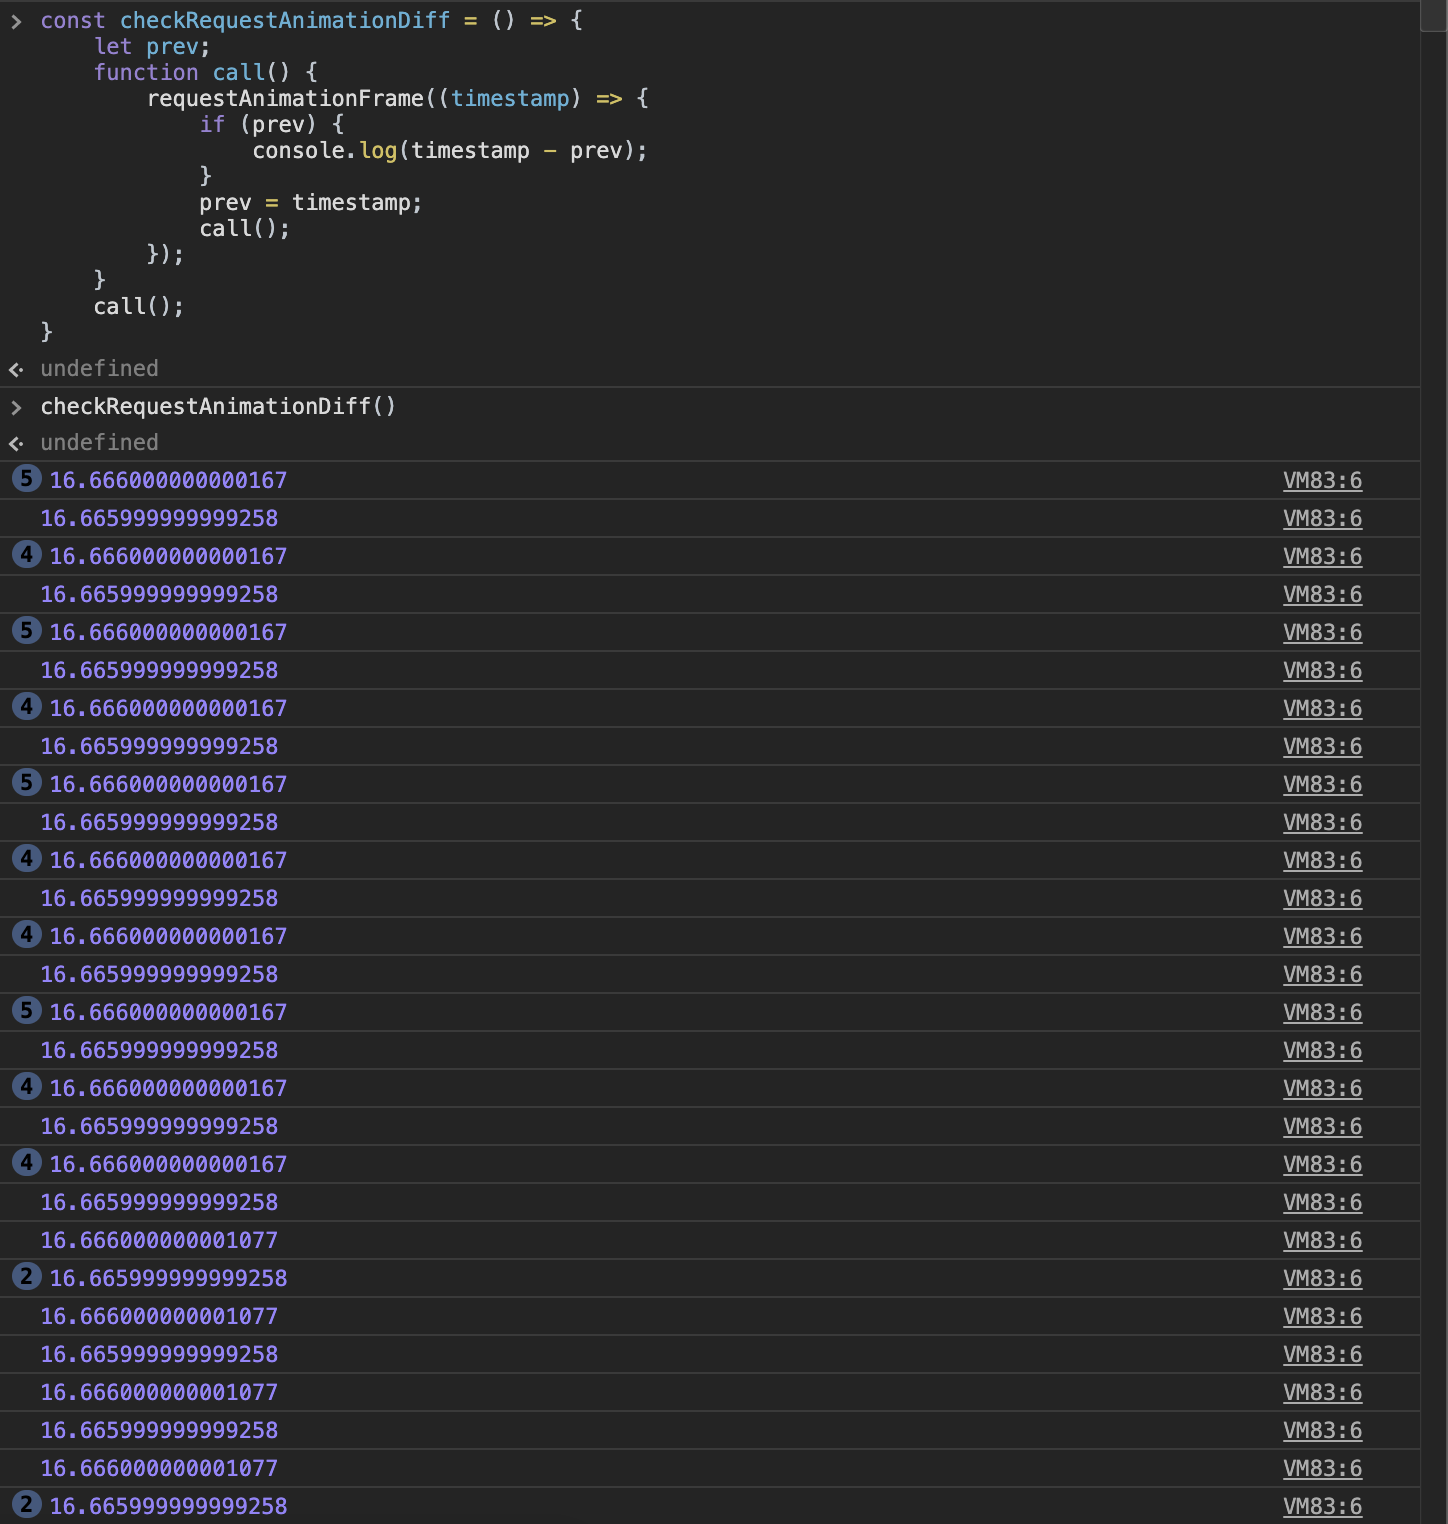
How to check how often the browser renders frames? This code would help:
const checkRequestAnimationDiff = () => {
    let prev;
    function call() {
        requestAnimationFrame((timestamp) => {
            if (prev) {
                console.log(timestamp - prev);
                // It should be around 16.6 ms for 60FPS
            }
            prev = timestamp;
            call();
        });
    }
    call();
}
checkRequestAnimationDiff();
Here is the usage example:
Style (recalculation)

✍️The browser recalculates styles that should be applied. This step also calculates which media queries will be active.
The recalculations include both direct changes a.styles.left = '10px' and those described through CSS files, such as element.classList.add('my-styles-class') They will all be recalculated in terms of CSSOM and Render tree production.
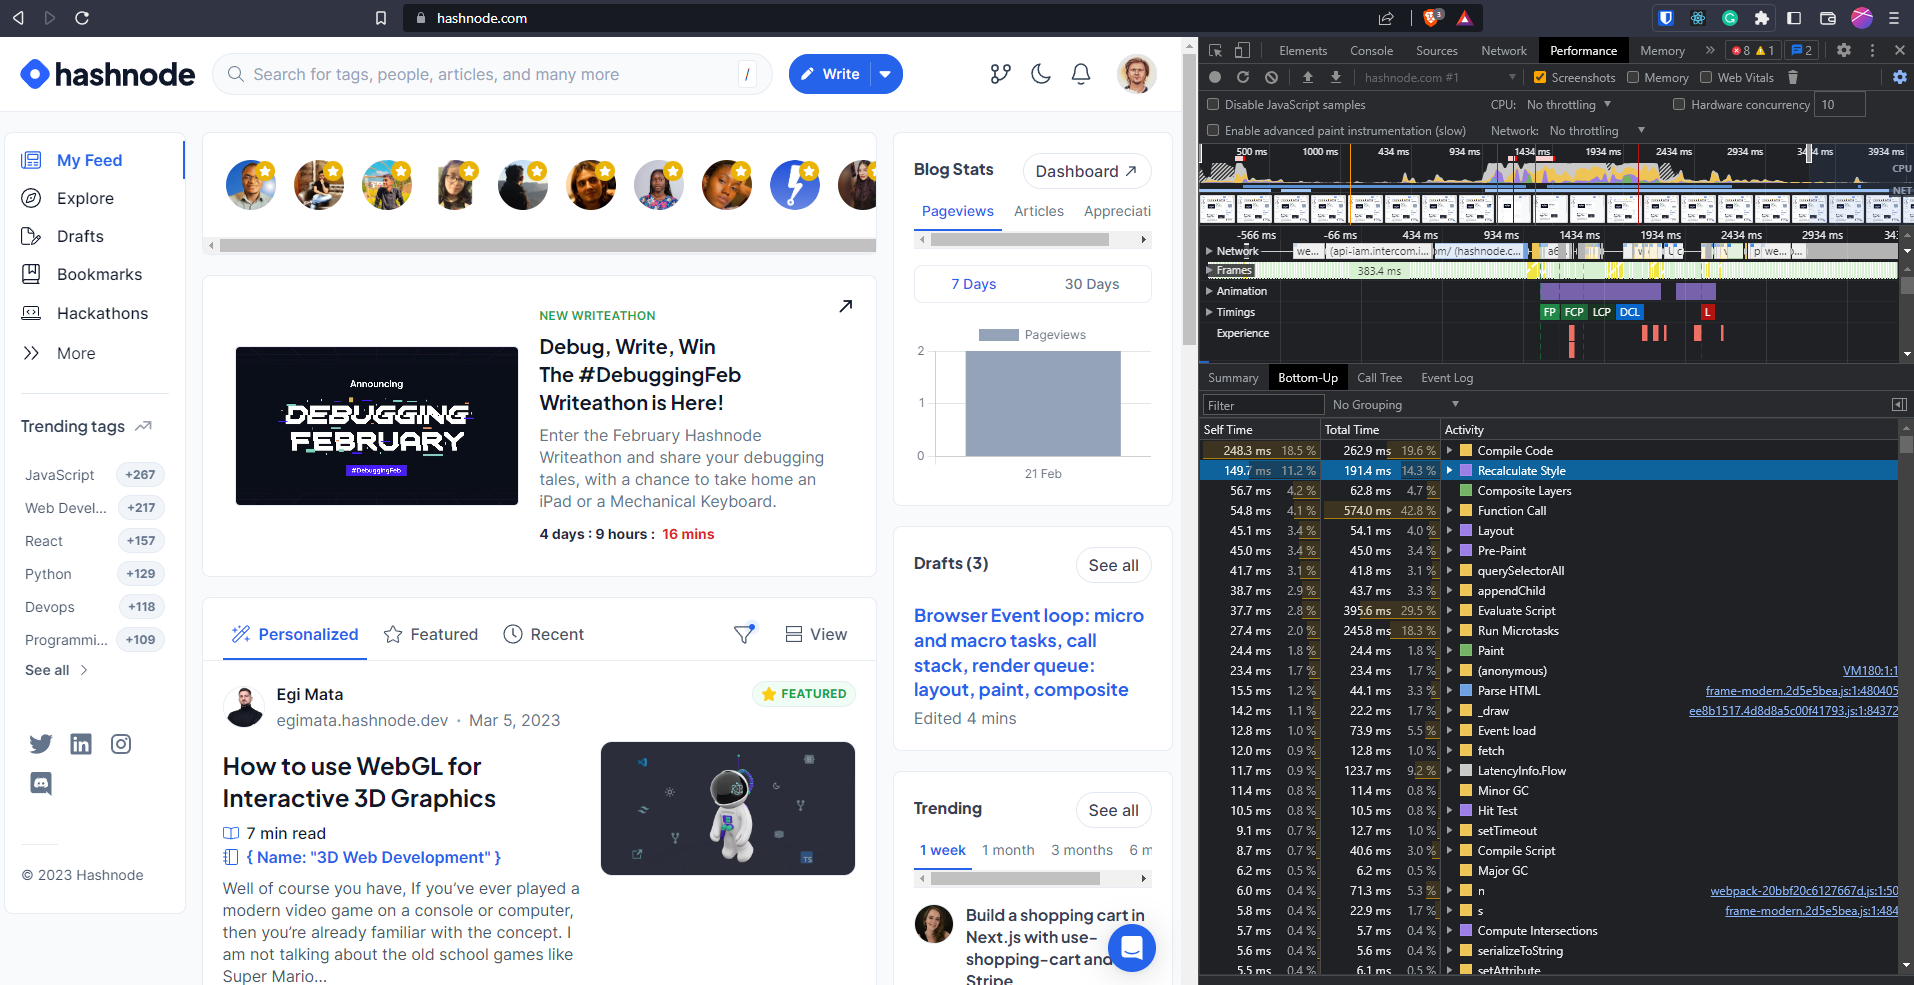
If you run the profiler and open the hashnode.com website, this is where you can find the time spent on Style:
Layout
✍️Calculating layers, element positions, their size, and their mutual influence on each other. The more DOM elements on the page the harder the operation is.
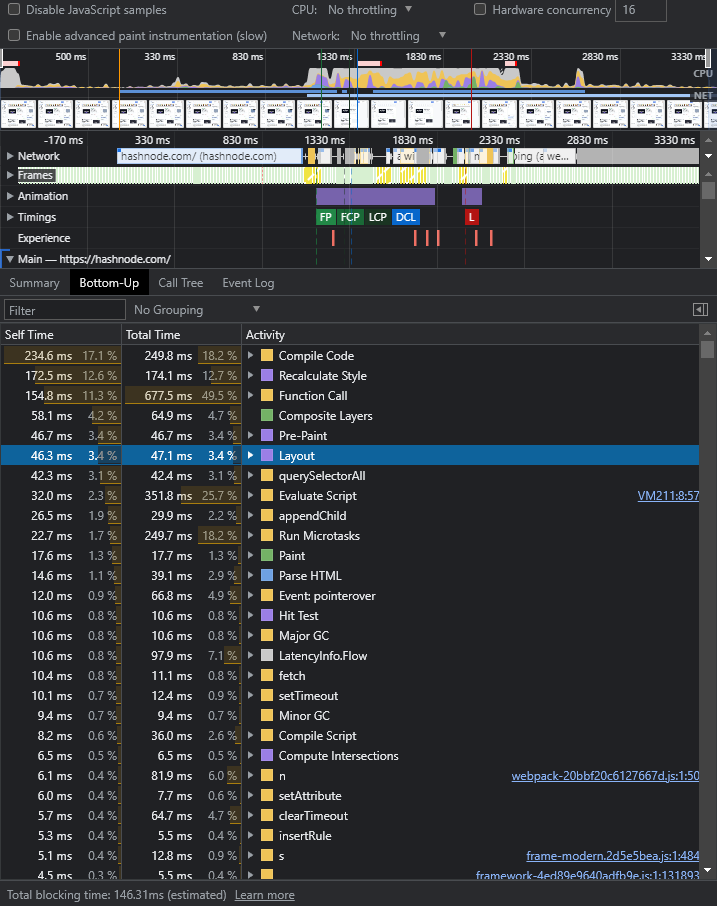
Layout is quite a painful operation for modern websites. Layout happens every time when you:
Read properties associated with the size and position of the element (
offsetWidth,offsetLeft,getBoundingClientRect, etc.)Write properties associated with the size and position of the elements except some of them (like
transformandwill-change).transformoperates incompositionprocess.will-changewould signal to the browser, that changing the property should be calculated incompositionstage. Here you can check the actual list of the reasons for that: https://source.chromium.org/chromium/chromium/src/+/master:third_party/blink/renderer/core/paint/compositing/compositing_reason_finder.cc;l=39
Layout is in charge of:
Calculating layouts
Elements interposition on the layer
✍️ Layout (with or without RAF or style) can be executed when js has resized elements or read properties. This process is called force layout The full list of properties that forces Layout: https://gist.github.com/paulirish/5d52fb081b3570c81e3a.
✍️ When layout is forced, browser paused JS main thread despite the call stack isn't empty.
Let's check it on the example:
div1.style.height = "200px"; // Change element size
var height1 = div1.clientHeight; // Read property
Browser cannot calculate clientHeight of our div1 without recalculating its real size. In this case, the browser paused JS execution and runs: Style to check what should be changed, and Layout to recalculate sizes. Layout calculates not only elements that are placed before our div1, but after as well. Modern browsers optimize calculation so that you won't recalculate the whole dom tree each time, but we still have it in bad cases. The process of recalculation is called Layout Shift. You can check it on the screenshot and see that you have the list of the elements which will be modified and shifted during layout:
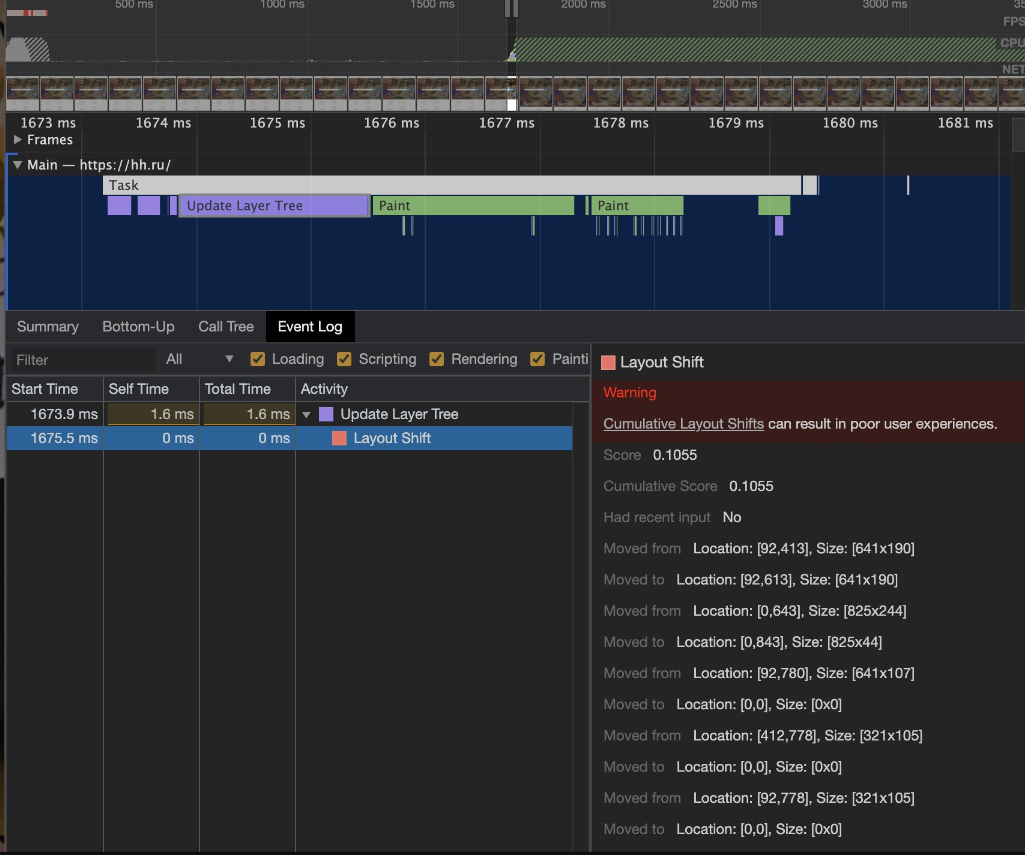
Browsers try not to force layout each time. So they group operations:
div1.style.height = "200px";
var height1 = div1.clientHeight; // <-- layout 1
div2.style.margin = "300px";
var height2 = div2.clientHeight; // <-- layout 2
On the first line browser plans height changed.
On the second line, browser receives a request to read the property. As we have pending height changes, browser has to force layout.
The same situation we have on 3rd + 4th lines. To make it better for browsers we can group read and write operations:
div1.style.height = "200px";
div2.style.margin = "300px";
var height1 = div1.clientHeight; // <-- layout 1
var height2 = div2.clientHeight;
By grouping elements, we get rid of the second layout, because when browser reaches the 4th line it already has all the data.
Our event loop mutates from only one loop to several as we can force layout on both tasks and microtask stages:

Some advice on how to optimize layout:
Reduce the DOM nodes number
Group read \ write operations to get rid of unnecessary layouts
Replace operations that force layout with operations that force composite
Paint

✍️ We have the element, its position on a viewport, and its size. Now we have to apply color, background that is to say to "draw" it
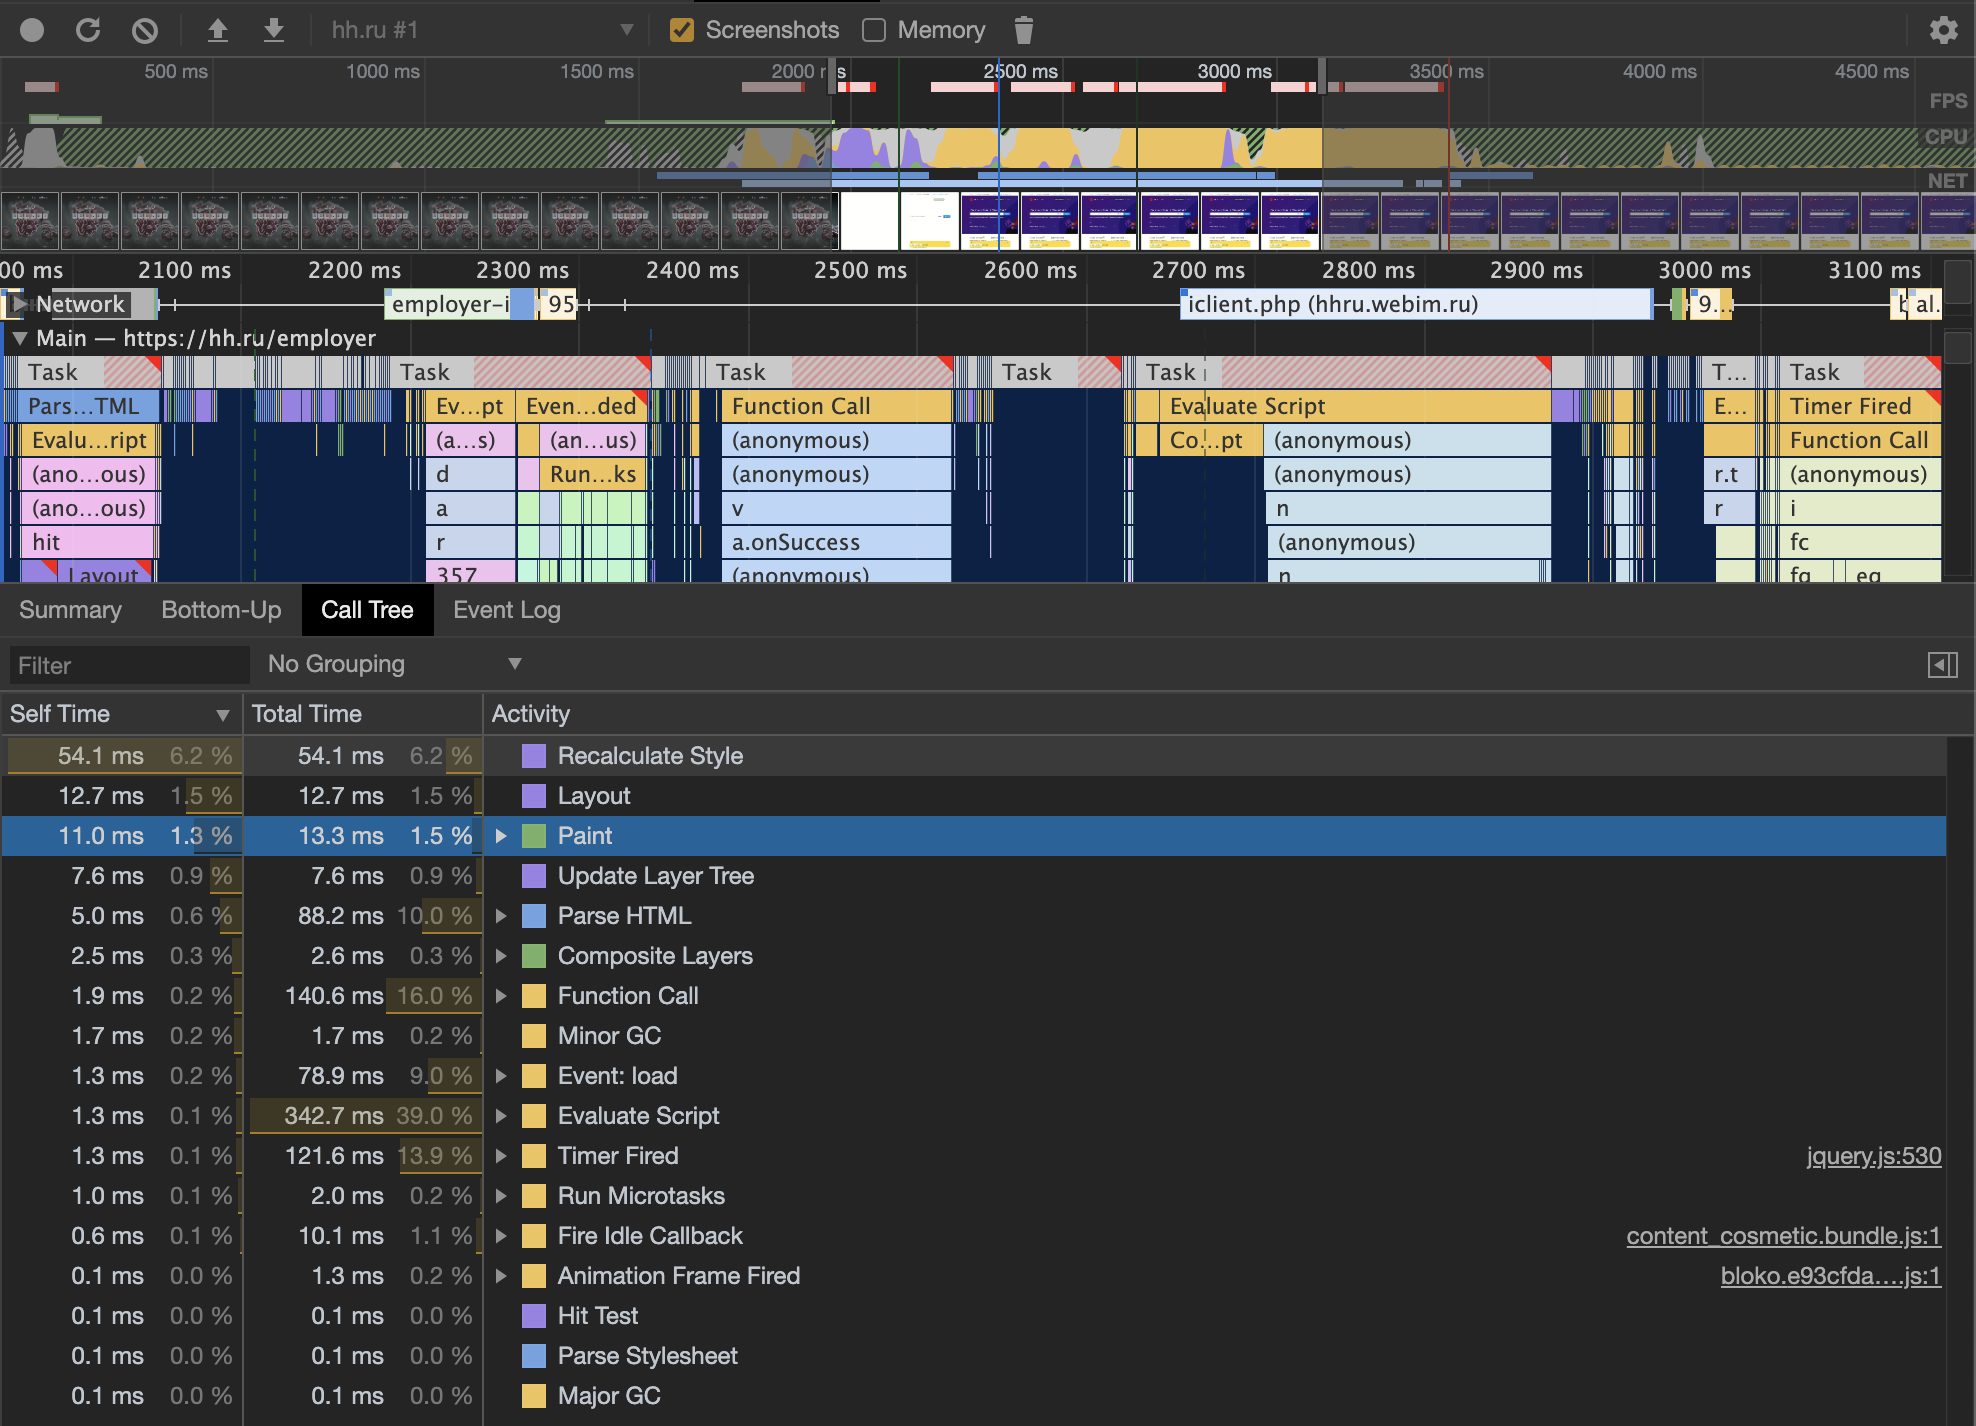
This operation usually doesn't consume lots of time, however, it may be big during the first render. After this step, we are able to "physically" draw the frame. The latest operation is "Composition".
Composition

✍️ Composition is the only stage that runs on GPU by default. In this step browser executes only specific CSS styles like "transform".
Important note: transform: translate doesn't "turn on" the render on a GPU. So, if you have transform: translateZ(0) in your codebase to move the render on a GPU, it doesn't work in such a way. It's a misconception.
Modern browsers can move part of the operation to the GPU on their own. I didn't find the up-to-date list for that, so it's better to check in source code: https://source.chromium.org/chromium/chromium/src/+/master:third_party/blink/renderer/core/paint/compositing/compositing_reason_finder.cc;l=39
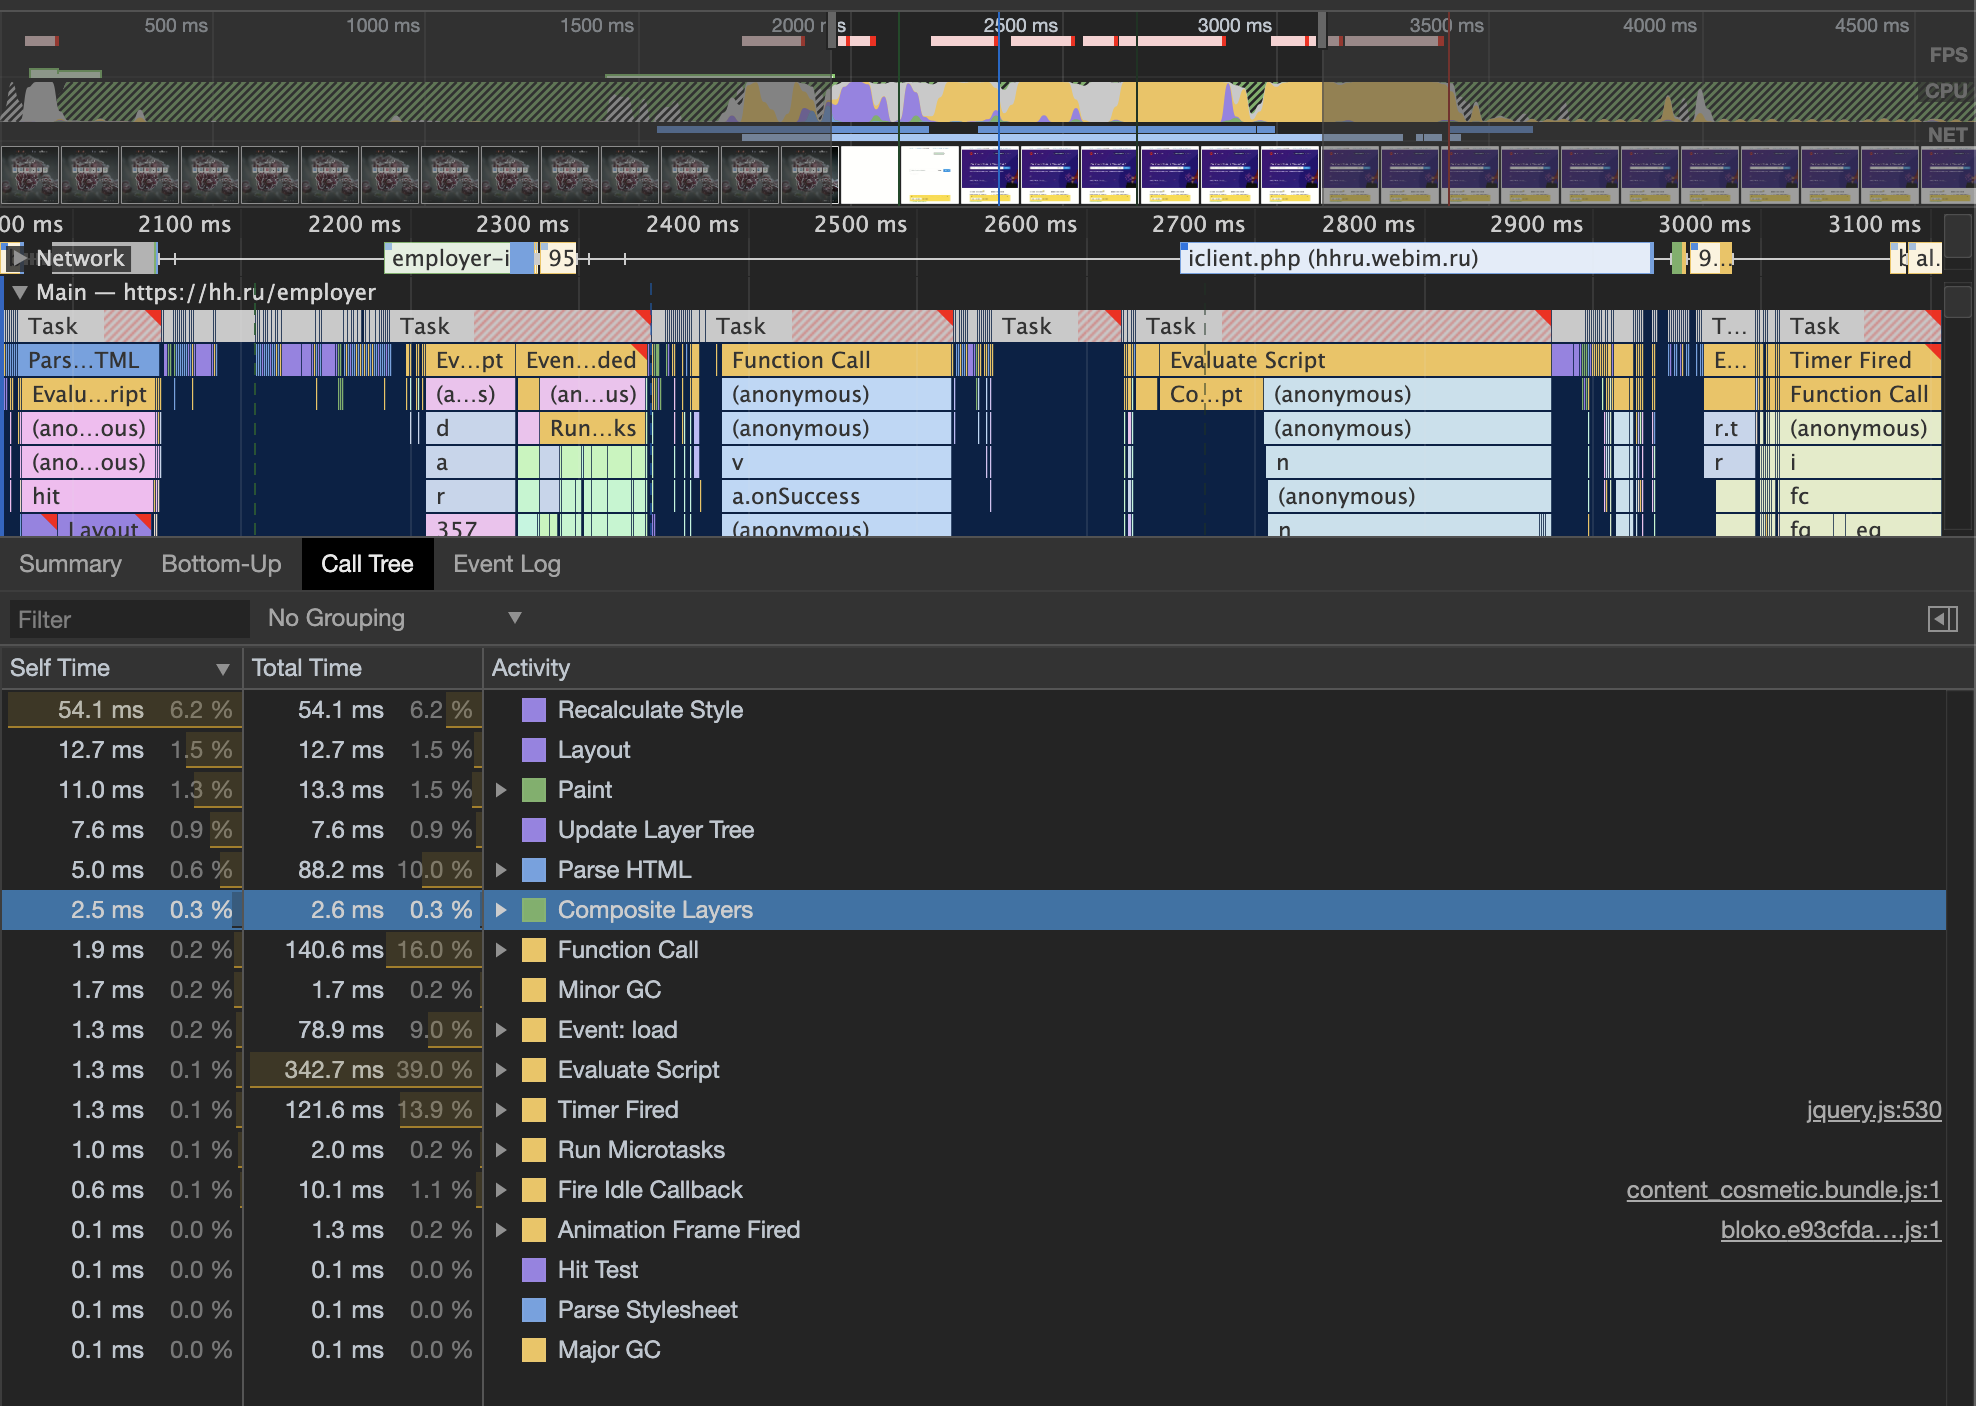
✍️ transform is the best choice for complex animations:
We don't force layout each frame, we save CPU time
These animations a free from artifacts ("soap"): small lags which you may follow when website has animations implemented through top, right, bottom, left.
How to optimize render?
✍️ The most difficult operation for frame rendering is the layout. When you have a complex animation, each render may require shifting all the DOM elements that are ineffective, as you'd spend 13-20ms (or even more). You will lose frames and hence, your website performance.
To improve the performance you can skip some of the rendering stages:

✍️ We may skip the layout phase if we change colours, background image, etc.

✍️ We can drop layout and paint when we use transform and we don't read properties from our DOM elements. You may cache them and store them in the memory.
✍️ Summing up, here are some advice:
Move animations from JS to CSS. Running additional JS code is not "for free"
Animate
transformfor "moving" objectsUse
will-changeproperty. It allows browsers to "prepare" DOM elements for the property mutations. This property just helps browsers to see, that developer is about to change it. https://developer.mozilla.org/en-US/docs/Web/CSS/will-changeUse batch changes for DOM
Use requestAnimationFrame to plan changes in the next frame
Combine read \ write element CSS properties operations, and use memoization.
Pay attention to properties that force layout: https://gist.github.com/paulirish/5d52fb081b3570c81e3a
When you have a non-trivial situation it's better to run the profiler and check frequency and timings. It gives you the data that phase is slow.
Optimize step-by-step, do not try to do everything at once.
How does Event Loop look like in the end:

If we open https://github.com/w3c/longtasks/blob/loaf-explainer/loaf-explainer.md#the-current-situation we can see the code which represents modern browsers Event Loop:
while (true) {
    const taskStartTime = performance.now();
    // It's unspecified where UI events fit in. Should each have their own task?
    const task = eventQueue.pop();
    if (task)
        task.run();
    if (performance.now() - taskStartTime > 50)
        reportLongTask();

    if (!hasRenderingOpportunity())
        continue;

    invokeAnimationFrameCallbacks();
    while (needsStyleAndLayout()) {
        styleAndLayout();
        invokeResizeObservers();
    }
    markPaintTiming();
    render();
}
Subscribe to my newsletter
Read articles from Nik directly inside your inbox. Subscribe to the newsletter, and don't miss out.
Written by

Nik
Nik
Software engineer @Meta, WhatsApp, building secure, e2ee messaging experience for users. ex-HH.ru ex-Program committee member HolyJS conference