Debugging Code With GDB and Valgrind
 Bill Van Leeuwen
For this project, I followed the GDB instructions from Bootlin and used Valgrind on one of my programs from my High-Performance Computing class.
Intro to GDB and Valgrind
GDB
GDB is a full-featured and open-source debugger. It is integrated into VSCode and given a very pretty front end.
It is possible to remote debug with VSCode and GDB, but often many embedded development environments run it in its natural form on the terminal.
Valgrind
Valgrind opposed to GDB is a runtime tool. It analyses the stack, heap and disassembly of the program to primarily find and report memory leaks.
It can be used for much more, including cache usage and miss reports, deadlocks and race conditions, and heap memory usage.
GDB
Packages
I had to enable some settings in the buildroot menu for GDB to be present and working on the board:
BR2_PACKAGE_HOST_GDB, in Toolchain | Build cross gdb for the host
BR2_PACKAGE_GDB, in Target packages | Debugging, profiling and benchmark | gdb
BR2_PACKAGE_GDB_SERVER, in Target packages | Debugging, profiling and benchmark | gdbserver
BR2_ENABLE_DEBUG, in Build options | build packages with debugging symbols
- This one specifically builds the included C libraries with debugging symbols.
Running the Code
In order to connect to the board, and run gdb remotely, we need to run this command on the board:
gdbserver --multi :2000 ./linked_list
Which outputs:
Process ./linked_list created; pid = 168
Listening on port 2000
and then start gdb on our pc
gdb
Which when running, looks like:
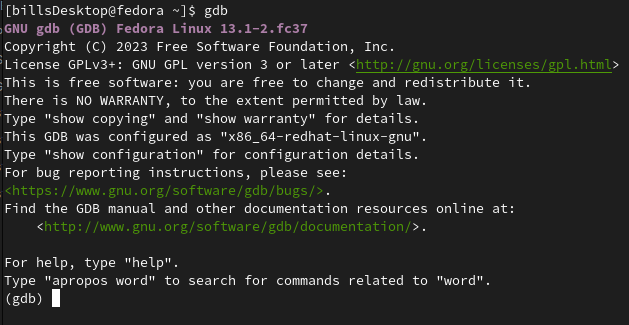
To connect to the board we need to run:
target extended-remote 192.168.1.100:2000
Where the IP address is that of the board, and the port 2000, is what we told GDB to use.
Compiling and Placing On board
We should compile this program using the cross-compiler provided by buildroot. It is found in output/host/bin/arm-none-linux-gnueabihf-gcc and we can add this to our PATH to make it easier and faster to compile our programs.
We need to do this because buildroot doesn't include a compiler when it builds the images. It is intended for final products mostly.
We can compile on our machine and sftp it over with:
sftp root@192.168.1.100
Debugging
The most basic commands for GDB are:
run- starts the execution of the program being debugged.break- sets a breakpoint at a specified location in the program.step- executes the current line and stops at the next line in the source code.next- executes the current line and stops at the next line, but does not enter function calls.continue- resumes execution until the next breakpoint or until the program terminates.print- prints the value of a specified variable or expression.backtraceorbt- prints the stack trace of the program at the current point of execution.list- displays the source code around the current point of execution.info- displays various types of information about the program being debugged, such as registers, breakpoints, and threads.quit- exits GDB.
we can use this to trace along our program like in vscode
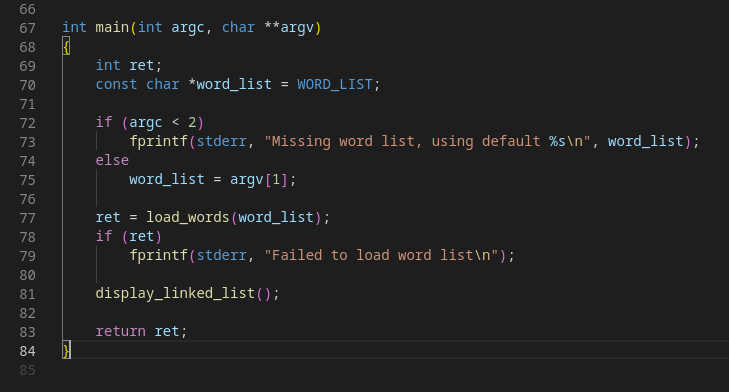
I'll set a breakpoint at the 'main' function with b main

and run the program, stepping with next

You can see that this follows along the code file that we have:
GDB also has a nice Text-User-Interface, or TUI that you can enter with Ctrl-X-A
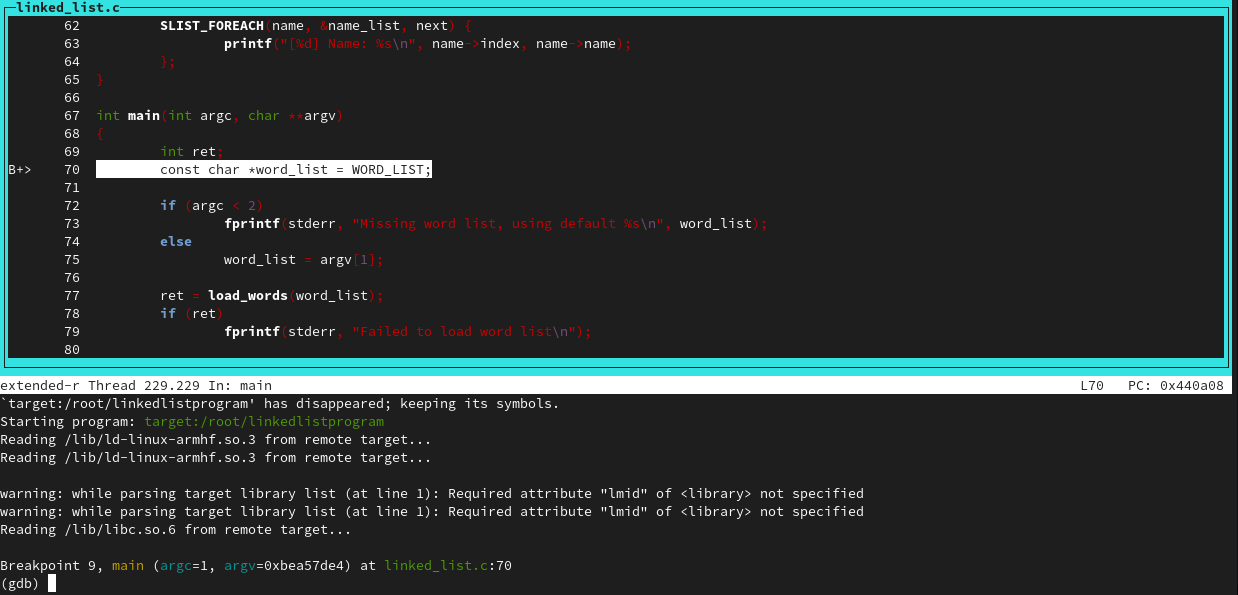
Let's try out a few of these commands:
We can set breakpoints with 'b' and see them with the info command:
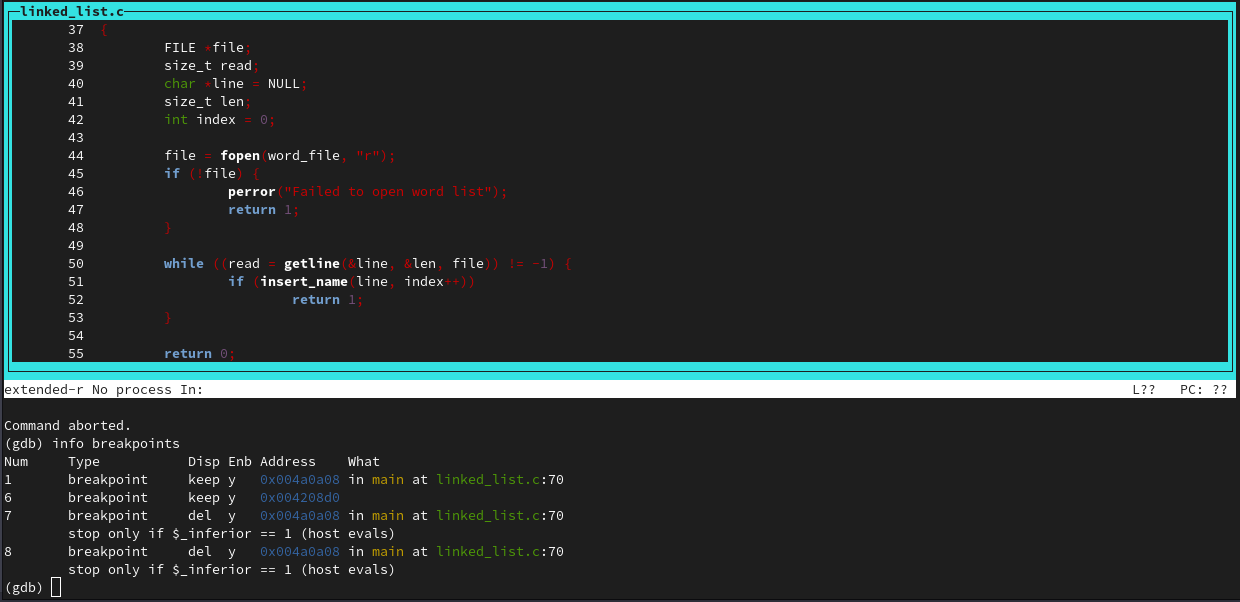
And delete them with 'delete'
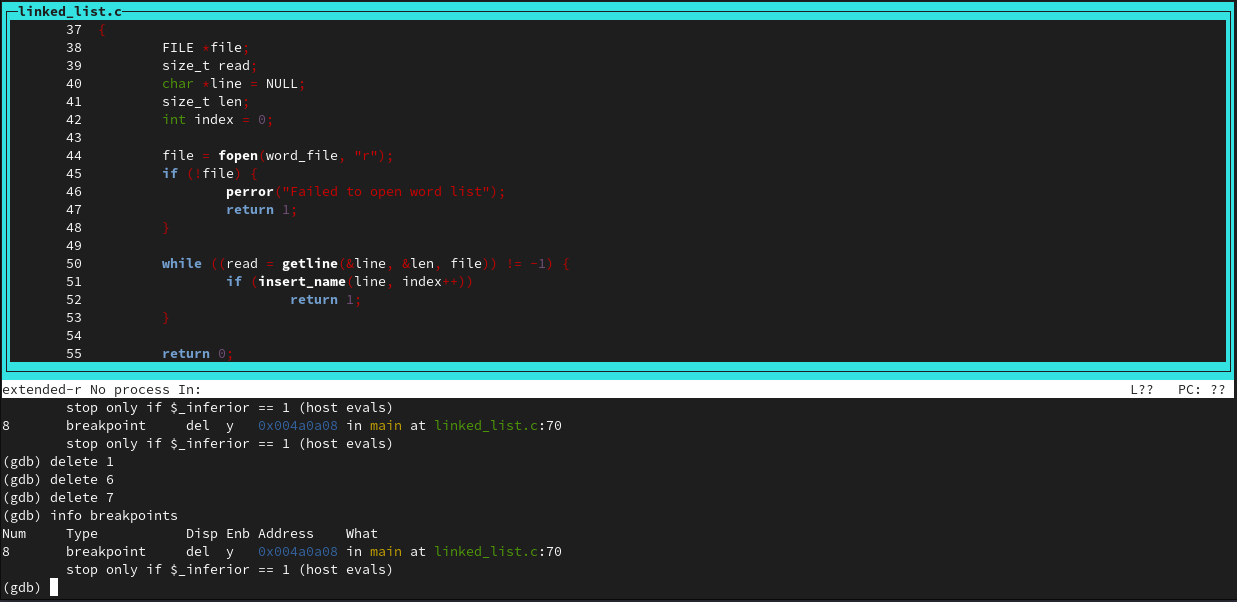
There are many more commands, and gdb is one of those tools that can take time to master. This was just a simple lab, however.
Valgrind
I ran valgrind on a program I wrote in High-Performance Computing. This was a hastily poorly written program with little care for memory cleanup so I knew it would be leaky.
There isn't much to it. You can see output from valgrind with a summary of any memory leaks by running:
valgrind --leak-check=full ./program
Below is what is outputted (concatenated because it's super long):
==7144== Memcheck, a memory error detector

==7144== Copyright (C) 2002-2022, and GNU GPL'd, by Julian Seward et al.

==7144== Using Valgrind-3.20.0 and LibVEX; rerun with -h for copyright info

==7144== Command: mpirun -np 4 ./halo

==7144==

...

==7144==

==7144== LEAK SUMMARY:

==7144== definitely lost: 6,705 bytes in 24 blocks

==7144== indirectly lost: 31,491 bytes in 465 blocks

==7144== possibly lost: 0 bytes in 0 blocks

==7144== still reachable: 829 bytes in 21 blocks

==7144== suppressed: 0 bytes in 0 blocks

==7144== Reachable blocks (those to which a pointer was found) are not shown.

==7144== To see them, rerun with: --leak-check=full --show-leak-kinds=all

==7144==

==7144== For lists of detected and suppressed errors, rerun with: -s

==7144== ERROR SUMMARY: 21 errors from 21 contexts (suppressed: 0 from 0)
As you can see, there are quite a few leaks in this program. It's run with MPI, and I didn't take into great consideration the cleaning up of the memory.
Subscribe to my newsletter
Read articles from Bill Van Leeuwen directly inside your inbox. Subscribe to the newsletter, and don't miss out.
Written by
