Scorecards vs. Dashboards: Which Should Your Organization Use?
 Ragavan Angamuthu
For a continuously profitable business, companies should always keep track of KPIs and metrics using their business data. Making the right decisions drives an organization to success, and using business intelligence analytics tools enables evidence-based decision-making.
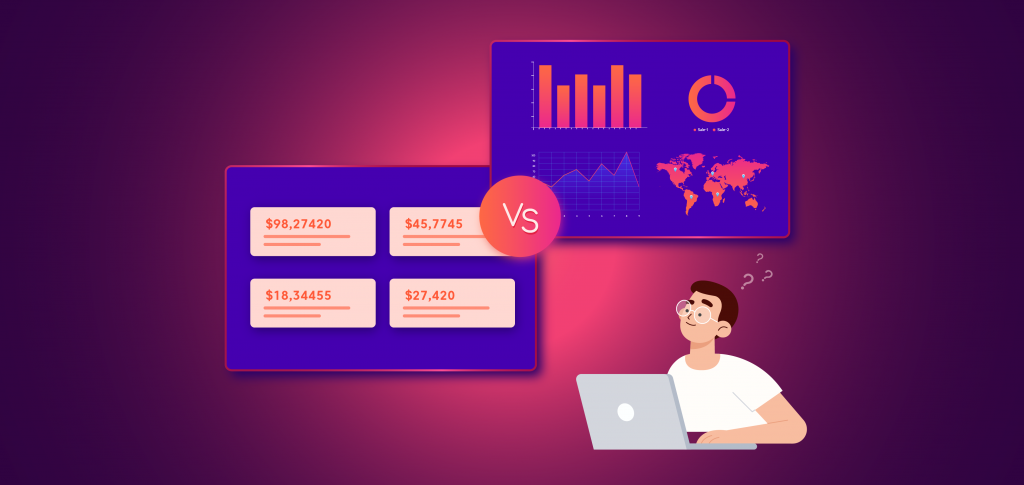
There are many meaningful ways to monitor organization metrics and data with BI tools. Two options are scorecards and dashboards. A scorecard shows the progress of your business based on current indicators and values compared to predefined goals. A dashboard shows a wide variety of KPIs and metrics from real-time data.
Most organizations use both scorecards and dashboards as business intelligence reporting tools. In this blog, I am going to discuss the benefits of scorecards and dashboards, when each should be used, and how an organization can better focus its strategy and actions by using scorecards and dashboards. Let’s get started.
What is a scorecard?
A scorecard is a report that shows the current activity of the organization in comparison to planned goals or outcomes. Using KPIs, you can monitor business progress by comparing current values and statuses against defined targets. You can further define goals and strategies for your organization by plotting the trajectory of the KPIs with future defined targets.
Benefits of using scorecards
You can track progress toward predefined goals and continuously improve business strategies.
You can accurately monitor business results using KPIs to revise business performance goals.
When to use scorecards
Suppose you have a sales target for the next fiscal year. You can use a scorecard where you define KPIs and update them periodically, such as monthly or quarterly. This allows you to focus on your long-term goal by comparing it to the current sales number. If you’re not making adequate progress, the scorecard will make it apparent, empowering you to take necessary actions to achieve the long-term sales goal.
In the manufacturing or fabrication industry, you can use a scorecard to measure the amount of waste generated periodically to improve production practices.
What is a dashboard?
A dashboard is a set of reports showing different KPIs and metrics derived from business data in real time. Dashboards help a business’s decision-makers understand their data to drive effective business processes and explore new business opportunities through the proper data visualizations.
Benefits of using dashboards
Dashboards help monitor business performance with real-time data so that quick actions can be taken to remedy ineffective processes.
Dashboards help view and compare current metrics against historical data to ensure the business is healthy.
When to use dashboards
Suppose an IT team manager plans to monitor call center KPIs to evaluate team performance and improve business productivity. A dashboard would work great in this scenario since it displays real-time metrics, providing a clear picture of the call center’s capabilities and shortcomings.
If a manufacturer needs to monitor output and product defects in comparison with real-time business data, a dashboard can provide various metrics to help identify inefficiently produced items.
Scorecards vs. dashboards: Which should an organization choose?
While both scorecards and dashboards are useful for measuring the performance of your business, scorecards help monitor strategic goals whereas dashboards help monitor operational goals.
Scorecards show how close KPI values are to targets, while dashboards show a variety of KPIs where real-time data is monitored along with historical data to review daily targets. While a scorecard is used to monitor a single targeted value, a dashboard helps you monitor more values. For example, with a dashboard, you can monitor 6 months of historical data, 5 years of historical data, month-to-month data, week-to-week data, and any other way you could want to compare historical data with the present.
When it comes to implementing dashboards or scorecards, what’s most important is an organization must clearly define and understand its business goals. Sometimes, combining both scorecards and dashboards is the best option for tracking business KPIs because it helps decision-makers form consistent, reasoned strategies for the organization. Maintaining focus in any type of business delivers profit and success.
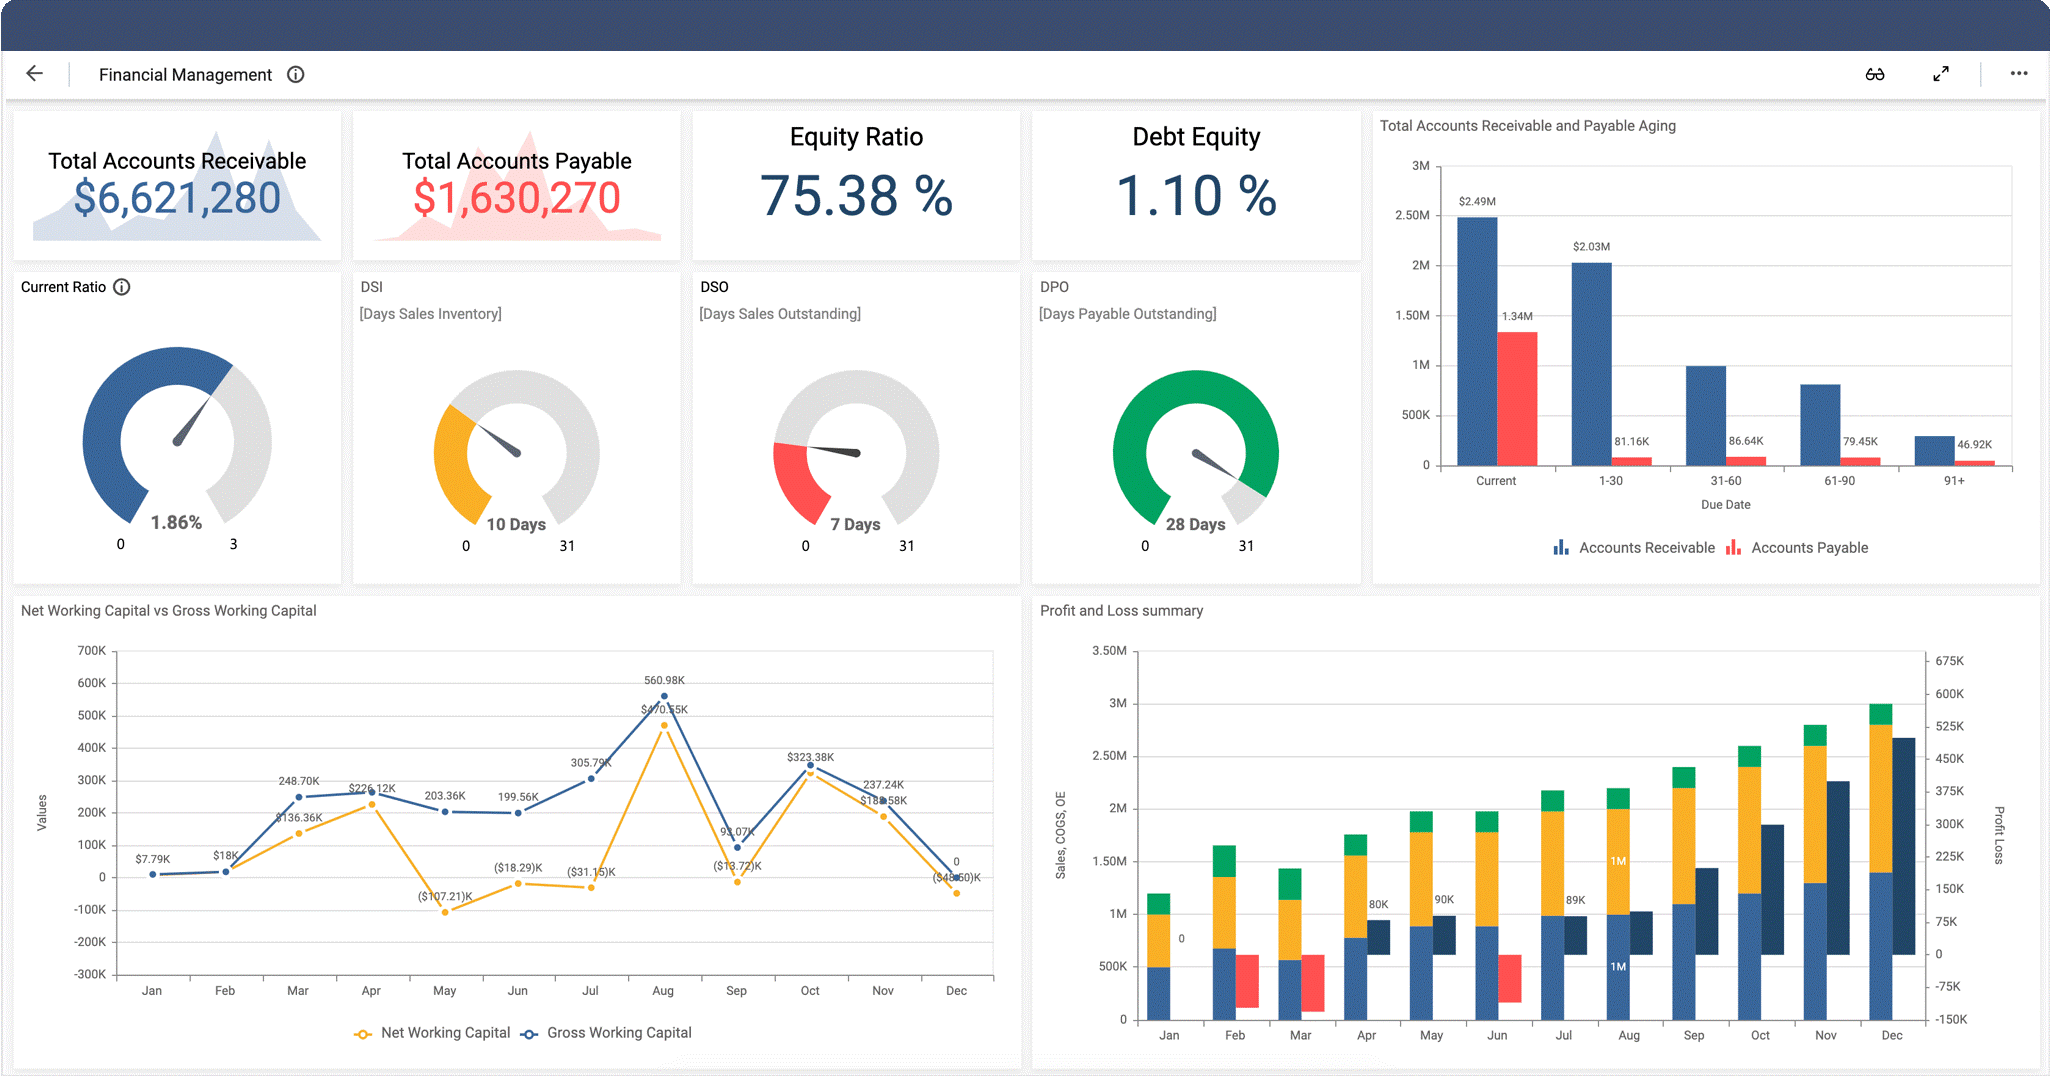
Let’s look at an example of combining dashboards and scorecards. Consider scorecards used to monitor a company’s financial status through KPIs and metrics defined for accounts received amount, account payable amount, equity ratio, and debt equity.

Finance KPIs Using Scorecards
The business could further focus its financial metrics with continuous real-time data by refreshing the reports periodically. This would help reveal patterns hidden in the data and empower the company’s CEO or CFO to make effective decisions. The following figure is an example of combining scorecards and dashboards to monitor financial management, historical revenue data, company’s critical financial metrics, and other important metrics.

Monitor Financial Performance Using a Dashboard
You can check out our live Financial Performance Dashboard that showcases scorecards in a dashboard using Bold BI. From there, you can find more dashboard examples with live demos for various business domains using Bold BI.
Conclusion
We hope this article helped you learn about scorecards and dashboards, their benefits, when to use them, and how they can be used to help an organization focus on its strategy for a healthy and successful business.
To get started creating dashboards to monitor your business and inform your strategies, check out our business intelligence dashboard software, Bold BI. If you have any questions on this blog, please feel free to post them in the following comment section. Get started with Bold BI by signing up for a free 15-day trial and create more interactive business intelligence dashboards. You can also contact us by submitting your questions through the Bold BI website or, if you already have an account, you can log in to submit your support question.
Subscribe to my newsletter
Read articles from Ragavan Angamuthu directly inside your inbox. Subscribe to the newsletter, and don't miss out.
Written by

Ragavan Angamuthu
Ragavan Angamuthu
As a passionate writer and tech enthusiast, I explore the human side of technology, capturing both the challenges and triumphs. Here, you’ll find heartfelt stories of personal growth alongside in-depth analyses of the latest tech trends. Each post is crafted with care, blending emotion with expertise, to offer a unique perspective that resonates on multiple levels. Whether you're here for inspiration or innovation, my goal is to connect, inform, and inspire through the power of words and technology. Join me on this journey of discovery and connection. Together, we'll navigate the wonderland of words, exploring, learning, and, above all, enjoying every moment. The adventure begins now—stay tuned for what's next!