Excel Automation with Pandas
 Steve Jose
Table of contents

“Why do manual work when you can automate?”
— Some Guy
Pandas is a quite useful for automation. This is coming from someone who doesn’t understand coding. So you can probably guess, how easy it would be to learn this.
Photo by Sid Balachandran on Unsplash
Oops!!!. Wrong image…

Photo by Hitesh Choudhary on Unsplash
This image should do…
I have a good excel background and used to spend countless hours just to generate reports for my executive management. One weekend while I was browsing, the Almighty YouTube algorithm took me to this video by Derrick Sherril. That was an eye opener for me to a pandora of excel automation tricks which I could use in my daily life.
Since then I have been binge watching Derrick Sherril, Tech with Tim and many more tutorials.
These are some the useful formulas which I used for my excel automation

Photo by Author on Canva
Vlookup: Vlookup is one of the most overused function in excel, there are new variants of excel like Index(Match), Xlookup and other formulas which you can combine to make Vlookup more efficient.
Vlookup can be used in Pandas in the following manner.
import pandas as pd #importing pandas
df_sbm = pd.read_excel('Agent_list.xlsx',sheet_name='RM Data') #loading data
After importing pandas and loading your excel, run the following command(pd.merge) to do vlookup.
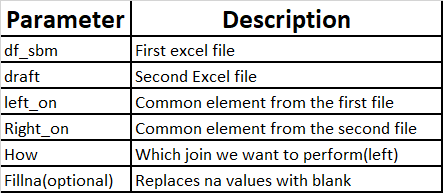
final_draft = pd.merge(df_sbm, draft, left_on = 'Console Name', right_on = 'rm', how = 'left').fillna('') #vlookup

Description
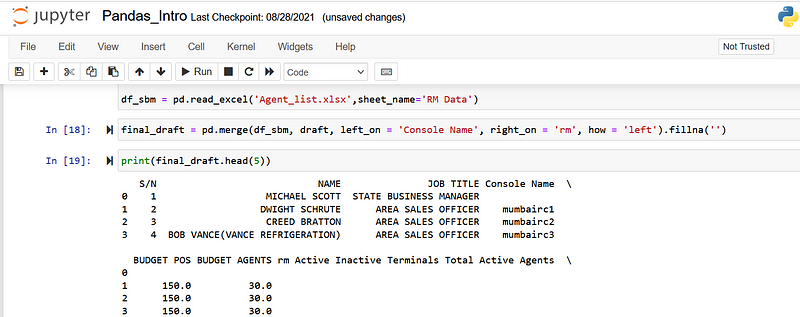
You can do print to check your final output as given below

Final Output
Unlike excel, in pandas it joins both the table with that value so some filtering would be required to keep only values from one table.
It is achieved with the help of (.loc) method from pandas as given below. With the help of this method, we can select only those columns which we would require in our table.
draft = final_draftt.loc[:, ['rm', 'Active', 'Inactive Terminals', 'Total', 'Active Agents', 'Inactive Agents', 'Total Agents', 'pay_amt (SUM)', 'deposit (SUM)', 'Disbursment (SUM)', 'Net Sell (SUM)', 'Total Balance']]
Countifs: Countifs is another such formula which is used if you are into MIS analysis in excel. It is mainly used to sum the values based on category.
Countifs can be used in Pandas in following manner.
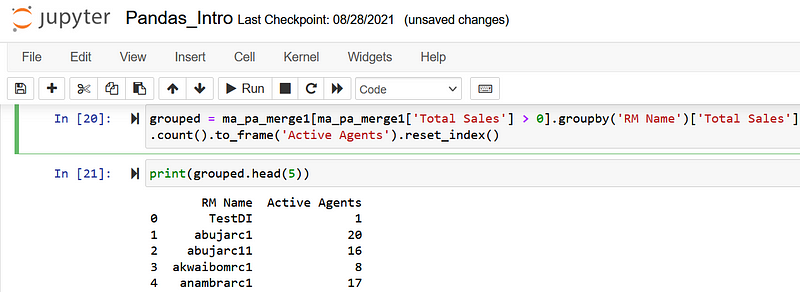
grouped = ma_pa_merge1[ma_pa_merge1['Total Sales'] > 0].groupby('RM Name')['Total Sales'].count().to_frame('Active Agents').reset_index()
In the above example, I am trying to get the total count of all RM where sales > 0 and putting the output in a dataframe called “Active Agents”

Final Output
Sumifs : Sumifs is used to aggregate values based on condition, unlike countifs where it counts value based on condition
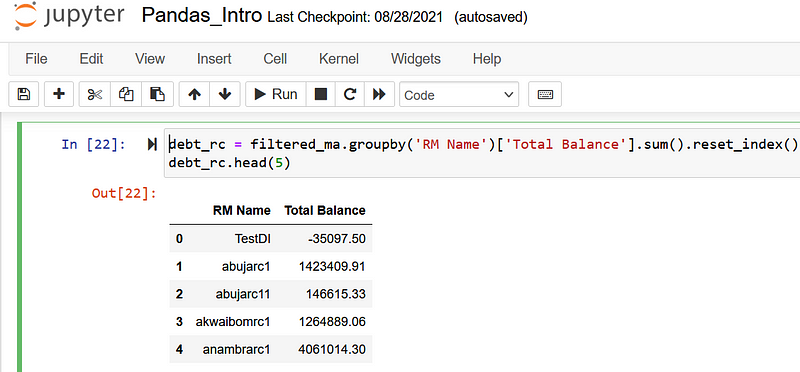
debt_rc = filtered_ma.groupby('RM Name')['Total Balance'].sum().reset_index()
In the above example, I am using groupby function to get the unique RM Names and aggregating their balance in Total Balance column.

Final Output
We have been able to understand few of the comprehensive pandas functions which can be substituted for Excel.
Thanks for reading... Stay Purposeful!!!
Subscribe to my newsletter
Read articles from Steve Jose directly inside your inbox. Subscribe to the newsletter, and don't miss out.
Written by
