Monitoring EKS using Prometheus and Grafana
 Yogitha K
What is Prometheus
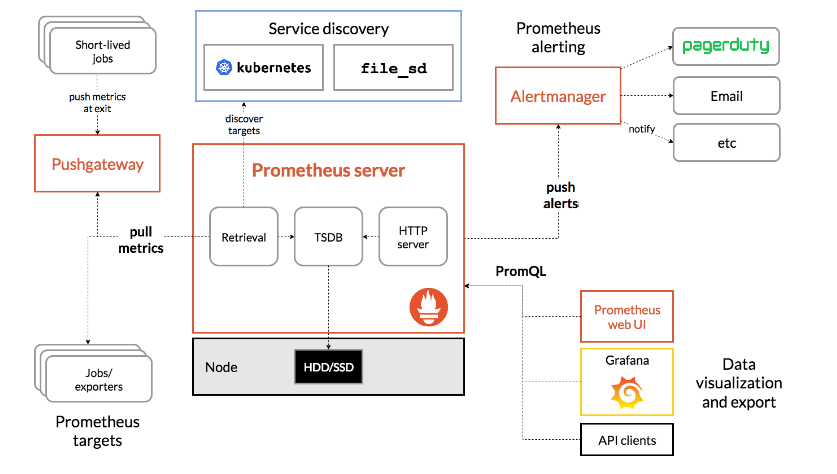
Prometheus is open-source software that collects metrics from targets by "scraping" metrics HTTP endpoints.
Supported "targets" include infrastructure platforms (e.g. Kubernetes), applications, and services (e.g. database management systems). Together with its companion Alertmanager service, Prometheus is a flexible metrics collection and alerting tool.
I would like to highlight a few important points on Prometheus
Metric Collection: Prometheus uses the pull model to retrieve metrics over HTTP. There is an option to push metrics to Prometheus using Pushgateway for use cases where Prometheus cannot Scrape the metrics. One such example is collecting custom metrics from short-lived Kubernetes jobs & Cronjobs
Metric Endpoint: The systems that you want to monitor using Prometheus should expose the metrics on an /metrics endpoint. Prometheus uses this endpoint to pull the metrics in regular intervals.
PromQL: Prometheus comes with PromQL, a very flexible query language that can be used to query the metrics in the Prometheus dashboard. Also, the PromQL query will be used by Prometheus UI and Grafana to visualize metrics.
Prometheus Exporters: Exporters are libraries that convert existing metrics from third-party apps to Prometheus metrics format. There are many official and community Prometheus exporters. One example is, the Prometheus node exporter. It exposes all Linux system-level metrics in Prometheus format.
TSDB (time series database): Prometheus uses TSDB for storing all the data efficiently. By default, all the data gets stored locally. However, to avoid a single point of failure, there are options to integrate remote storage for Prometheus TSDB.

Source: Prometheus.io
Resources
Follow this document to install Prometheus in EKS cluster
https://docs.aws.amazon.com/eks/latest/userguide/prometheus.html
https://dev.to/aws-builders/monitoring-eks-cluster-with-prometheus-and-grafana-1kpb
https://docs.aws.amazon.com/eks/latest/userguide/ebs-csi.html
https://dev.to/aws-builders/monitoring-eks-cluster-with-prometheus-and-grafana-1kpb
Steps to install Prometheus
kubectl create namespace Prometheus
helm repo add prometheus-community https://prometheus-community.github.io/helm-charts
helm upgrade -i prometheus prometheus-community/prometheus
--namespace prometheus
--set alertmanager.persistentVolume.storageClass="gp2",server.persistentVolume.storageClass="gp2"
kubectl get pods -n prometheus
Use kubectl to port forward the Prometheus console to your local machine.
kubectl --namespace=prometheus port-forward deploy/prometheus-server 9090
aws-ebs-csi-driver
Prometheus and Grafana need persistent storage attached to them, which is also called PV(Persistent Volume) in terms of Kubernetes.
For stateful workloads to use Amazon EBS volumes as PV, we have to add aws-ebs-csi-driver into the cluster.
Add "ebs-csi-driver" add-on. The cluster couldn't create persistent volume and persistent volume claims by default.
Associating IAM role to Service account
Before we add aws-ebs-csi-driver, we first need to create an IAM role, and associate it with Kubernetes service account.
Let's use an example policy file, which you can download using the command below.
curl -sSL -o ebs-csi-policy.json https://raw.githubusercontent.com/kubernetes-sigs/aws-ebs-csi-driver/master/docs/example-iam-policy.json
Now let's create a new IAM policy with that file.
export EBS_CSI_POLICY_NAME=AmazonEBSCSIPolicy
aws iam create-policy \
--region $AWS_REGION \
--policy-name $EBS_CSI_POLICY_NAME \
--policy-document file://ebs-csi-policy.json
export EBS_CSI_POLICY_ARN=$(aws --region ap-northeast-2 iam list-policies --query 'Policies[?PolicyName==`'$EBS_CSI_POLICY_NAME'`].Arn' --output text)
echo $EBS_CSI_POLICY_ARN
# arn:aws:iam::12345678:policy/AmazonEBSCSIPolicy
After that, let's attach the new policy to Kubernetes service account.
eksctl create iamserviceaccount \
  --cluster $EKS_CLUSTER_NAME \
  --name ebs-csi-controller-irsa \
  --namespace kube-system \
  --attach-policy-arn $EBS_CSI_POLICY_ARN \
  --override-existing-serviceaccounts --approve
And now, we're ready to install aws-ebs-csi-driver!
Installing aws-ebs-csi-driver
Assuming that helm is installed, let's add new helm repository as below.
helm repo add aws-ebs-csi-driver https://kubernetes-sigs.github.io/aws-ebs-csi-driver
helm repo update
After adding new helm repository, let's install aws-ebs-csi-driver with below command using helm.
helm upgrade --install aws-ebs-csi-driver \
  --version=1.2.4 \
  --namespace kube-system \
  --set serviceAccount.controller.create=false \
  --set serviceAccount.snapshot.create=false \
  --set enableVolumeScheduling=true \
  --set enableVolumeResizing=true \
  --set enableVolumeSnapshot=true \
  --set serviceAccount.snapshot.name=ebs-csi-controller-irsa \
  --set serviceAccount.controller.name=ebs-csi-controller-irsa \
  aws-ebs-csi-driver/aws-ebs-csi-driver
The following will be created as part of Prometheus installation on EKS
A Kubernetes namespace for Prometheus.
Node-exporter DaemonSet with a pod to monitor Amazon EKS nodes.
Pushgateway deployment with a pod to push metrics from short-lived jobs to intermediary jobs that Prometheus can scrape.
Kube-state-metrics DaemonSet with a pod to monitor the Kubernetes API server.
Server StatefulSet with a pod and attached persistent volume (PV) to scrape and store time-series data. The pod uses persistent volume claims (PVCs) to request PV resources.
Alertmanager StatefulSet with a pod and attached PV for deduplication, grouping, and routing of alerts.
Amazon Elastic Block Storage (Amazon EBS) General Purpose SSD (gp2) storage volume.
Install Grafana
helm install grafana grafana/grafana --namespace grafana --set persistence.storageClassName="gp2" --set persistence.enabled=true --set adminPassword='EKS' --values ./grafana.yaml --set service.type=LoadBalancer
You can access Prometheus UI at <http://localhost:9090
We already have deployed the Grafana as a Load Balancer service in our EKS cluster. So to access Grafana's UI, you can run the following command:
$ kubectl get svc -n grafana
Before exposing Grafana to the world, let's see how the Kubernetes service running Grafana is defined.

We can see that the target port is 3000, which is the port used by pods running Grafana.
So we have to attach a new Security group to EC2 worker nodes, allowing inbound requests for port 3000.
We can do this by creating a new Security group, and attaching it to EC2 worker nodes in the EC2 console of AWS Management Console.
After applying new security group to EC2 worker nodes, let's define a new Kubernetes ingress, which will provision an ALB.
To make Kubernetes ingress to create an ALB, we have to install aws-load-balancer-controller first.
Let's see what ingress looks like.
apiVersion: networking.k8s.io/v1
kind: Ingress
metadata:
  name: grafana-ingress
  namespace: grafana
  annotations:
    alb.ingress.kubernetes.io/load-balancer-name: grafana-alb
    alb.ingress.kubernetes.io/scheme: internet-facing
    alb.ingress.kubernetes.io/target-type: ip
    alb.ingress.kubernetes.io/subnets: ${PUBLIC_SUBNET_IDs}
    alb.ingress.kubernetes.io/listen-ports: '[{"HTTPS": 443}]'
    alb.ingress.kubernetes.io/certificate-arn: ${ACM_CERT_ARN}
    alb.ingress.kubernetes.io/security-groups: ${ALB_SECURITY_GROUP_ID}
    alb.ingress.kubernetes.io/healthcheck-port: "3000"
    alb.ingress.kubernetes.io/healthcheck-path: /api/health
spec:
  ingressClassName: alb
  rules:
    - host: ${YOUR_ROUTE53_DOMAIN}
      http:
        paths:
          - path: /
            pathType: Prefix
            backend:
              service:
                name: grafana
                port:
                  number: 80
After applying new ingress and having new ALB ready, we can head over to ${YOUR_ROUTE53_DOMAIN}
Subscribe to my newsletter
Read articles from Yogitha K directly inside your inbox. Subscribe to the newsletter, and don't miss out.
Written by
