Probability For Mastering Data Science - Part 1
 Naymul Islam
Probability👇
We know that probability is one of the key concepts of Data Science. In this series, we are gonna cover all we need to know about the probability to become a Data Scientist or a Machine Learning Engineer. So, let’s deep dive into that.
What is Probability?👇
A probability is the likelihood of an event occurring.
So, before stepping into probability we have to know about the event
What is an event?👇
An event is a specific outcome or a combination of several outcomes.
So say for example you conduct an experiment by tossing a coin. The outcome of this experiment is the coin landing 'heads' or 'tails'.In that case ‘heads’ or ‘tails’ is an event.
Having a probability of one(1) expresses absolute certainty of the event occurring and a probability of zero(0) expresses absolute certainty of an event not occurring.
The formula of probability is following:

Where,
Event = A
Probability = P(A)
And by preferred, we mean outcomes that we want to see happen.
Similarly, sample space is a term used to depict all possible outcomes.
The probability of two independent events occurring at the same time is equal to the product of all the probabilities of the individual events. For example-

Expected Values👇
What are Expected Values?👇
Expected values represent what we expect the outcome to be. The definition of Expected Value is the average outcome we expect if we run an experiment many times.
Suppose you are playing a board game that uses a spinner to determine how many spaces a player will move forward on each turn. The probability is 1/2 that the player moves forward 1 space, and moving forward 2 or 3 spaces each has a probability of 1/4. The expected value for the number of spaces a player moves forward on a turn can be calculated as follows: (1/2) 1 + (1/4) 2 + (1/4) * 3 = 1.5 spaces.
What are Experimental Probabilities?👇
The probability we get after conducting an experiment is called experimental probability.
For example, imagine you conduct an experiment where you flip a coin 100 times. The theoretical probability of getting heads is 50%, and the theoretical probability of getting tails is also 50%. However, the actual outcome of your experiment may be different. For example, you may get 47 heads and 53 tails. In this case, the experimental probability of getting tails in 100 trials is 53%, and the experimental probability of getting heads in 100 trials is 47%.
Experimental probabilities have a good approximation and are easy to compute.
Calculating experimental probabilities:

If,
The expected value of an event = E(A)
Numbers of trials = n
Theoretical probabilities = P(A)
Then,

Calculating the expected value for numerical outcome:
If there are three(3) elements like A, B and C then the expected value of these are-

Frequency👇
What is Probability Frequency Distribution?👇
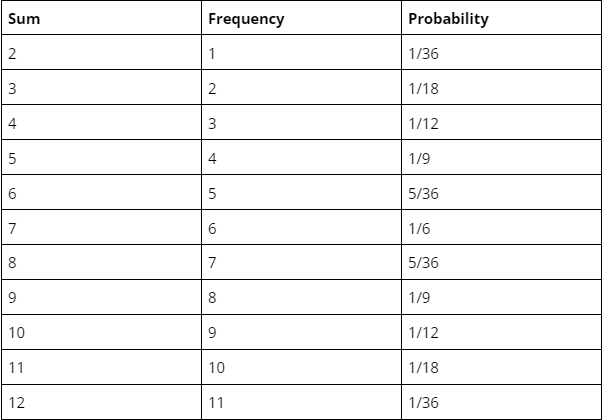
A probability frequency distribution is a collection of the probabilities for each possible outcome
Usually, probability frequency distribution expresses with a graph or a table.
A simple frequency distribution table of rolling a two six-sided die is the following-

We calculate probability through frequency by simply deciding the frequency for each possible outcome by the size of the sample space.
Event and their compliment👇
What is Compliment?👇
A compliment of an event is everything the event is not.
If,
An event = A
Then,

All the events have compliments and we denote the by apostrophe like the compliment of a is A’.
The sum of probabilities of all possible outcomes equals one(1) -

The probability of complement is -

Combinatorics👇
There are 3 integral parts of combinatorics-
Permutations
Variations
Combinations
1-Permutation: Permutation represents the number of different possible ways we can arrange a set of elements. These elements can be digits, letters, objects or even people.
Mathematically,


2-Variation with repetition: Variation expresses the total number of ways we can pick and arrange some elements of a given set.
The formula of variation with repetition-
If,
The total number of elements we have available = n
The number of positions we need to fill = p

2.1-Variation without repetition: The number of variations without repetition when arranging p elements out of a total of n.
Formula-

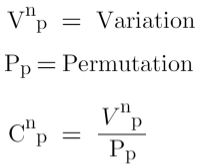
3-Combinations: Combinations represent the number of different ways we can pick certain elements of a set.
Variations don’t take into account double accounting elements. That is where combinations step in.
All the different permutations of a single combination are different.
Formula-

3.1-Symmetry of Combinations: Picking more elements leads to having fewer combinations.
We can pick p-many elements in as many ways as we can pick (n-p) many elements.
So,

If,

In that case, we apply symmetry to avoid calculating the factorial of large numbers
Generally, we use symmetry to simplify the calculation.
3.2-Solving Combinations with separate sample space: Calculating the total number of combinations is done by multiplying the number of options available for each individual event -

If we have a number of 4 people to pick out of 4, we rely on permutation
If we have 6 people and we need to pick 4 people then we have to rely on variation
If we only came about which 4 out of the 6 people made it into the team, we would be dealing with combinations.
If there is no repetition, there is a clear relationship between permutation, variation, combination -

Fromula’s changes over repetition-

Before we end…
Thank you for taking the time to read my posts and share your thoughts. If you like my blog please give a like, comment and share it with your circle and follow for more I look forward to continuing this journey with you.
Let’s connect and grow together. I look forward to getting to know you better.
Here are my social links below-
Linkedin: https://www.linkedin.com/in/ai-naymul/
Twitter: https://twitter.com/ai_naymul
Github: https://github.com/ai-naymul
Subscribe to my newsletter
Read articles from Naymul Islam directly inside your inbox. Subscribe to the newsletter, and don't miss out.
Written by

Naymul Islam
Naymul Islam
👉 I'm an ML Research 7 Open-Source Dev Intern at Menlo Park Lab. 👉 I'm a Machine Learning and MLOps Enthusiast. 👉 I’m One Of The Semi-Finalist Of The Biggest ICT Olympiad In Bangladesh Called “ICT Olympiad Bangladesh” In 2022. 👉 I've More Than 15 Google Cloud Badges. ⭐️ Wanna Know More About Me? Drop Me An Email At: naymul504@gmail.com ★