Data Cleaning and Imputation: Retaining Data Integrity with Missing Value Handling in Python
 Md Junayed Hossain
Libraries
import pandas as pd
Data Loading
df = pd.read_csv('features.csv')
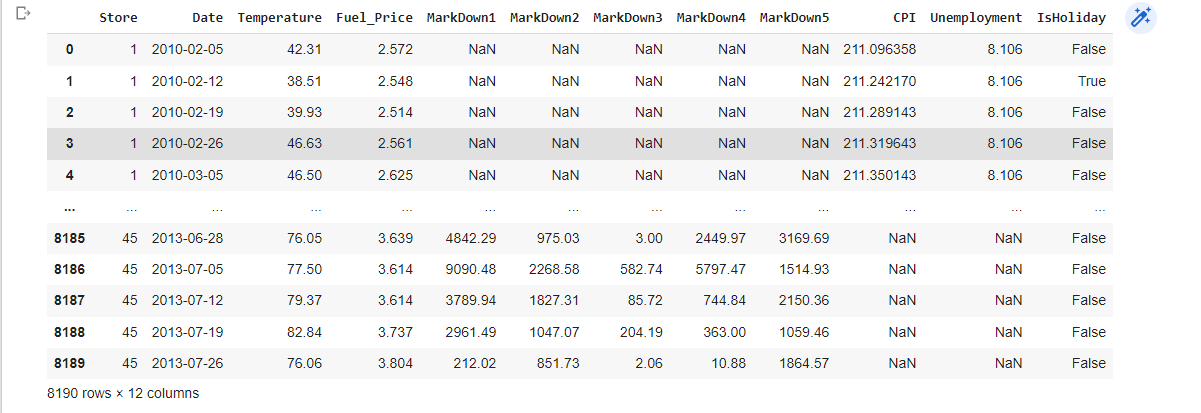
df

df.describe()

The describe() function in Pandas provides descriptive statistics of a DataFrame or Series. When applied to a DataFrame, it calculates and displays various statistical measures for each numerical column in the dataset.
NaN stands for "Not a Number." It is a special floating-point value used to represent missing or undefined values in numerical calculations. NaN is typically used in programming languages and mathematical computations to indicate the absence of a meaningful result or a value that cannot be represented numerically. It serves as a placeholder to indicate the presence of missing or invalid data. When performing calculations or operations involving NaN, the result is also NaN. NaN is commonly encountered when dealing with missing values, data cleaning, or performing mathematical operations that result in undefined values.
# Count the number of null values in each column
null_counts = df.isnull().sum()

# Print the null value counts
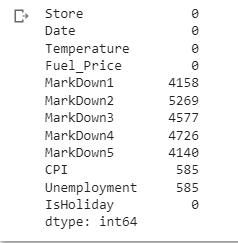
print(null_counts)

From MarkDown1 to Unemployment, there are quite a few Nan( Missing Values) in this case if we use dropna()()() function, we will lose an astronomical amount of data, thus In this example, we first load the data into pandas dataframe and then check for missing values using the isnull() method. We identify the columns with missing values and initialize the SimpleImputer from scikit-learn.
We specify the imputation strategy as 'mean', which replaces missing values with the mean value of the column. You can also use other strategies such as 'median', 'most_frequent', or custom imputation techniques.
We then apply the imputer to the selected columns using fit_transform(), which fills in the missing values with the mean value.
from sklearn.impute import SimpleImputer
# Initialize the imputer
imputer = SimpleImputer(strategy='mean')

# Define the columns with missing values
columns_with_missing_values = ['Temperature', 'Fuel_Price', 'MarkDown1', 'MarkDown2', 'MarkDown3', 'MarkDown4', 'MarkDown5', 'CPI', 'Unemployment']

# Impute missing values with the mean
df[columns_with_missing_values] = imputer.fit_transform(df[columns_with_missing_values])

# Save the imputed data to a new csv file
#df.to_csv('imputed_data.csv', index=False)

df
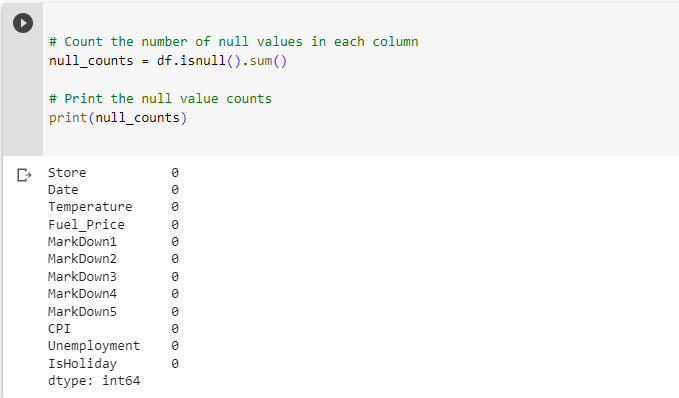
Now there are no Nan Values

df['Unemployment'] = df['Unemployment'].round(2)
df['Unemployment']
In this code, we use the round() function to round the values in the "Unemployment" column to two decimal places. The 2 inside the round() function indicates the number of decimal places to keep.
By assigning df['Unemployment'] to the rounded values, we update the "Unemployment" column in the DataFrame with the formatted values.
Finally, we print the updated DataFrame using print(df) to see the "Unemployment" column with values rounded to two decimal places.

# Remove any leading/trailing white spaces from string columns
df = df.apply(lambda x: x.str.strip() if x.dtype == "object" else x)
df
# Convert string date column to datetime
df['Date'] = pd.to_datetime(df['Date'], format='%Y-%m-%d')
df
# Replace non-numeric characters in the " Fuel price" column
df['Fuel_Price'] = df['Fuel_Price'].apply(lambda x: pd.to_numeric(str(x).replace('$', '').replace(',', '')))
df
# Add dollar sign to the "price" column
df['Fuel_Price'] = df['Fuel_Price'].apply(lambda x: '$' + str(x))
df

The project involved data cleaning and preprocessing of a dataset named 'features.csv'. The dataset had missing values, which were addressed using various techniques. Initially, it was observed that the dataset had a high percentage (80%) of missing values. Instead of dropping the rows with missing values, an imputation technique was applied to retain the data. The missing values in the dataset were filled using the forward-fill method provided by the fillna() function in Pandas. This approach filled the missing values with the most recent non-null value in the column.
Additionally, the "Unemployment" column was formatted to display values with two decimal places using the round() function. This ensured consistent precision in the representation of the unemployment values.
Overall, the project focused on handling missing values in a dataset, specifically addressing the case where dropping the rows with missing values would lead to significant data loss. By employing the imputation technique and formatting the "Unemployment" column, the dataset was effectively cleaned and prepared for further analysis and modeling tasks.
Subscribe to my newsletter
Read articles from Md Junayed Hossain directly inside your inbox. Subscribe to the newsletter, and don't miss out.
Written by

Md Junayed Hossain
Md Junayed Hossain
I am a passionate and motivated data analyst with a master’s degree in financial technology and a bachelor’s degree in computer science and engineering. I have over two years of experience in finance and customer service, as well as various academic and professional projects that demonstrate my skills and knowledge in data analysis, data visualization, machine learning, web development, and financial reporting. I am proficient in Python, SQL, Tableau, Power BI, Excel, and other tools and languages for data science. I am also a team player, a leader, and a lifelong learner who is always eager to take on new challenges and solve complex problems with data. I am currently looking for opportunities to apply my skills and passion for data analysis in the fintech industry.