Evaluate Survey Analysis Results through Embedded Analytics
 Ragavan Angamuthu
Introduction
Over the past decade, the dynamics of business methods have changed. Instead of just manufacturing a product and selling it on the market now, many businessmen are keen to learn ahead of time what customers want from their products. Companies also want to form more accurate expectations about who needs their products in order to customize the products for those customers. Surveys help them rectify the issue of getting customer feedback. Surveys play a key role in every department, giving insight into customer needs, satisfaction, retention, and more.
Embedded analytics helps you visualize the data from all the surveys in your software applications. You can easily evaluate the survey analysis results in the application you usually work with and then implement any changes needed your product. In this blog post, I am going to give you an overview on what a survey analysis is and why it is so important. Then, we’ll talk about how embedded analytics helps you achieve your business goals, and we’ll create and embed an example dashboard.
What is embedded analytics?
Integrating analytical solutions and data visualization capabilities into a software application’s user interface to improve data comprehension and usability is known as embedded analytics. Bold BI helps you easily embed an analytics solution into your everyday work applications using a JavaScript SDK and server application. It also helps you reduce dependency on IT teams and lets you pick out the patterns in your data you need to improve academic, administrative, and workforce outcomes.
What survey analysis is and how it can benefit from embedded analytics
The process of analyzing the answers given in surveys is known as survey analysis. You can get quantitative and qualitative insights from survey analysis data.
Deploying an embedded analytics program in your organization will help you in a number of ways in improving your product quality, inventory management, customer satisfaction, and more. I am going to discuss the key areas in which embedded analytics helps improve your business:
Enhanced product development

Enhanced product development
Surveying customers using various domains helps you get honest reviews about your products and their usage. With embedded analytics, you can monitor all the key metrics such as product usage frequency, customer’s interest based on net promoter score, customer satisfaction level, product improvement opinion based on feedback from users, and more in your business applications. Using these metrics, you can see the issues with, usage of, and demand for your products, and keep improving them based on customer needs to help you grow.
Better market research and handling

Better market research and handling
Before introducing new products to the market, all businesses want to analyze that market, consumer preferences, and competitors’ performance using the data acquired from surveys across various platforms. Embedded analytics helps managers easily organize, breakdown, and analyze the data in their own software applications. It gives them more time to plan their raw material acquirement, distribution among factories, logistics handling, marketing strategy, and more.
Improved customer satisfaction and improved business
It is hard for many companies to process all the survey results collected from various types of customers. Analyzing and categorizing them in order to visualize the data and glean insight from it can be a long process requiring remarkable manpower if you don’t have the right tools.
Embedded analytics helps you analyze large data sets and prepare better visualizations in a short span of time. It enables users without technical knowledge to gain insight from their data. This helps managers make good decisions. Companies can also reduce the time they spend responding to customer questions by collating pain points in surveys to solve issues. This results in increasing the time spent on new customers, improving the count of onboarding customers and companies’ retention rate.
Improved productivity and better employee training

Improved productivity and better employee training
Many companies are connecting with their customers for surveys using text messages, emails, or calls. Using these methods is time-consuming: reporting the responses and documenting the interactions is a tedious process. Embedding analytics helps to organize the data in one place, make visuals based on the data, and further helps to analyze the survey results and extract meaningful insights.
You can also compare the survey data acquired before and after training phases using employee learning frequency, employee job satisfaction, and other metrics. Monitoring these employee data metrics and KPIs help you to understand the quality of the training you offer and make changes in your training programs. This will improve employee performance over time.
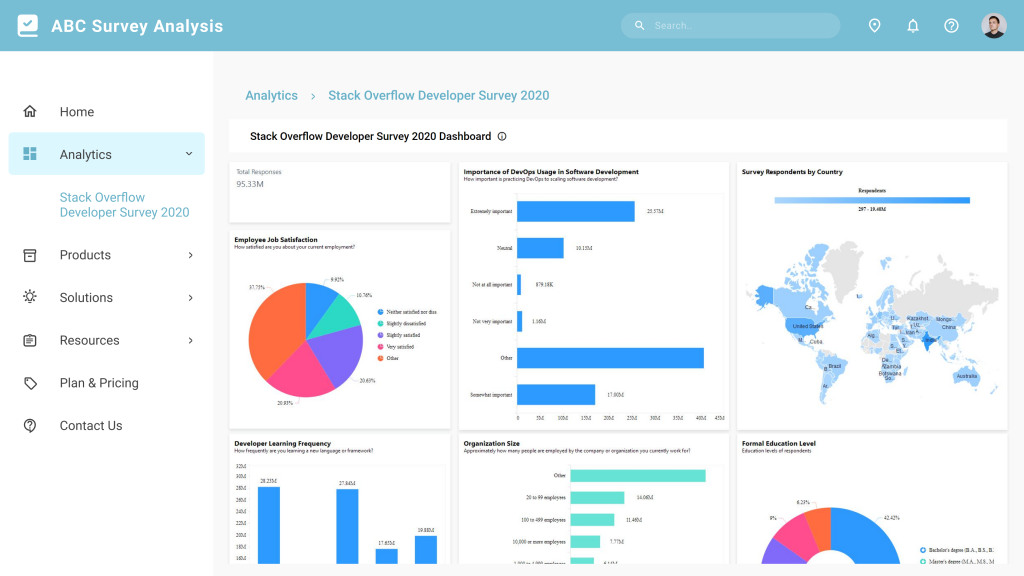
Bold BI’s Stack Overflow Developer Survey 2020 dashboard example
Bold BI’s Stack Overflow Developer Survey 2020 dashboard shows the 2020 Stack Overflow Developer Survey details with these sections: basic information, education, work, career, technology and tech culture, and demographic information. Based on the survey results, you can see technical people’s interest in learning new skills, how they rate career importance, and their satisfaction level. This information helps define strategy for the development teams to improve their productivity.
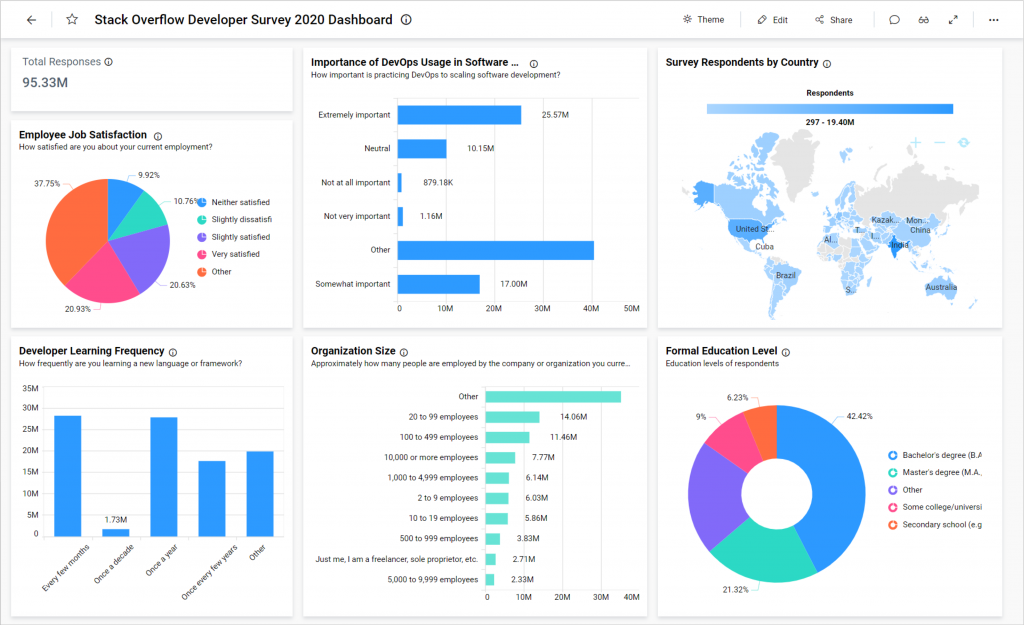
Stack Overflow Developer Survey 2020 dashboard in Bold BI
Total Responses

Total responses in Stack Overflow Developer Survey 2020 dashboard
This number card showcases the total number of survey responses received. Knowing the total number of responses helps viewers understand the rest of the dashboard more easily.
Employee Job Satisfaction
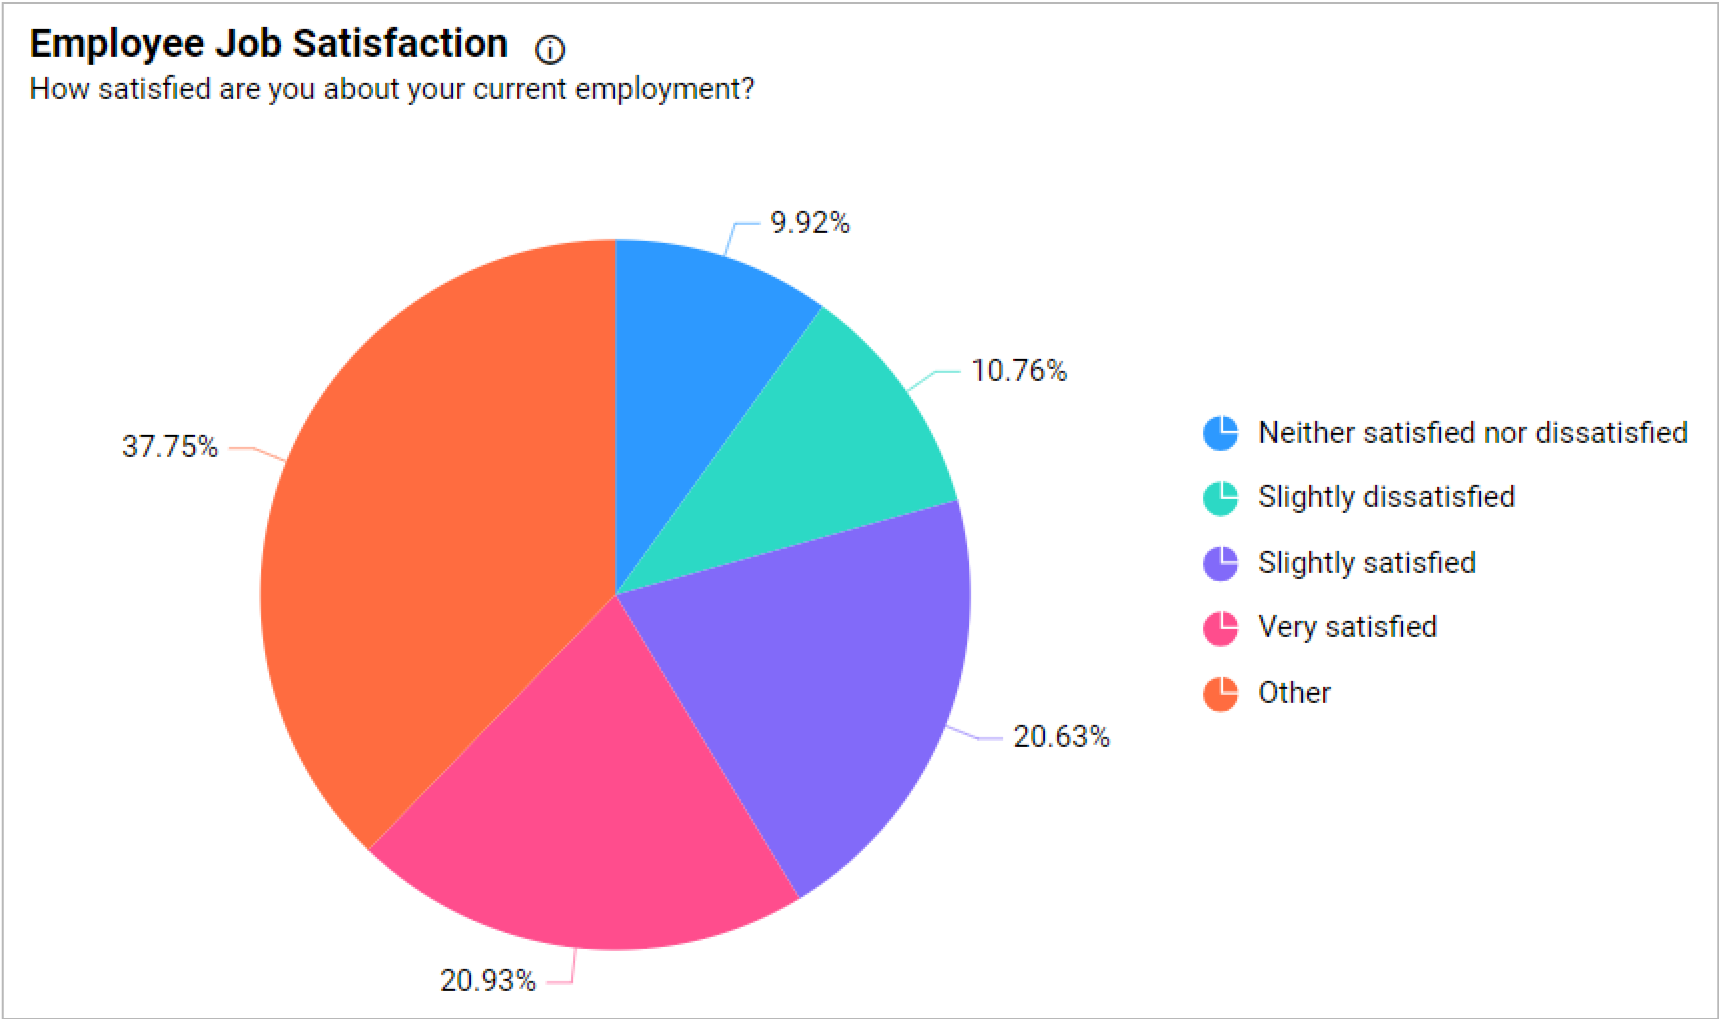
Employee job satisfaction in Stack Overflow Developer Survey 2020 dashboard
If a company surveys the satisfaction level of its own employees, managers can use this pie chart widget to display the results. Based on the results, managers can understand the employees’ opinion about their jobs and whether there are issues. If so, management can take necessary actions to resolve the struggles faced by the employees by asking actual opinions from them. This decision-making helps to retain employees with better satisfaction in future.
Importance of DevOps Usage in Software Development
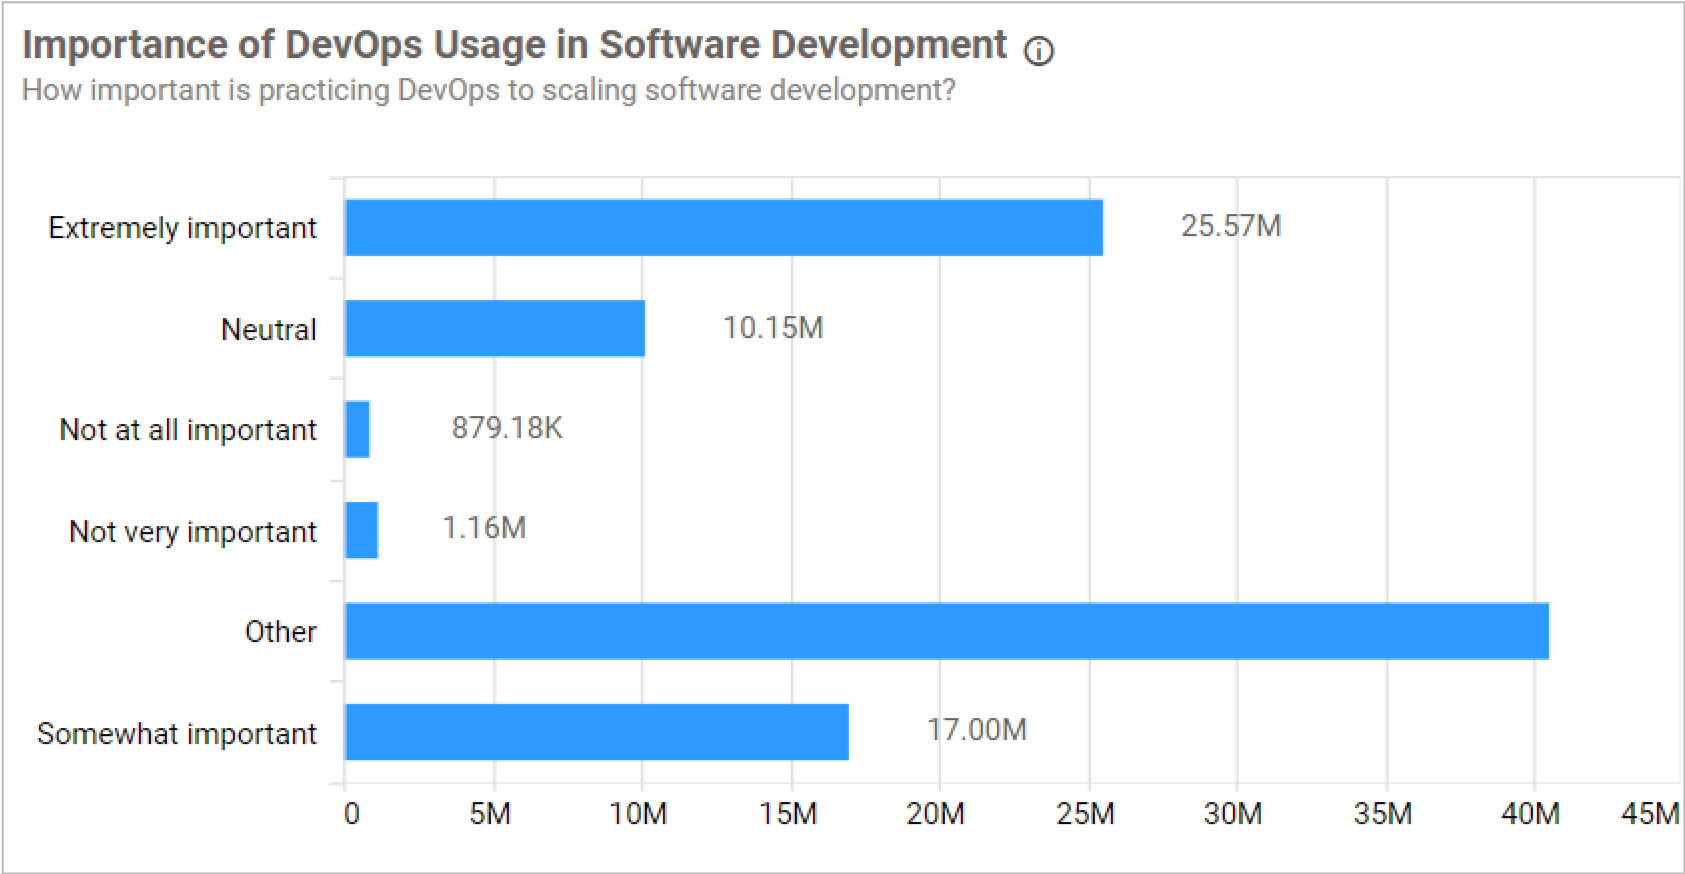
Importance of DevOps usage in software development in Stack Overflow Developer Survey 2020 dashboard
This chart showcases the perception among developers about the importance of practicing DevOps for software development. Asking their own employees this question, managers at software companies can know the likeliness of their employees to be using DevOps for software development.
Survey Respondents by Country
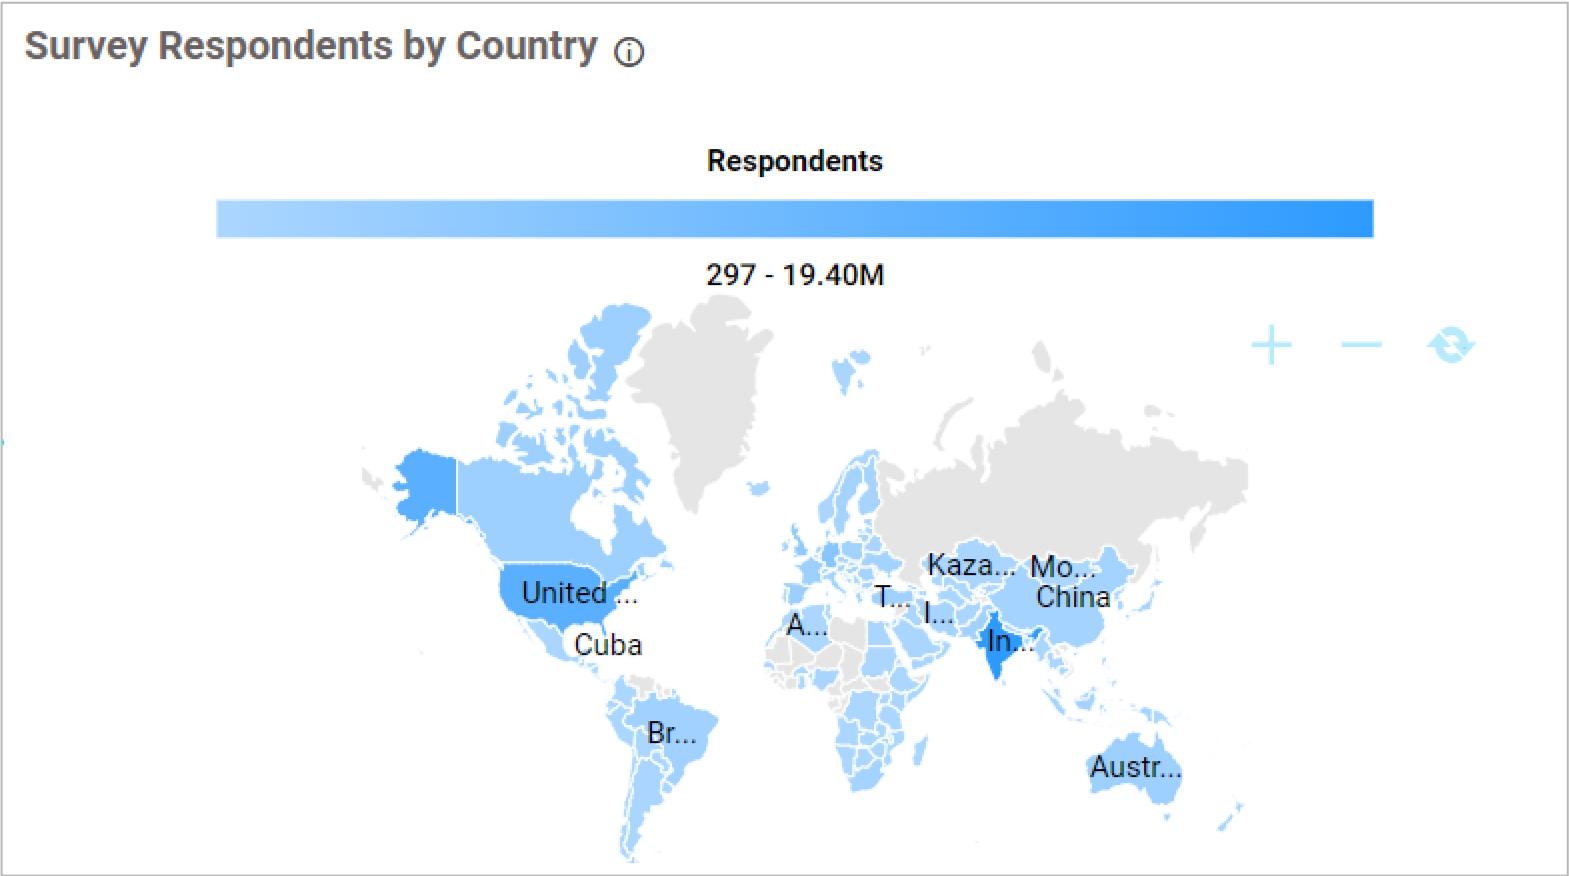
Survey respondents by country in Stack Overflow Developer Survey 2020 dashboard
This map showcases the proportion of respondents who responded to the survey across various locations. Using similar data collected from customers, managers can see their customers’ locations and determine where to focus marketing campaigns.
Developer learning frequency
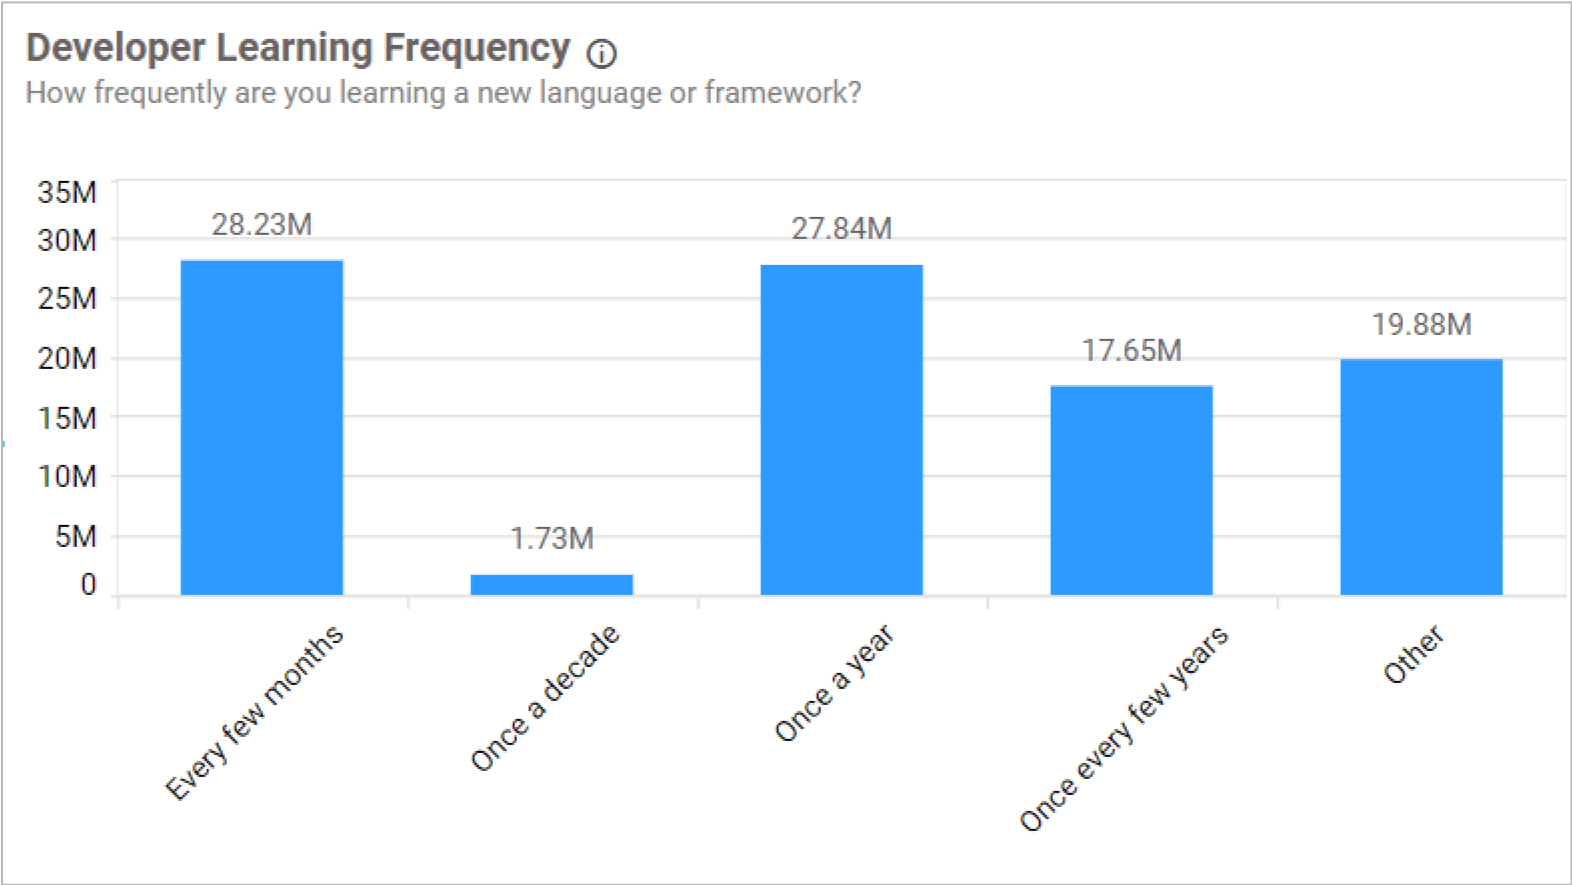
Developer learning frequency in Stack overflow developer survey 2020 dashboard
This chart showcases the developers’ frequency in learning a new language or framework. Tracking this data within a software company enables managers to know whether to instruct their developers to take a learning course periodically. Broadening employees’ knowledge helps them provide quality work and products.
Organization Size
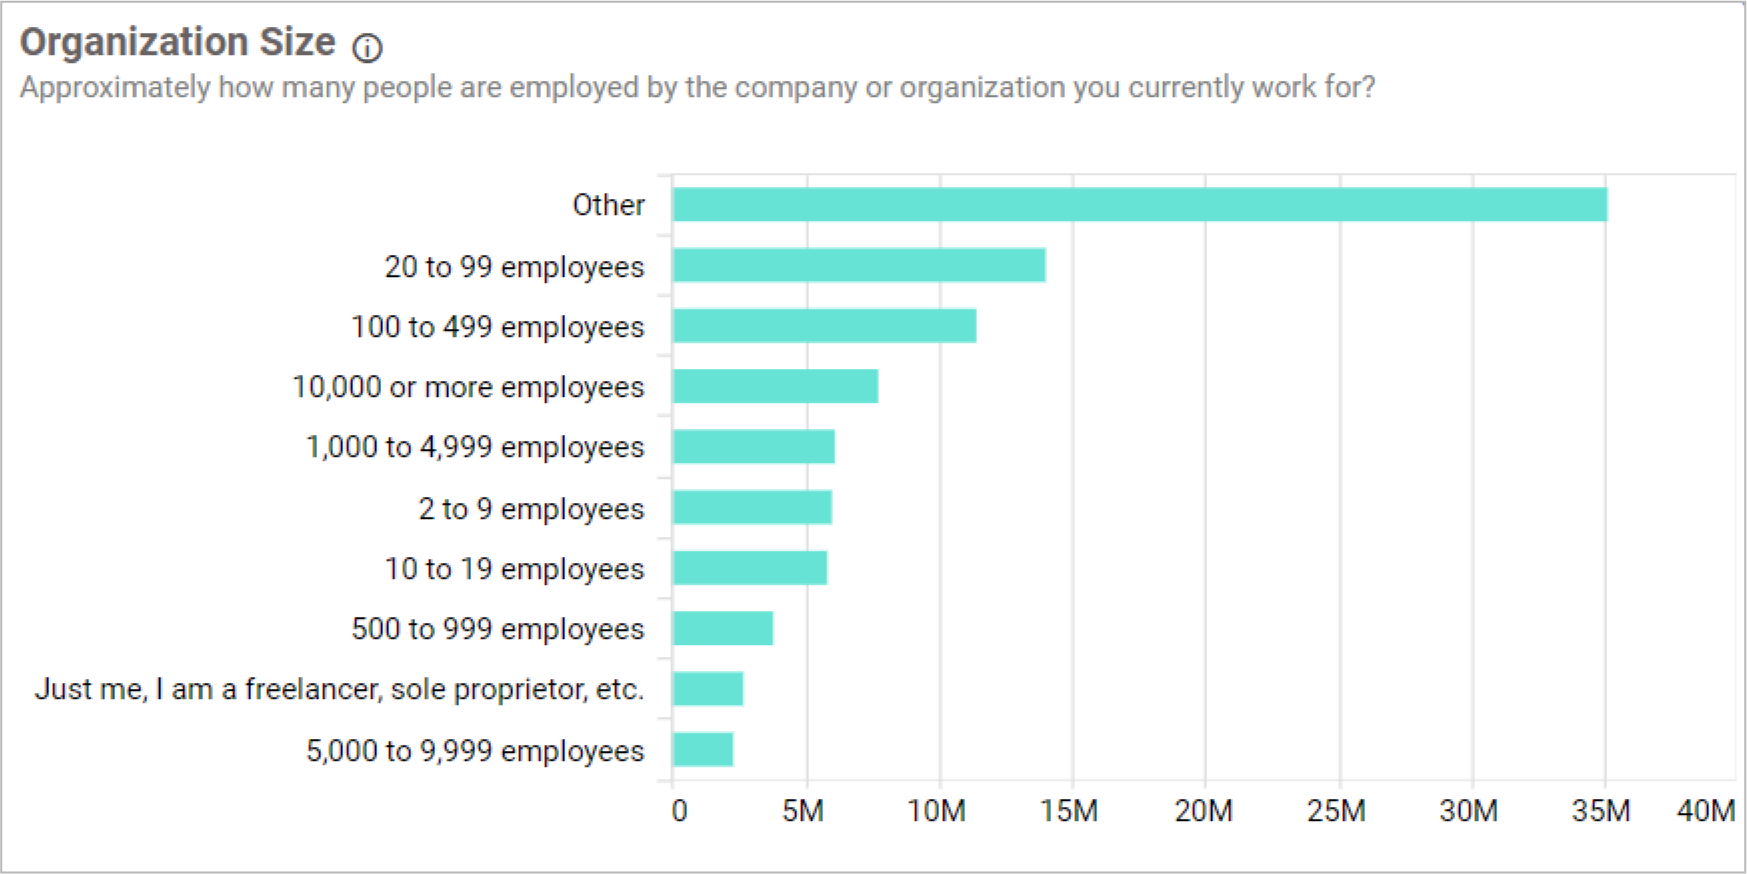
Organization size in Stack Overflow Developer Survey 2020 dashboard
This graph showcases organizations’ size based on the number of their employees. We can identify whether our customers are large or small companies by the number of people currently employed there.
Formal education level
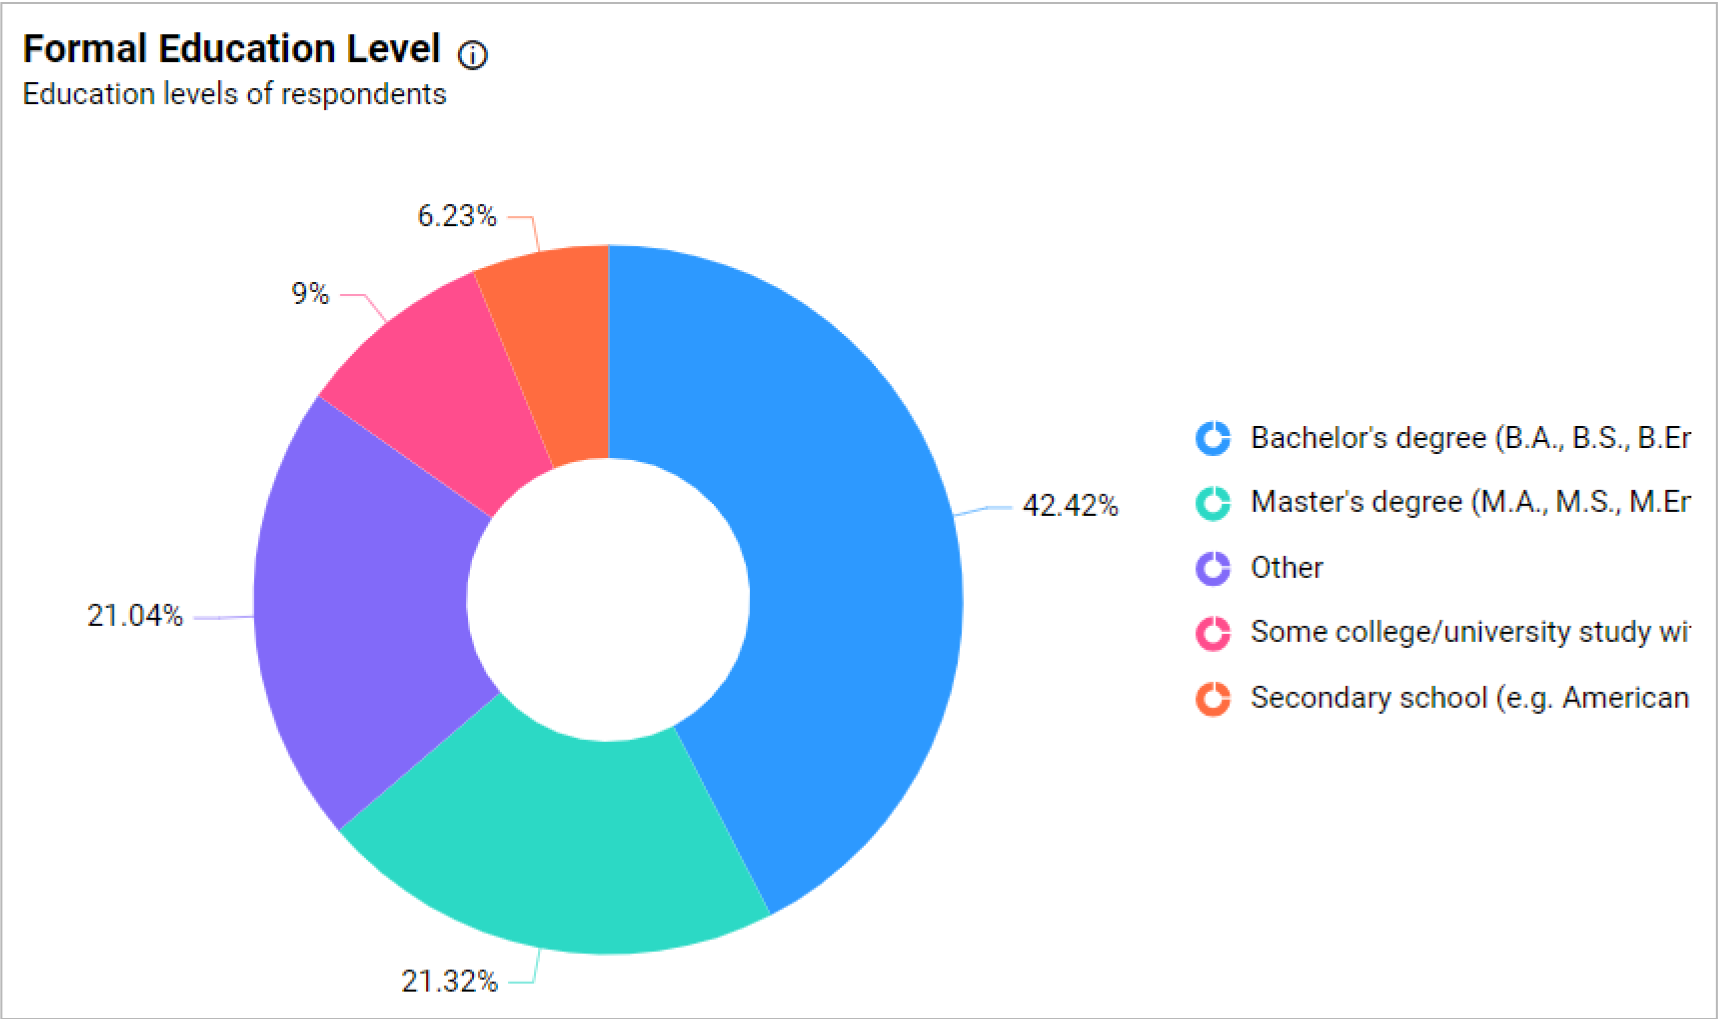
Formal education level in Stack Overflow Developer Survey 2020 dashboard
This doughnut chart showcases the respondents’ formal education qualifications.
To learn more about the metrics and KPIs used in this dashboard demo, refer to the Stack Overflow Developer Survey 2020 Dashboard example.
How to embed Bold BI’s Stack Overflow Developer Survey 2020 dashboard into your Angular application
Let’s see how analytics can be embedded into your web applications. Bold BI helps you to embed your dashboards in more than 10 web application platforms including ASP.NET Core, ASP.NET MVC, Angular, ASP.NET, and Ruby on Rails. In this blog, I am going to explain how to embed dashboards into your Angular applications. Consider a scenario where your company has a website like the one shown in the following image.
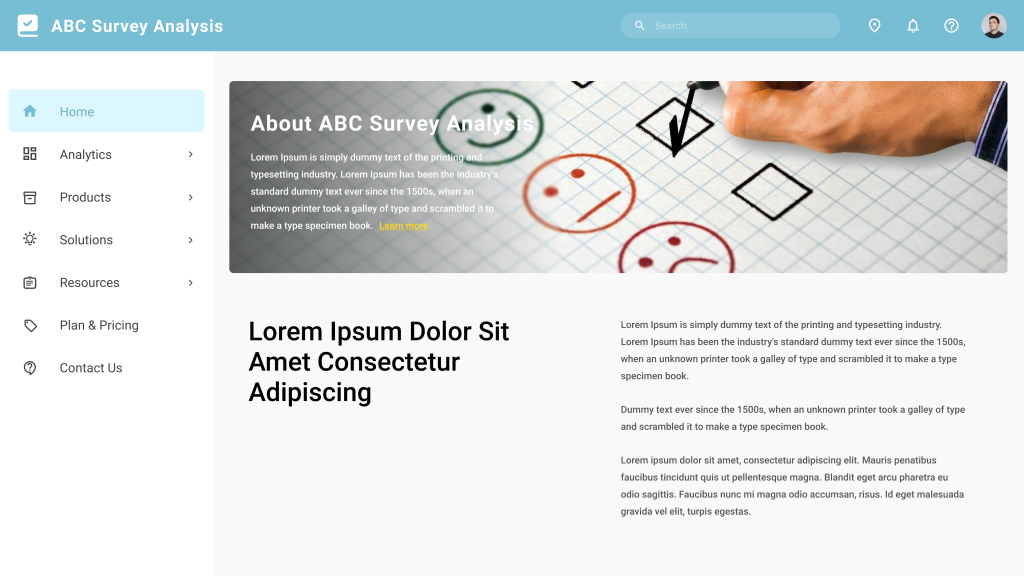
Sample website of a survey analysis department
You can embed dashboards easily using Bold BI and avoid building an analytics or BI solution yourself. Follow these steps to embed your dashboard successfully.
Prerequisites
Download and install the Bold BI server in your local machine and create an enterprise-grade dashboard. You can find the installation and deployment steps here.
Step 1: Creating an Angular application.
To successfully embed a dashboard in your application, you need to create an Angular application. First, you need create a new Angular project in Visual Studio Code and add the necessary .ts files to the project as shown in the following image.
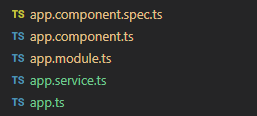
Adding necessary ts files
For more guidance, refer to the sample code in the Bold BI documentation.
In this demonstration, the Angular application acts as a client, and an ASP.NET Core application acts as a server. You need to add several properties in the app.component.ts file, as shown in the following table and screenshot.
Properties | Property Value Descriptions |
RootUrl | Bold BI dashboard server URL. Example: https://localhost:58094/bi. |
SiteIdentifier | For Bold BI Enterprise, it should follow the format |
Environment | Your Bold BI application environment. If using Bold BI Cloud, you should use |
apiHost | An ASP.NET Core application would be run on https://localhost:5000/, which needs to be set as |
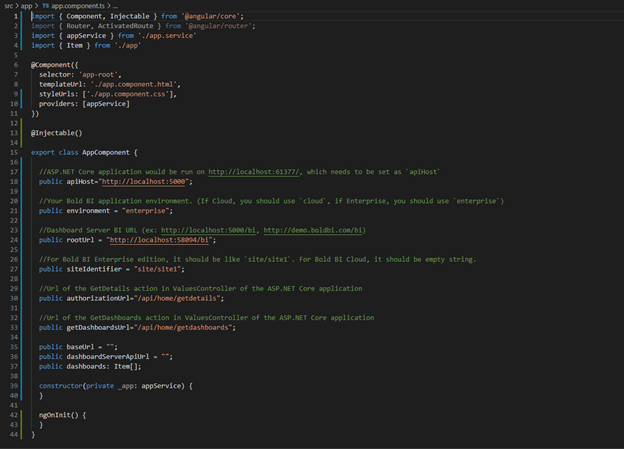
Adding required variables in the app.component.ts file
Step 2: Create a Bold BI instance.
After the Angular web application is created, you need to create a Bold BI instance to help you communicate between the server side (any web application) and the client side (Angular application), which allows us to embed a Bold BI dashboard in the Angular application.
Step 3: Create an authorization server to authenticate the Bold BI server.
Every application that embeds a Bold BI dashboard or widget must be authorized with the Bold BI server, and this authentication step requires sending confidential information to the Bold BI server, such as user emails, group data, and embedded signatures. So, in your server application, implement this authentication flow and provide the URL for connecting to your server in the Bold BI instance.
Step 4: Running the Angular application to view the embedded dashboard.
In the Angular application, add the authorization URL and dashboard URL that were defined in the ASP.NET Core application.
Dashboard embedded into an Angular application
Finally, you can that see the dashboard created in the Bold BI server is embedded in your web application.

Stack Overflow Developer Survey 2020 dashboard embedded in an Angular application
To learn more about embedding dashboards into your Angular applications, refer to this blog. You can also download the sample code used in the previous steps from our documentation.
Conclusion
Bold BI helps you to integrate dashboards in your applications written in React with ASP.NET Core, React with Go, WinForms, Node.js, Vue with Go, Vue with Core, and more, seamlessly. It will help you save time and prevent you from doing redundant work. Click this link to explore its features. To learn more about embedding dashboards into your application, refer to this blog and our help documentation.
I hope now you have a better understanding of Bold BI and how it will help the a company’s survey analysis department to be more successful. You can create a dashboard as you like with Bold BI’s 35+ widgets and 150+ data sources.
Get started with Bold BI by signing up for a free 15-day trial and create more interactive business intelligence dashboards. You can contact us by submitting questions through the Bold BI website or, if you already have an account, you can log in to submit your support question.
Subscribe to my newsletter
Read articles from Ragavan Angamuthu directly inside your inbox. Subscribe to the newsletter, and don't miss out.
Written by
Ragavan Angamuthu
Ragavan Angamuthu
As a passionate writer and tech enthusiast, I explore the human side of technology, capturing both the challenges and triumphs. Here, you’ll find heartfelt stories of personal growth alongside in-depth analyses of the latest tech trends. Each post is crafted with care, blending emotion with expertise, to offer a unique perspective that resonates on multiple levels. Whether you're here for inspiration or innovation, my goal is to connect, inform, and inspire through the power of words and technology. Join me on this journey of discovery and connection. Together, we'll navigate the wonderland of words, exploring, learning, and, above all, enjoying every moment. The adventure begins now—stay tuned for what's next!