Create and Embed Dashboards with Data Stored in Google Drive
 Ragavan Angamuthu
Introduction
Embedded analytics helps you integrate your dashboards and business intelligence tools into your business applications to enhance your analytics and give you a comprehensive look at your metrics. Bold BI enables you to embed your interactive dashboards in your own business application. It’s fast and easy, with features like prebuilt data connectors, calculated metrics, and engaging data visualization. In this blog, I am going to explain how to create a dashboard with Google Drive data and how to embed that dashboard in your business application. I’ll show you:
How Google Drive data is represented
Google Drive is a cloud-based storage solution developed by Google which helps you to save, store, and collaborate files anywhere from any devices.
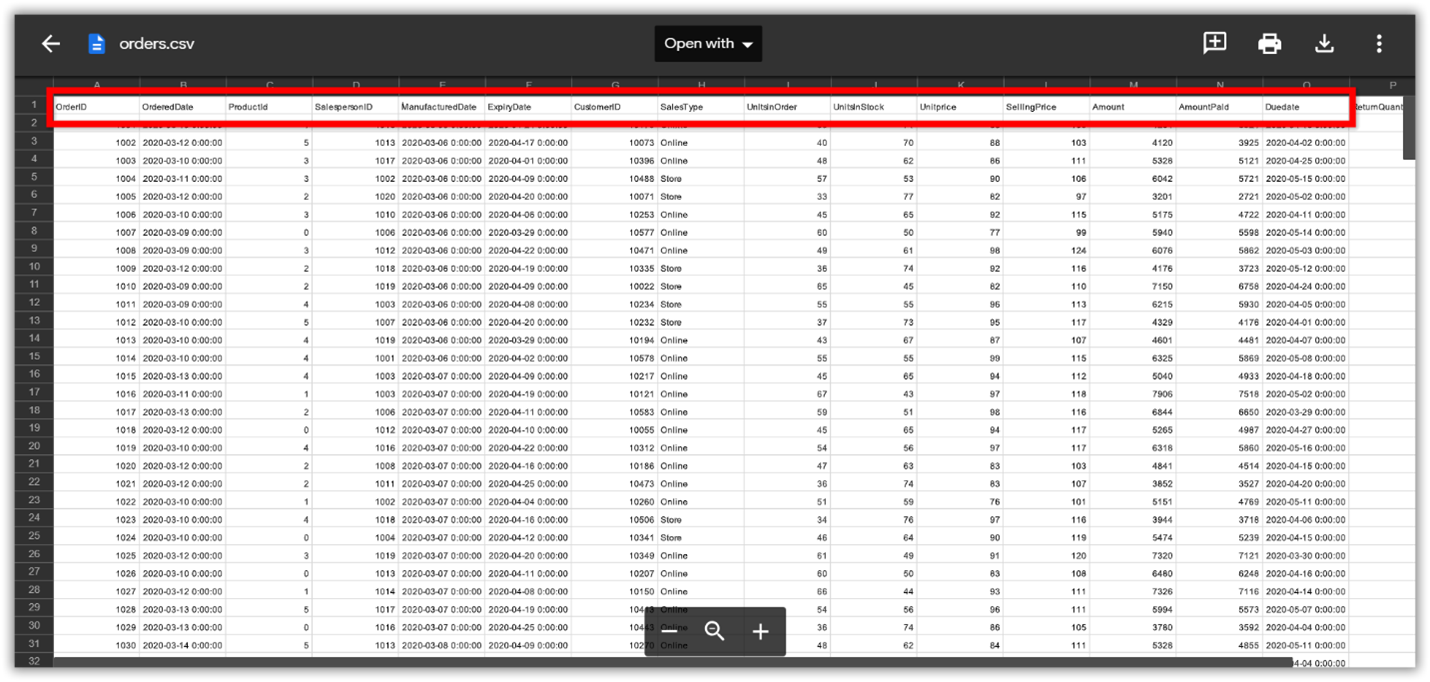
Structured Google Drive data
How to connect to the Google Drive
With Bold BI, you can easily connect your Google Drive data from your Google account to the dashboard designer. All you need to do is open the Data Sources configuration panel and then select Google Drive.
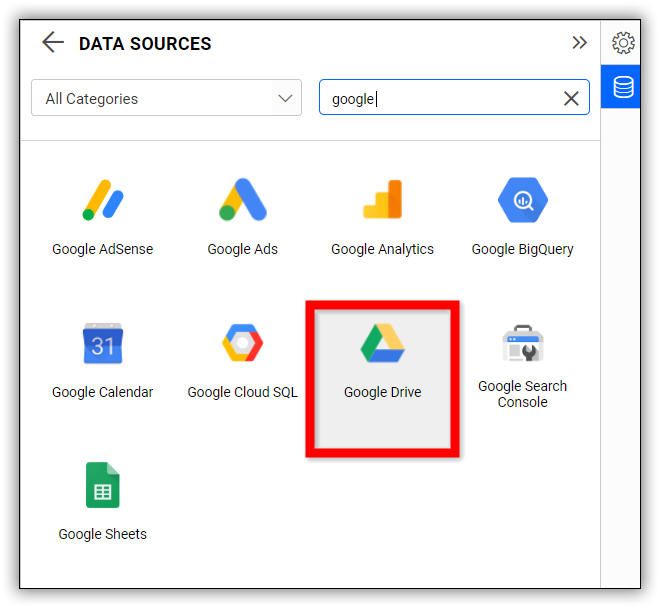
Data sources listing page
Once you have clicked the Google Drive data source, the connection window will open, as shown in the following image.
Google Drive configuration window
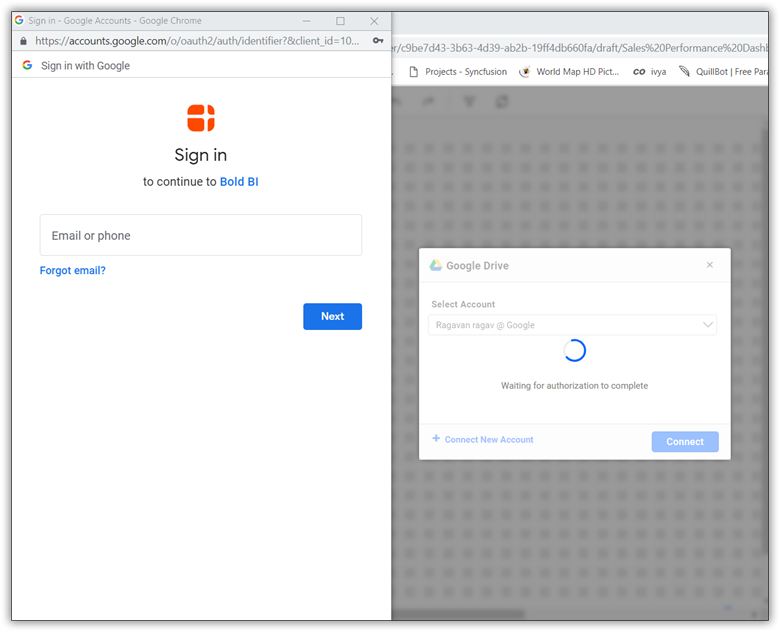
Now, you need to enter your Google account credentials to sign into the account. Then, choose your Google account from the window, as shown in the following image.
Google account window
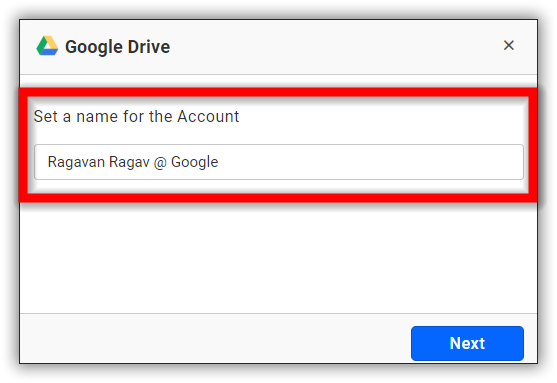
Now, you need to select the required CSV or JSON file from your Google Drive and give the name for the data source in the configuration window.
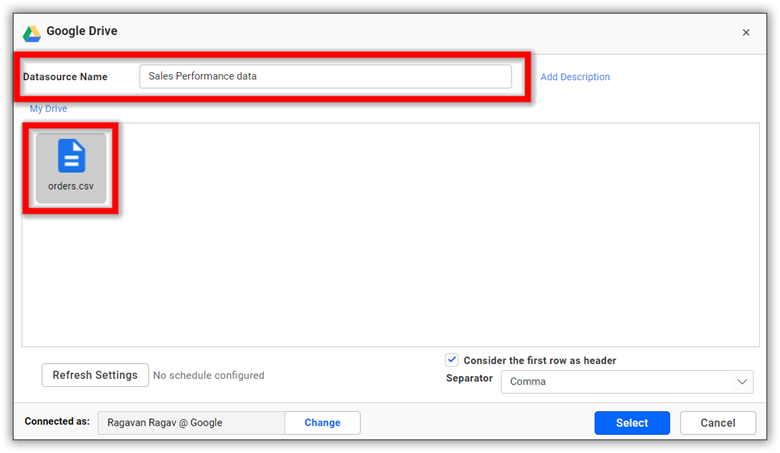
CSV or JSON file selecting window
Here, we are using a CSV file. After selecting the file, you will find a list of tables in the preview window.
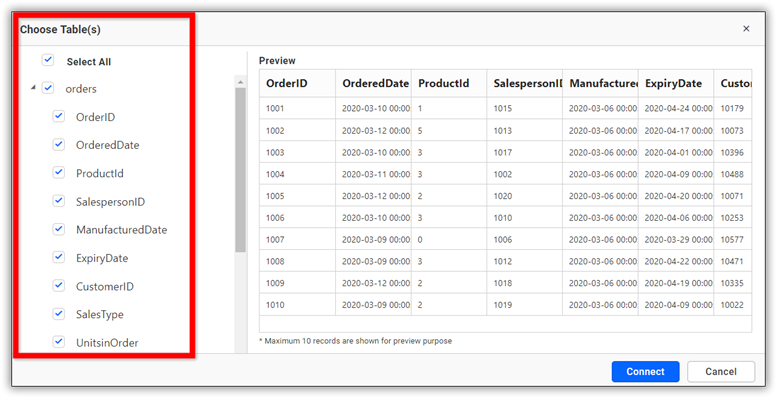
Table preview
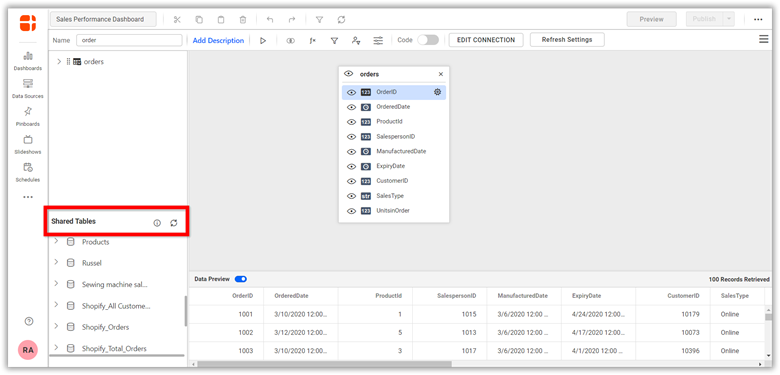
Select the desired tables and then click Connect. Your data will be moved to the intermediate database reserved for your tenant. Then, you will be navigated to the Bold BI’s data source designer. In the data source designer, you can view your data schema in a tree view.
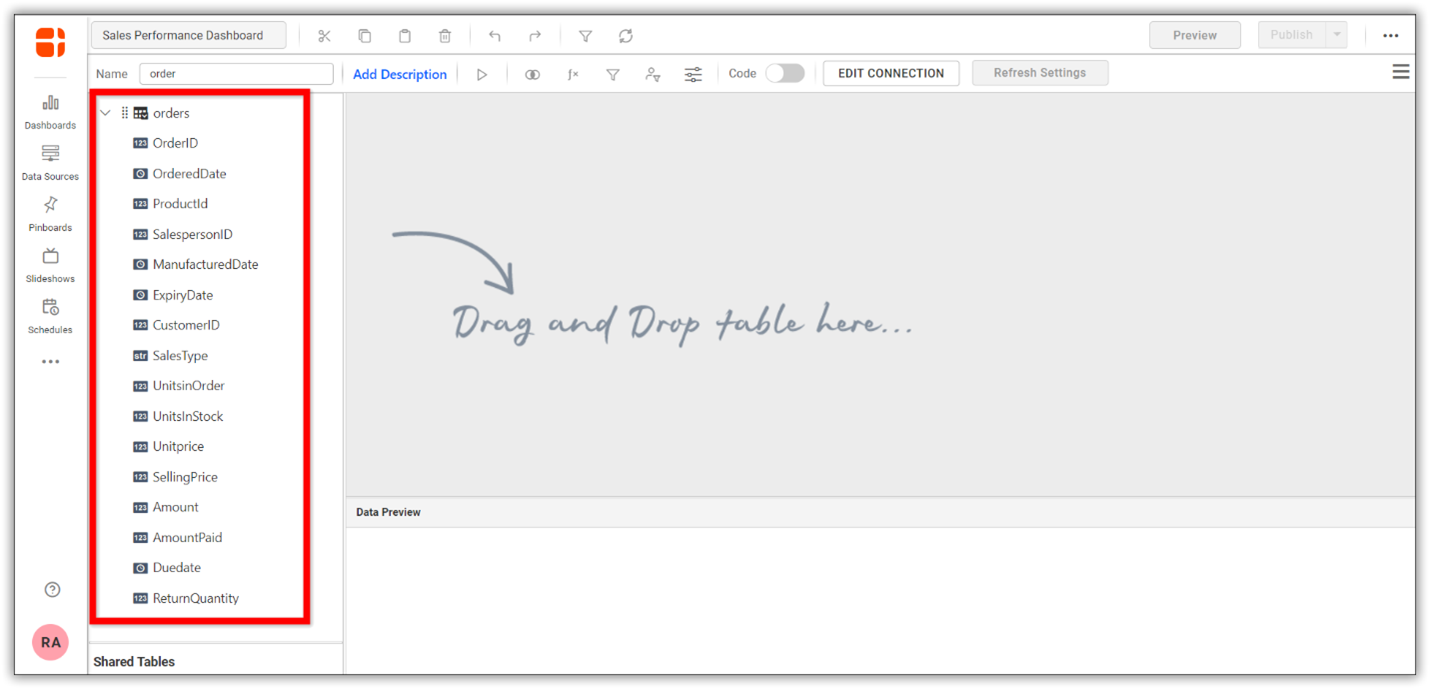
Data source editing window
Drag and drop the table that you want to analyze and save the data source by clicking Save in the top-right corner of the data source designer.
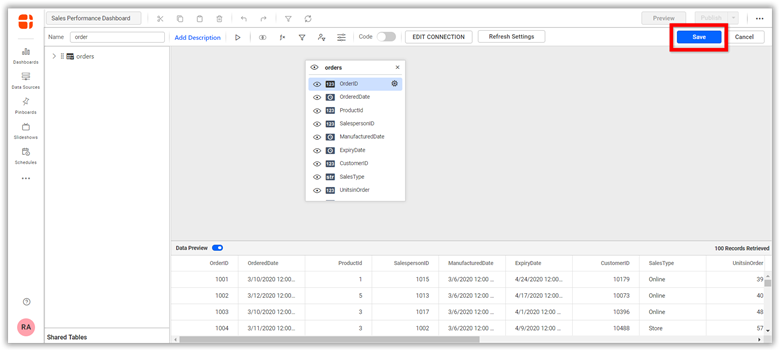
Saving the data source
How to integrate Google Drive data with other data sources
Shared tables—data source editing window
You can add multiple data sources if needed. In the Shared Tables panel at the bottom of the data source designer, use the join-table option.
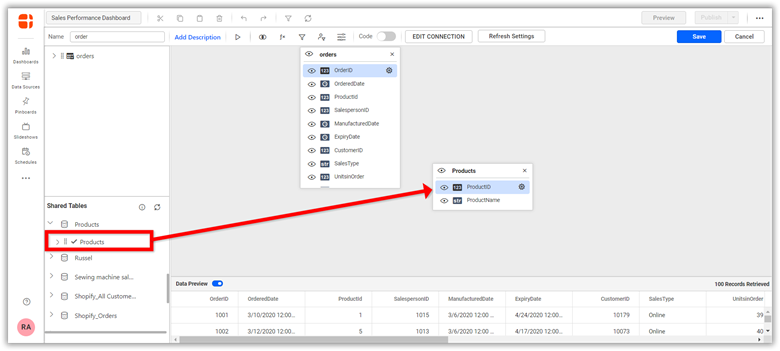
Shared tables—data source editing window
How to create a dashboard using Google Drive data
After successfully creating the data source, you can build a dashboard by dragging the 35+ widgets available in Bold BI. To create an interactive dashboard, first, you need to define your metrics and KPIs based on your data.
Please refer to this help documentation for more details on creating a dashboard. You can also refer to this blog on creating business dashboards online with Bold BI. To learn more about Bold BI features, please refer to this blog.
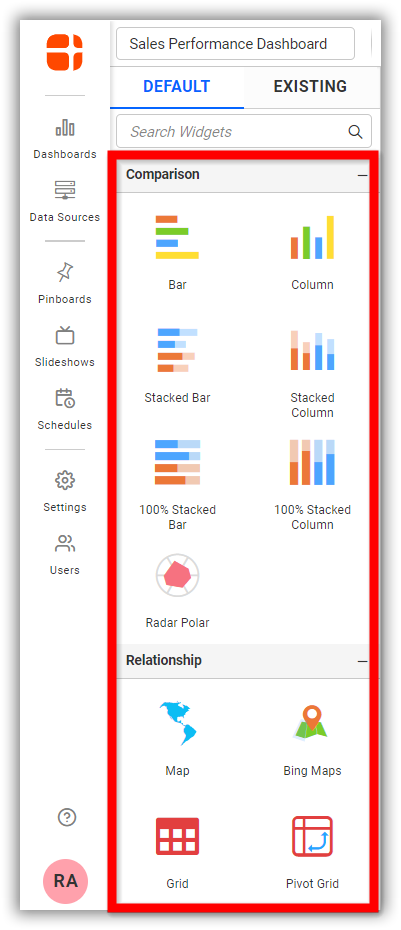
Widget panel
You can create a dashboard from scratch by dragging widgets into the dashboard designer. By creating a sales performance dashboard, for instance, you can gain financial insights from the visualization of company sales information and make decisions to increase revenue and sales.
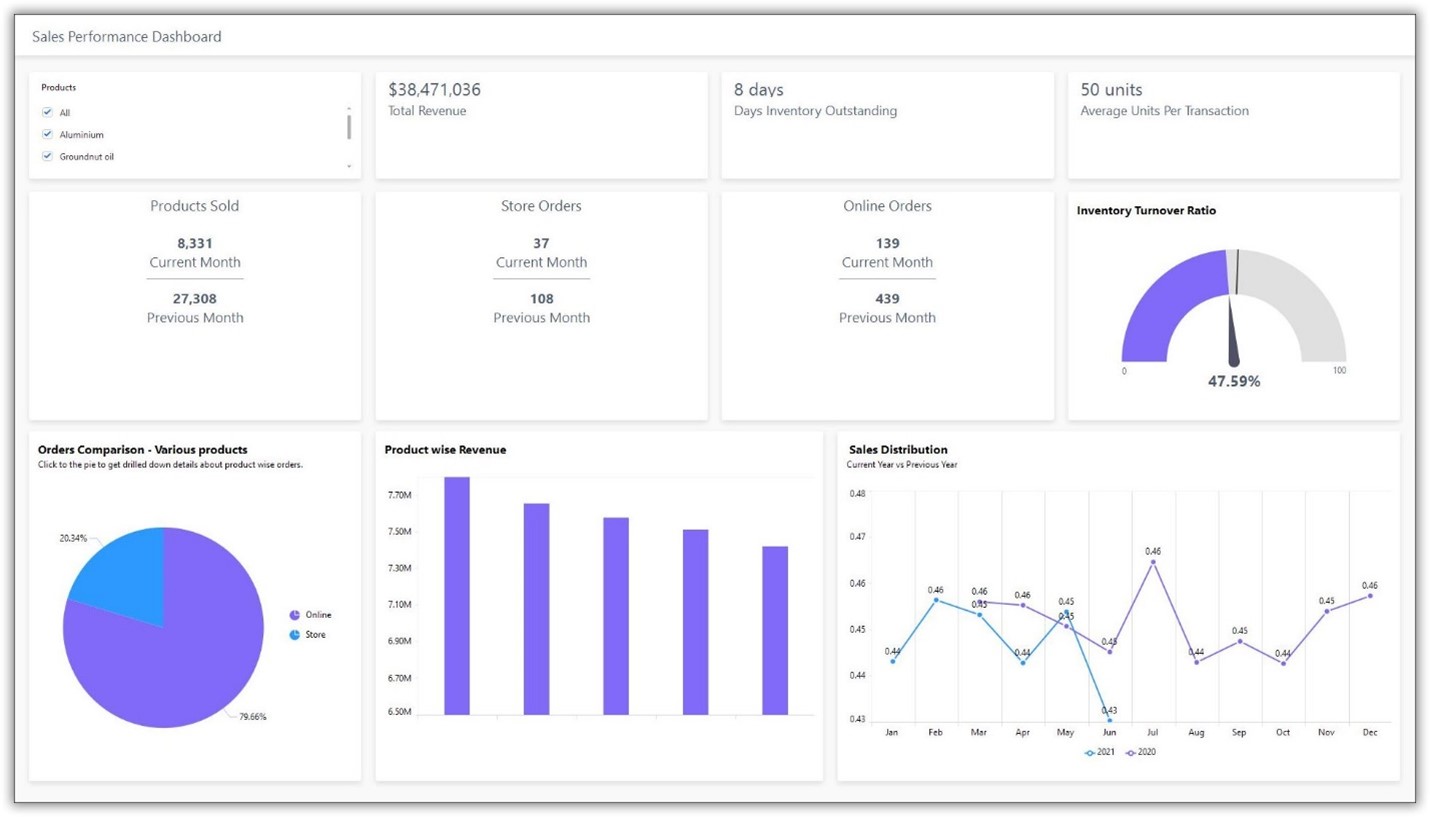
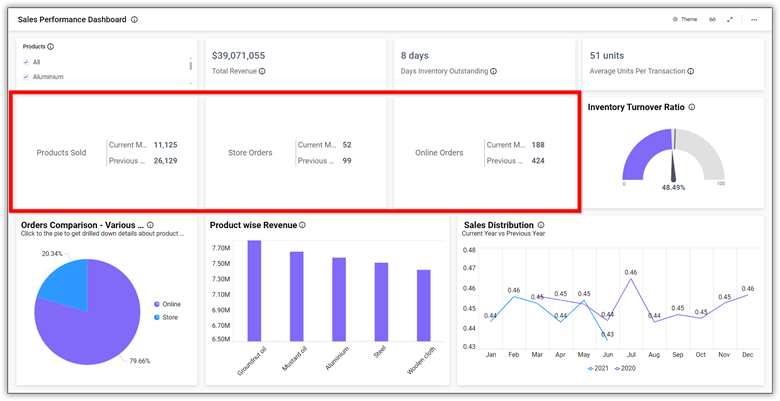
Google Drive Dashboard Embedding Example – Sales Performance Dashboard
This sales performance dashboard helps you monitor key metrics, such as:
Total revenue: Shows the total earned through all channels.
Days inventory outstanding: Shows the average number of days a company holds inventory before turning it into sales.
Inventory turnover percentage: Shows the percentage of inventory sold or consumed in a given time period.
Revenue by product: Shows the income earned with respect to the products.
Additionally, you can track the products sold, store orders, online orders, order comparison, sales distribution, product expiration details, and percentage of products returned by customers.
How to schedule data refreshes for a Google Drive dashboard
To get meaningful insight from looking at your data, it needs to be up-to-date data. By scheduling refreshes, you can keep your data up to date. You can schedule data refreshes in two ways:
Refresh settings while connecting your data source to Bold BI.
Refresh settings in the data source editing page.
Once you have selected Refresh Settings, the following configuration window will open.
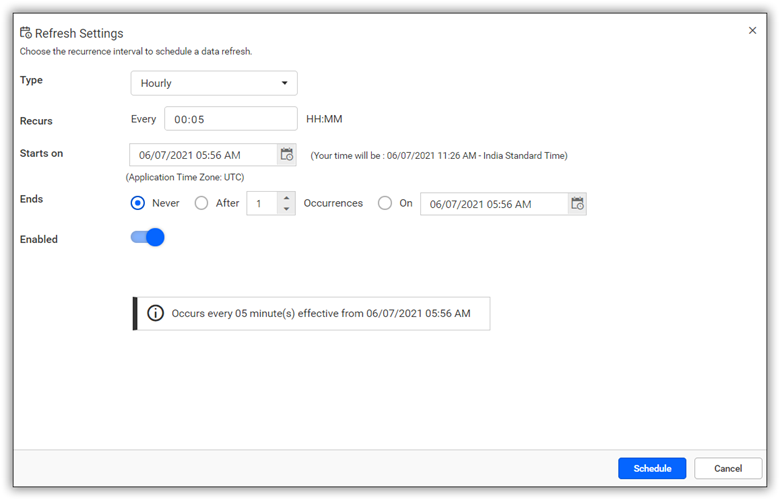
Refresh Settings window
In this Refresh Settings configuration panel, you can schedule the data refreshes hourly, daily, weekly, or monthly. You can also select recurrence, refresh starting time, and refresh end time.
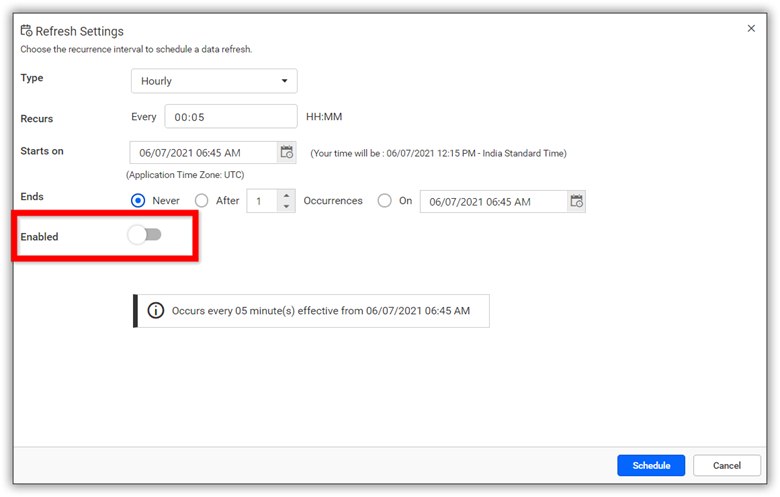
Refresh Settings—disabled
You can also disable the data refresh by turning off the Enabled toggle.
Data updated using Data refresh
In the previous screenshot, you can see the data is updated every five minutes. To learn more about this Sales Performance dashboard, please refer to this live demo.
How to embed a Google Drive dashboard in your application
Integrating analytical solutions and data visualization capabilities into a software application’s user interface to improve data comprehension and usability is known as embedded analytics.
Let’s see how these analytics can be embedded into your application. Bold BI helps you embed dashboards in your apps for 12 web platforms, including React with ASP.NET Core, React with Go, WinForms, Node.js, Vue with Go, and Vue with ASP.NET Core. In the remainder of this blog, I am going to explain how to embed dashboards into your Angular applications using Bold BI.
Prerequisites
Download and install the Bold BI server in your local machine and create a dashboard. You can find the installation and deployment steps here.
Step 1: Create an Angular application.
To successfully embed a dashboard in your application, you first need to have an Angular application. Create a new Angular project in Visual Studio Code and add the necessary TS files to the project, as shown in the following image.
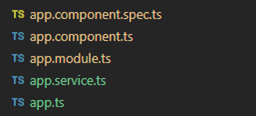
Adding necessary ts files
For more guidance, refer to the sample code in the Bold BI documentation.
In this demonstration, the Angular application acts as a client and an ASP.NET Core application acts as a server. You need to add several properties in the app.component.ts file, as shown in the following table and screenshot.
Properties | Property Value Descriptions |
RootUrl | Bold BI dashboard server URL. |
SiteIdentifier | For Bold BI Enterprise, it should follow the format |
Environment | Your Bold BI application environment. If using Bold BI Cloud, |
apiHost | An ASP.NET Core application would be run |
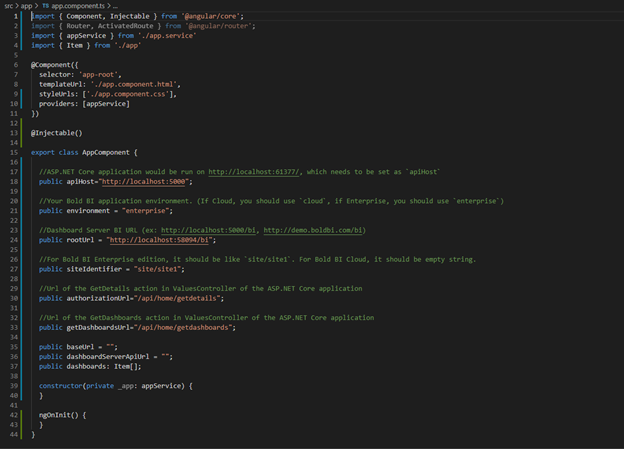
Adding required variables in the app.component.ts file
Step 2: Create a Bold BI instance.
After the Angular web application is created, you need to create a Bold BI instance to communicate between the server-side (any web application) and the client-side (the Angular application), which allows us to embed a Bold BI dashboard in the Angular application.
Step 3: Create an authorization server to authenticate the Bold BI server.
Every application that embeds a Bold BI dashboard or widget must be authorized with the Bold BI server. This authentication step requires sending confidential information to the Bold BI server, including users’ email addresses, group data, and embed signatures. So, in your server application, implement this authentication flow and provide the URL for connecting to your server in the Bold BI instance.
Step 4: Run the Angular application to view the embedded dashboard.
In the Angular application, update the authorization URL and dashboard URL that were defined in the ASP.NET Core application. Finally, you can see that the dashboard created in the Bold BI server is embedded in your web application.
To learn more about embedding dashboards in your Angular applications, refer to this blog. You can download the sample code used in the previous steps from our documentation.
You can see how to embed your dashboards in various web platforms by referring to our videos for ASP.NET Core, ASP.NET MVC, Angular, and more.
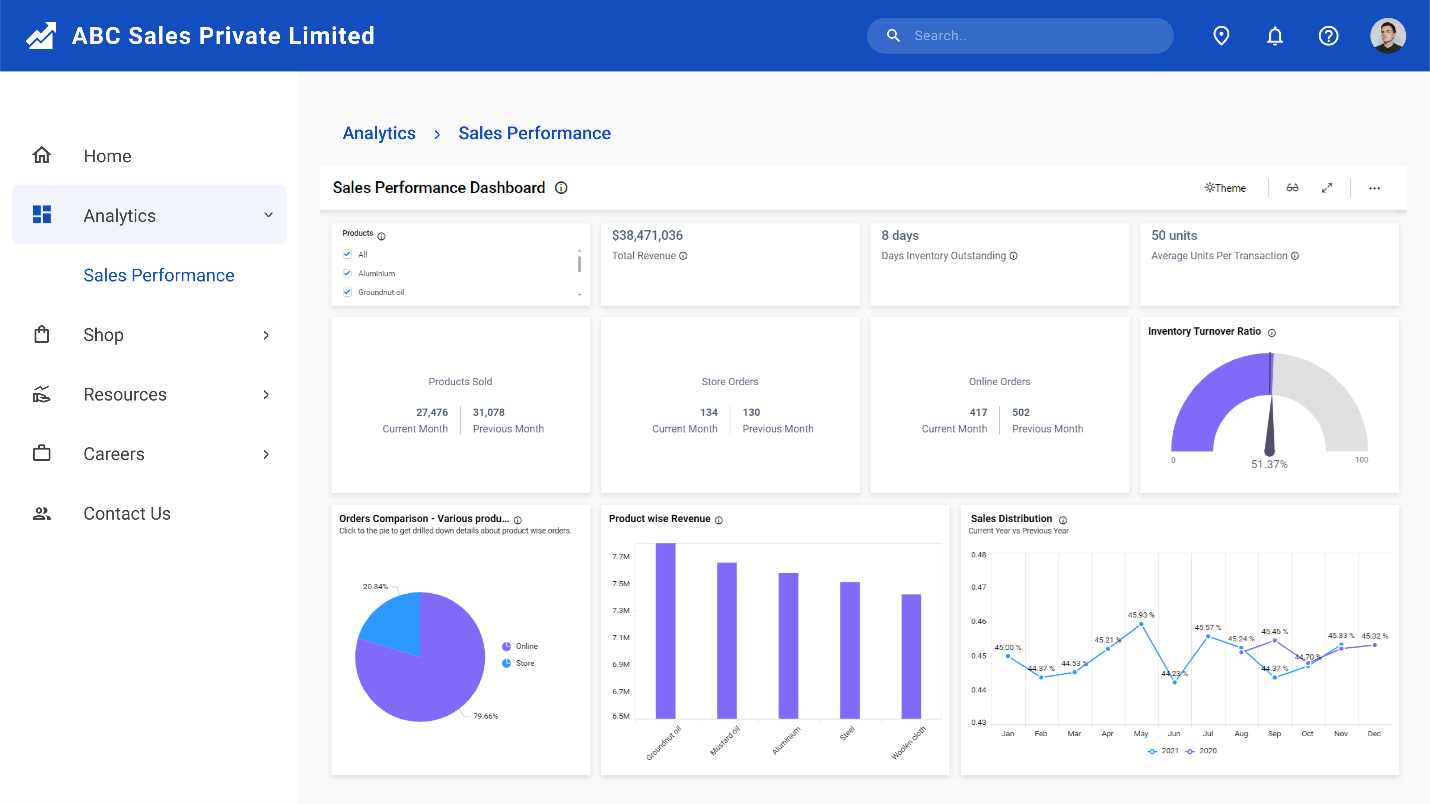
Sales Performance Dashboard Embedded in an Angular Application
Conclusion
Bold BI helps you integrate dashboards in your applications written in ASP.NET Core, ASP.NET MVC, ASP.NET, and Ruby on Rails. It will save you time by helping you avoid redundant work. Click this link to explore its features. To learn more about embedding dashboards into your application, refer to this blog and our documentation. You can create a dashboard any way you like with Bold BI’s 35+ widgets and 130+ supported data sources.
I hope you now have a better understanding of creating and embedding a dashboard with Google Drive data. If you have any questions on this blog, please feel free to post them in the following comment section. Get started with Bold BI by signing up for a free 15-day trial and create more interactive business intelligence dashboards. You can also contact us by submitting your questions through the Bold BI website or, if you already have an account, you can log in to submit your support question.
Subscribe to my newsletter
Read articles from Ragavan Angamuthu directly inside your inbox. Subscribe to the newsletter, and don't miss out.
Written by
Ragavan Angamuthu
Ragavan Angamuthu
As a passionate writer and tech enthusiast, I explore the human side of technology, capturing both the challenges and triumphs. Here, you’ll find heartfelt stories of personal growth alongside in-depth analyses of the latest tech trends. Each post is crafted with care, blending emotion with expertise, to offer a unique perspective that resonates on multiple levels. Whether you're here for inspiration or innovation, my goal is to connect, inform, and inspire through the power of words and technology. Join me on this journey of discovery and connection. Together, we'll navigate the wonderland of words, exploring, learning, and, above all, enjoying every moment. The adventure begins now—stay tuned for what's next!