How Natural Language Processing (NLP) Revitalizes Business Intelligence
 Ragavan Angamuthu
Introduction
The world is moving away from pressing a series of buttons or writing complex code to pass instructions to computers. We want our computers to understand human language and simplify our daily chores. We have started using Apple’s Siri and Amazon’s Alexa for professional and personal tasks. We also have technologies that can detect appointments, missing attachments, and reminders from email content. Natural language processing (NLP) is the science behind all these technologies. In this blog post, I will give you an overview of NLP and how it is used in various business intelligence (BI) platforms.
What is natural language processing (NLP)?
Natural language processing is a branch of artificial intelligence (AI) that strives to make computers understand and process human language. Human language has ambiguities that make it very hard for computers to understand the context and intent of natural speech or text. NLP works based on computational linguistics and statistical, machine learning, and deep learning techniques. These technologies work together to allow computers to interpret human language and comprehend its full meaning in context.
Usage of NLP in various BI tools
Today, business intelligence (BI) vendors support NLP, opening up data analytics to every user, from beginners to advanced data scientists. Data analysts can now interact with their data naturally, asking questions as they think of them. Previously, data analysts had to build complex visuals to understand correlation and causation. Natural language capabilities in BI tools now allow users to get insight by just talking normally. Let’s see how major BI vendors use NLP in their products:
Tableau’s Ask Data
Ask Data is Tableau’s NLP for business intelligence. Fully embedded into the Tableau Server, Ask Data is available from version 2019.1. With Ask Data, users can ask questions of any published data source and get answers visualized. Ask Data provides a fast and straightforward interface that allows users to type in questions with guided search suggestions to get instant results. Refer to the following sample.
Photo by Tableau’s Ask Data
You can request Ask Data to “Show sales in the United States” and then ask a follow-up question like, “How about in Texas?” without mentioning sales for a second time. To use Ask Data, you don’t have to be anadvanced data analyst. Even the general business person can explore data with ease. Refer to this Tableau page, which explains how to create an Ask Data lens in Tableau and analyze the data.
In addition to Ask Data, Tableau also supports Explain Data. It provides AI-driven explanations for data points in a single click. The answers help users unearth new understandings of the data points using the advanced statistical models. This advanced feature allows data analysts and business users to go deeper in data exploration.
Power BI’s Q&A
On the other hand, Power BI provides support for NLP through a dedicated Q&A visualization. The Q&A visualization is available along with different visualizations in the Power BI toolbox. Interestingly, the Q&A visual behaves like other visuals in a report and can be cross-filtered and cross-highlighted. It supports bookmarks and comments. You can also convert a Q&A result into a standard visual with a single click.
The following example shows how Q&A quickly interprets a complex question and displays an accurate result. It can also interpret relative terms like “last year” and “last quarter.”
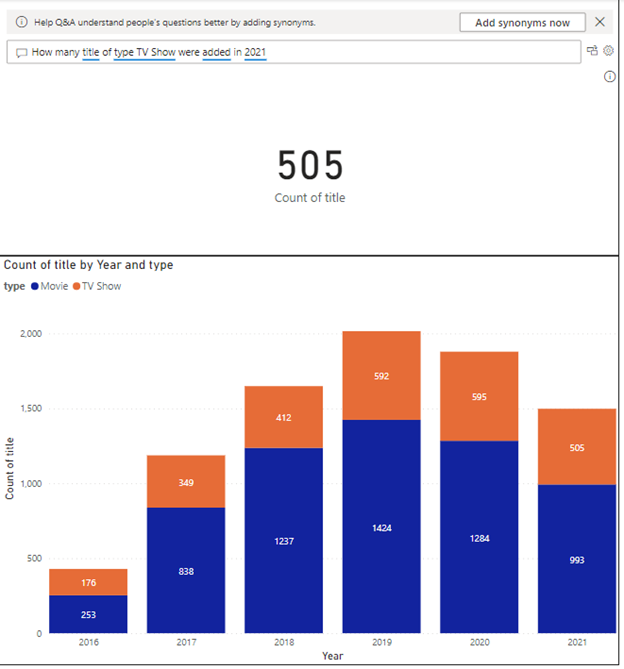
Power BI’s Q&A executing a natural language query
By default, Power BI chooses the best visual for the data when asked.
However, users can also specify their preferred visual by adding “as <visual name>.” For example, “Show profit by state as map” plots a bubble map, as shown in the following image.
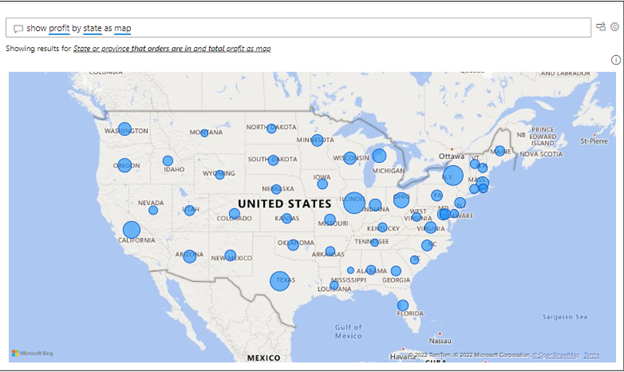
Specifying visualization type
This tip page shows the keywords and terminologies that Power BI’s Q&A can recognize easily.
When comparing Tableau’s Ask Data and Power BI’s Q&A, I felt that Power BI is handling comparisons slightly better than Tableau. The following query to compare profits between two states was perfectly executed in Power BI.
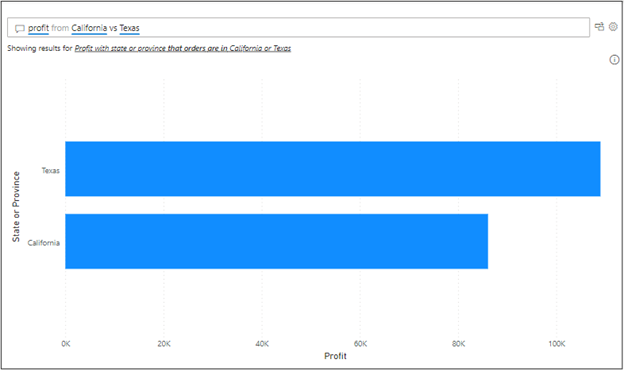
NLP query for comparison
However, Tableau couldn’t recognize it. At least the terminology in Tableau wasn’t precise enough for comparison. On the other hand, Tableau has a better interface for editing the query.
Conclusion
It wasn’t that long ago when only data analysts and a handful of people worked with data. Today, it is a much different story. Business data is everywhere. In fact, according to the International Data Corporation, there will be 163 zettabytes of data in the world by 2025. And with businesses relying on data more and more to make decisions, it’s vital that everyone in every department feels confident in utilizing data analytics. NLP and AI-driven business intelligence platforms provide tools and guidance to understand data better. Everyone can now realize what’s really going on with their data and make sure AI-driven insights back up their business decisions.
Subscribe to my newsletter
Read articles from Ragavan Angamuthu directly inside your inbox. Subscribe to the newsletter, and don't miss out.
Written by
Ragavan Angamuthu
Ragavan Angamuthu
As a passionate writer and tech enthusiast, I explore the human side of technology, capturing both the challenges and triumphs. Here, you’ll find heartfelt stories of personal growth alongside in-depth analyses of the latest tech trends. Each post is crafted with care, blending emotion with expertise, to offer a unique perspective that resonates on multiple levels. Whether you're here for inspiration or innovation, my goal is to connect, inform, and inspire through the power of words and technology. Join me on this journey of discovery and connection. Together, we'll navigate the wonderland of words, exploring, learning, and, above all, enjoying every moment. The adventure begins now—stay tuned for what's next!