Setup Xdebug with Drupal-9 using DDEV and Docker Desktop, as well as db import
 William Kan
Note for future self, a process for getting Xdebug on a Drupal-9 fresh install.
Pre-requisites / assumptions
Using MacOS
Docker Desktop is already installed and setup: if not head here -> https://ddev.readthedocs.io/en/latest/users/install/docker-installation/
PHPStorm installed and configured
Some familiarity with DDEV commands and concept of docker containers
General Steps
Make a new directory and project name for the folder. Install DDEV following the commands here -> https://ddev.readthedocs.io/en/latest/users/install/ddev-installation/#macos
Install the Drupal project using CMS QuickStart Guide -> https://ddev.readthedocs.io/en/latest/users/quickstart/
Ignore making the new directory and changing into the folder if you have done this already.Check you don't have conflicting ports for this project and other projects that use docker. Check this resource -> https://ddev.readthedocs.io/en/stable/users/usage/troubleshooting/#web-server-ports-already-occupied and pick new port numbers -> https://stackoverflow.com/questions/32478277/is-there-any-standard-alternative-https-port
There is a reference to a .ddev/config.yaml file. If the install so far was successful, your project structure should like something like this: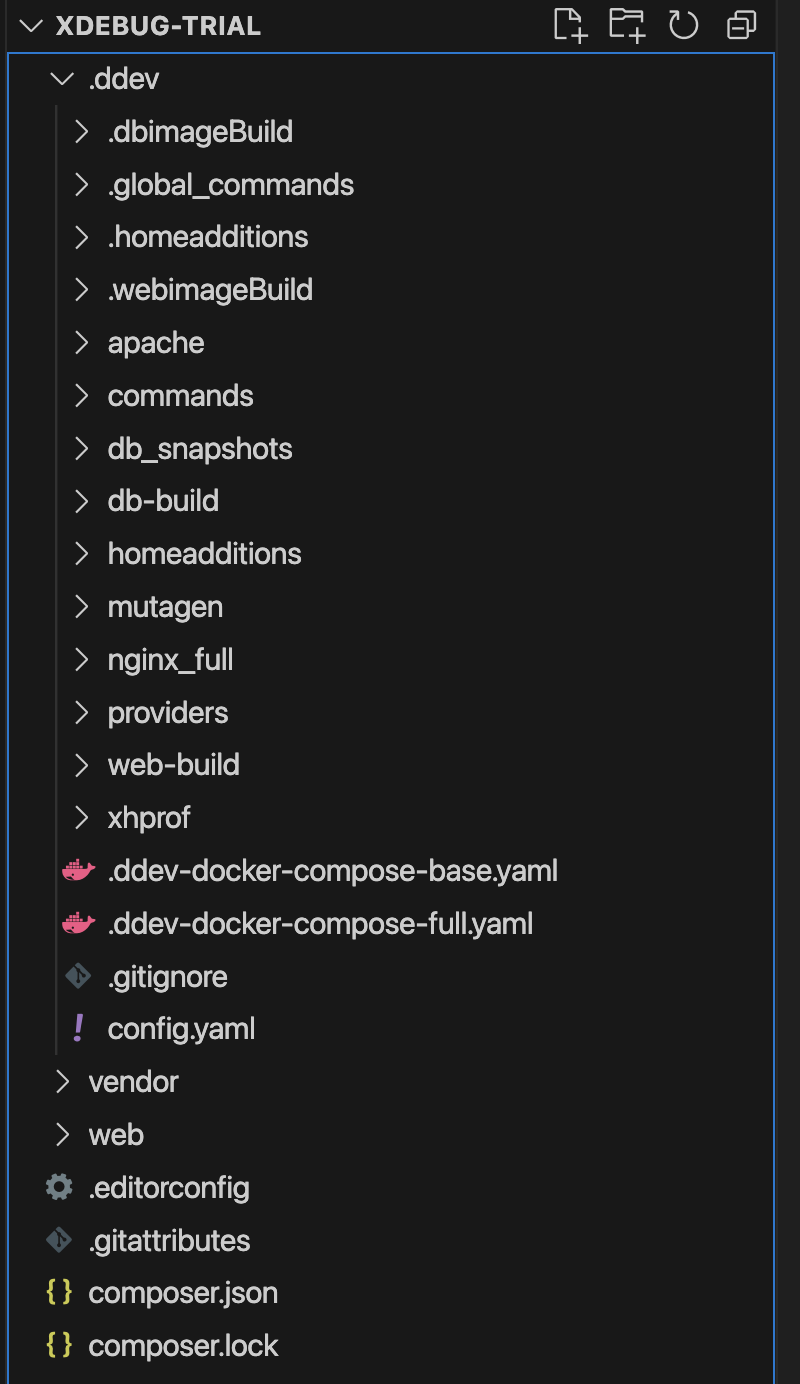
In the config.yaml file is where we can change the ports as well as turn on xdebug:
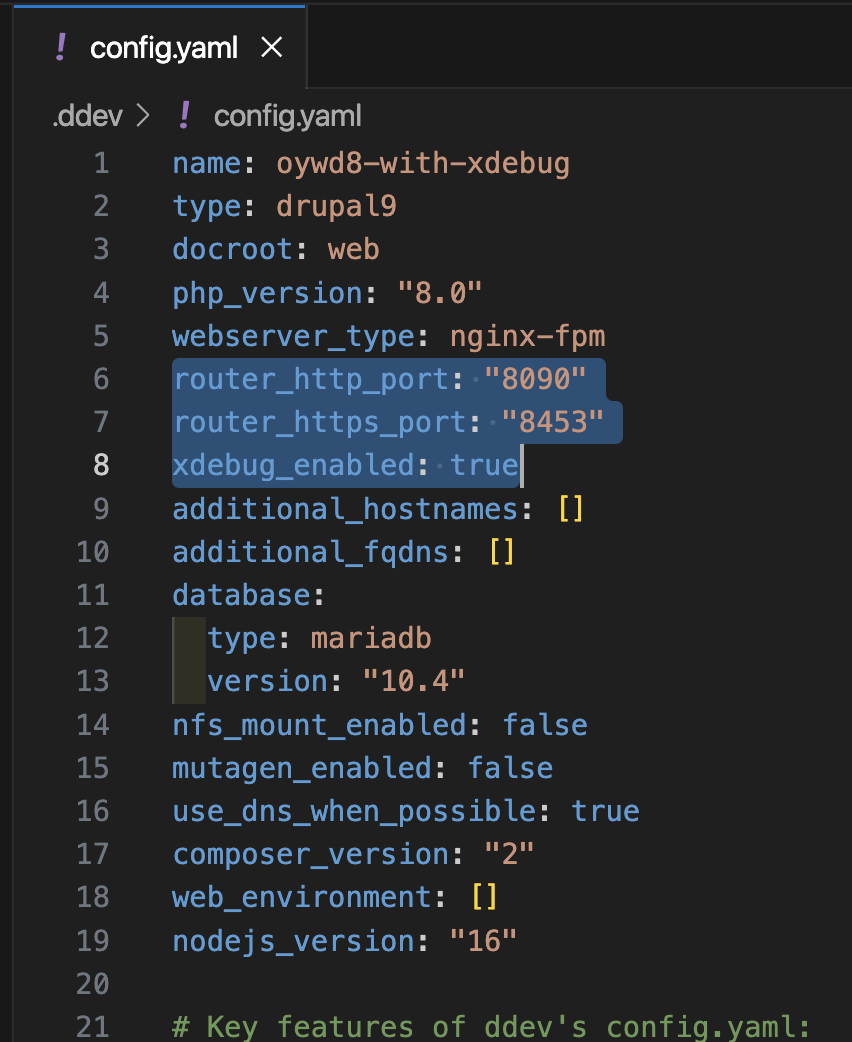
Remember to run
ddev restartto enable the changes in the container. The alternatives are turning off your other projects that use those ports or removing them entirely.To import a copy of a DB to our DDEV project, try a file with .tar.gz extension but .sql should also work. Run this command in the terminal of your project folder:
ddev import-db --src=path/to/file.sqlwhere 'path/to/file.sql' should be replaced with your file e.g. import-db --src=web/db-backup.tar.gz
DDEV syncs all your files from a directory into a virtual machine, it can only access the files from that directory.To see if Xdebug is active, head to PHPStorm, go to its settings (top-left Mac menu) or
command + ,
Then, select PHP -> Debug: Check the box 'Break at first line in PHP Scripts'. This will cause the debugger to halt processing on any page that uses index.php which is essentially everything. You may also have to click a telephone icon at the top which 'listens for PHP debug connections'.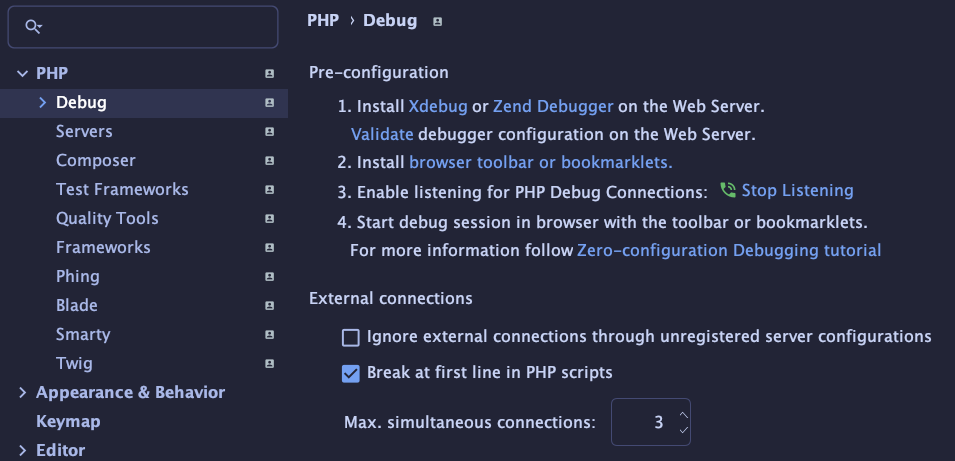
Refresh the browser and return to IDE and you should see a task pane at the bottom with a tab called Debugger. This is Xdebug in action.
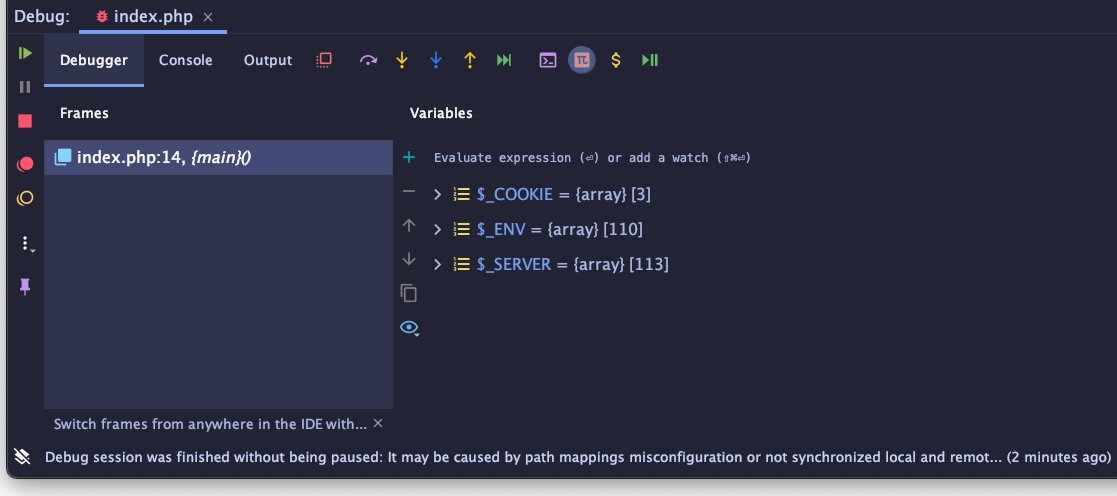
What you would then do is locate your bug by following the appropriate core or contrib module folder relevant to the issue, and place breakpoints on the left side to pause the running of the program so that you can examine variables in state, functions etc. What files to check and where? That's where experience comes into play 🤯
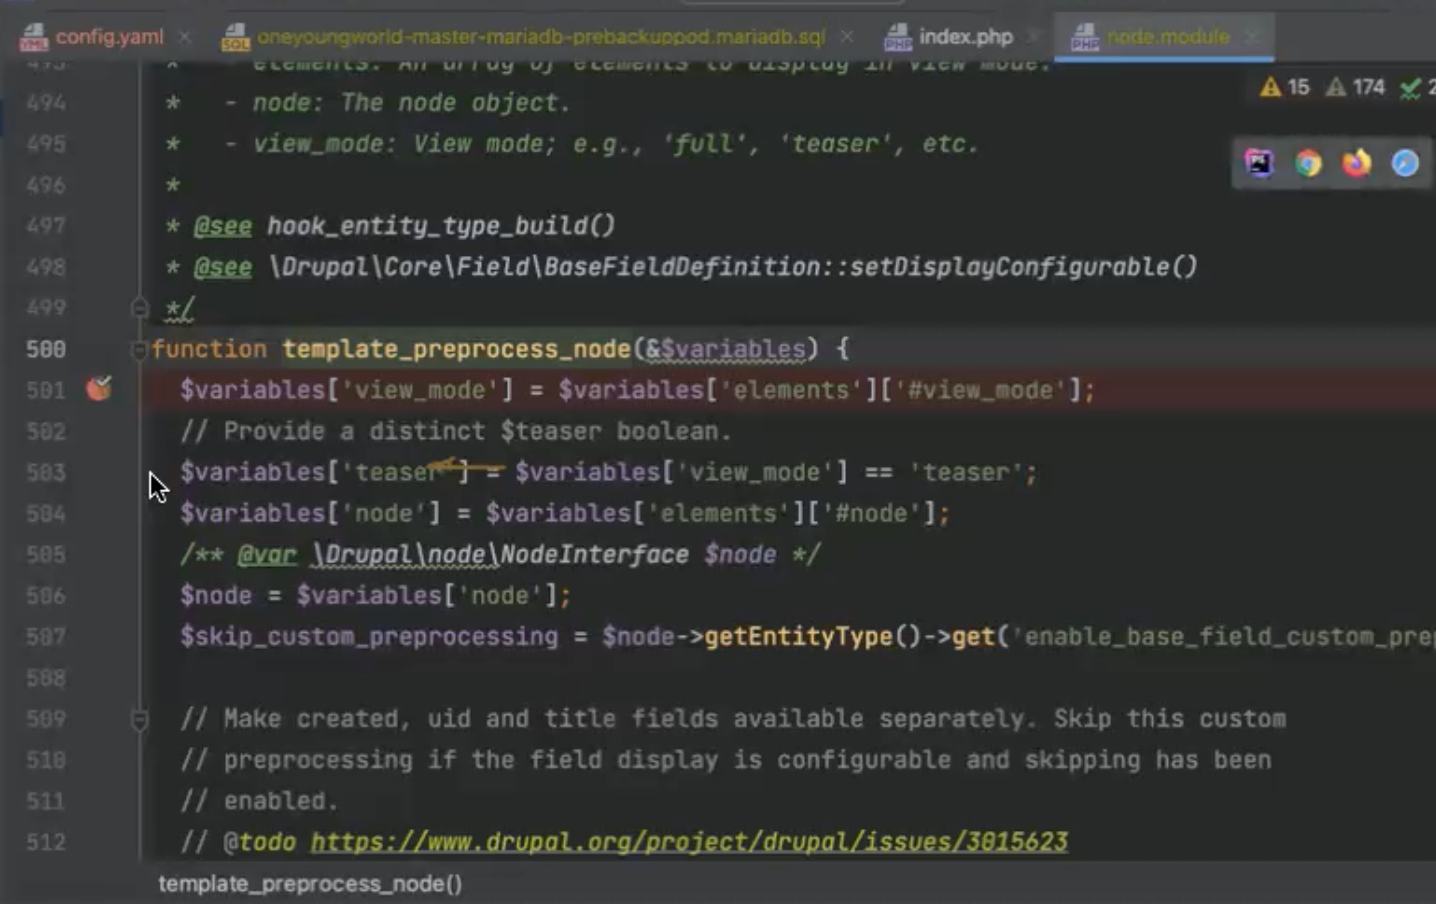
Some documentation on using Xdebug: https://ddev.readthedocs.io/en/latest/users/debugging-profiling/step-debugging/#ide-setup
Subscribe to my newsletter
Read articles from William Kan directly inside your inbox. Subscribe to the newsletter, and don't miss out.
Written by

William Kan
William Kan
I am an enthusiastic, flexible front-end developer beginning my career in web and software development. I am currently employed as a digital apprentice in London working on a Drupal CMS site for website maintenance and feature development. Non-tech previous work history: worked for design consultancies and a main contractor on ground engineering projects overseas and in UK. Since December 2021, I completed a 12-week software development training course. The topics covered were: SDLC, foundation in HTML5, CSS3, JavaScript ES6, Python3, mySQL Workbench and MongoDB.