Create a Basic Forecasting App using Streamlit and Prophet
 David Marquis
Are you interested in building interactive web applications for data analysis and visualization? Look no further! Streamlit is a beginner-friendly Python library that allows you to create amazing web apps with just a few lines of code. In this blog post, we will explore how to use Streamlit to build a forecasting app using Facebook Prophet, a popular library for time series forecasting.
Time series forecasting plays a crucial role in various industries, enabling businesses to make informed decisions based on historical patterns and future trends. Whether you’re in finance, retail, healthcare, or any other domain dealing with time-dependent data, having the ability to generate accurate forecasts is invaluable.
This blog post will walk through the step-by-step process of building a time series forecasting app using Streamlit and a simple Prophet example. It is assumed you have some basic knowledge of Python and are familiar with installing packages and running Python scripts. By the end of this tutorial, you’ll have a functional web app that can generate a forecast.
Let’s dive in and harness the power of Streamlit and Prophet to create our first app!
What is Streamlit?
Streamlit is a user-friendly Python library designed specifically for data applications. It simplifies the process of creating web applications and allows you to focus on your data analysis tasks. With Streamlit, you can turn your Python scripts into interactive Apps with minimal effort.
Key Features of Streamlit
Easy-to-Use: Streamlit provides a simple and intuitive API, making it beginner-friendly. You don’t need to have prior web development experience to get started.
Rapid Prototyping: With Streamlit, you can quickly build and iterate on your app. You can see the changes in real time without the need for manual reloading.
Built-in Components: Streamlit offers a range of built-in components such as sliders, dropdowns, and buttons, making it easy to add interactivity to your app.
Integration with Python Libraries: Streamlit is Python based so you can use any Python libraries and code you want within Streamlit
Streamlit is an excellent choice for n00bs like me starting with Python and wanting to share data ideas. Its simplicity and ease of use make it a fantastic tool for learning and experimenting. You can quickly create web Apps to showcase your data analysis projects or share your findings with others. Streamlit’s interactive nature encourages exploration and enables you to present your work in a more engaging and user-friendly manner.
Streamlit empowers you to create impactful and interactive web Apps without the complexity of traditional web development frameworks.
Streamlit’s Development Workflow
Streamlit follows a simple development workflow that allows you to create web apps in a matter of minutes. Here’s a high-level overview of the typical steps involved:
Data Loading: Load your data into a suitable format, such as a Pandas DataFrame, to perform data analysis and visualization.
Data Processing and Analysis: Apply data transformations, clean the data, and perform any necessary calculations or statistical analysis to gain insights.
App Creation: Use Streamlit’s intuitive API to build the structure of your app. You can add components like sliders, dropdowns, and text inputs to make your app interactive.
Data Visualization: Incorporate visualizations using popular Python libraries such as Matplotlib, Plotly, or Altair. Streamlit seamlessly integrates with these libraries, allowing you to create stunning charts and graphs.
Building a Time Series Forecasting App with Streamlit and Prophet
In this section, we’ll walk through the step-by-step process of building a time series forecasting app using Streamlit and the Prophet library. I would recommend learning and using virtual environments for Python.
Setting Up the Environment
Here’s what you need to do:
Install Streamlit: Open your terminal or command prompt and run the command
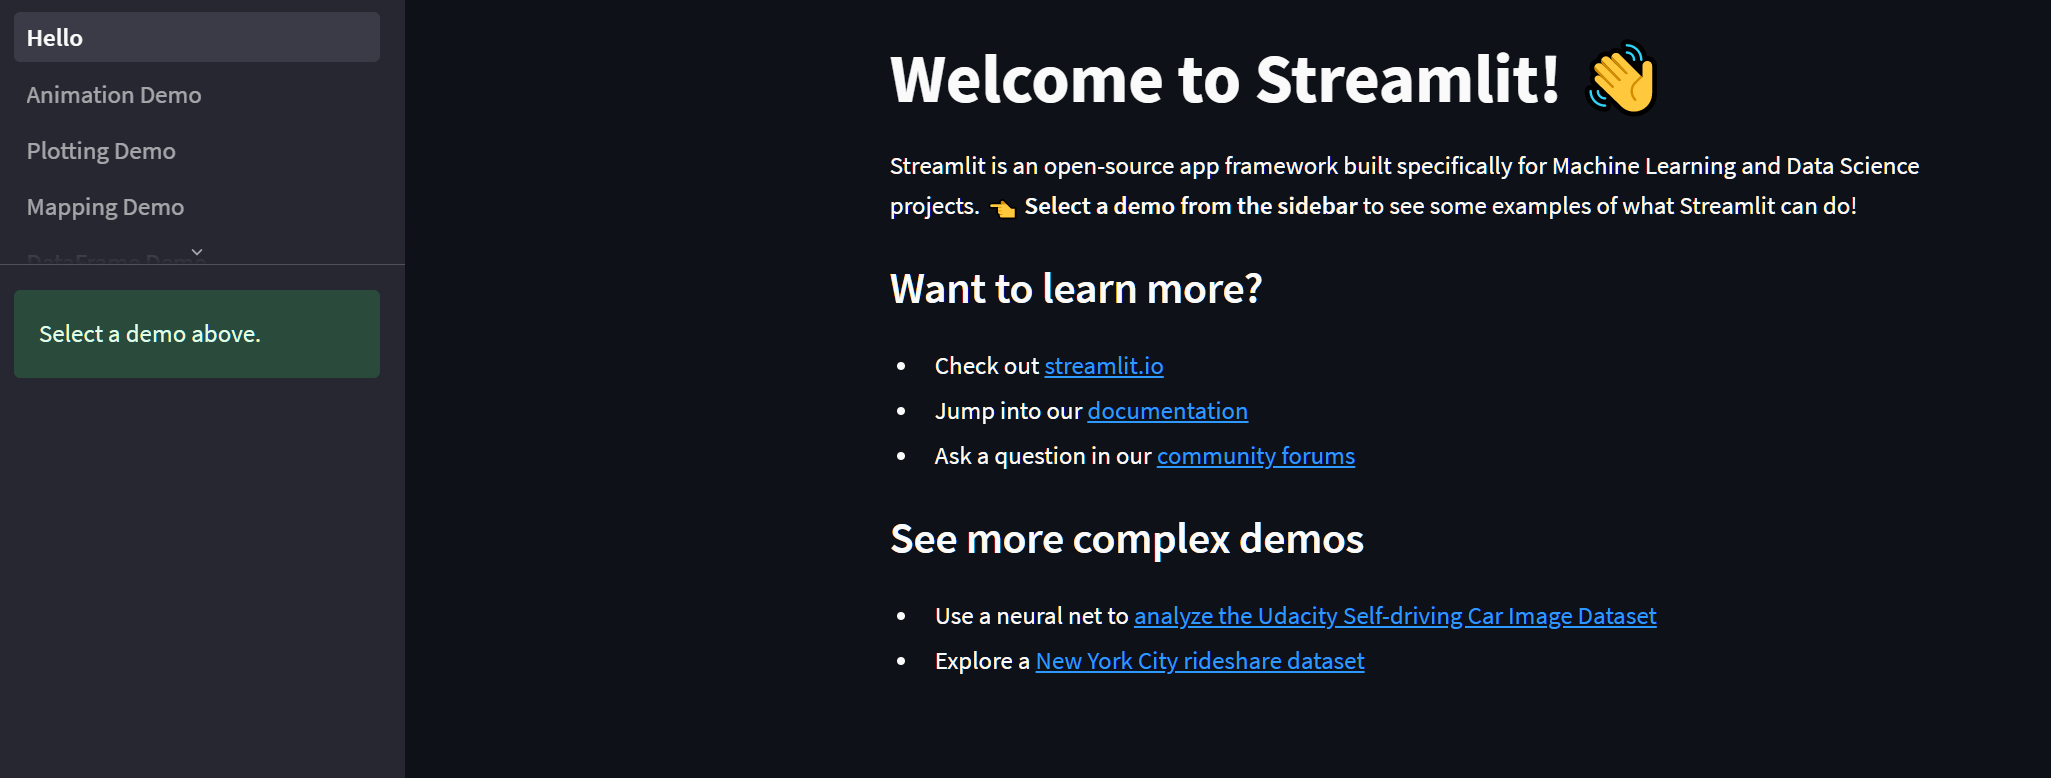
pip install streamlitto install the Streamlit package. You can run the Streamlit demo at this point by typingstreamlit helloin your prompt. Streamlit’s Hello app should appear in a new tab in your web browser!
Install Prophet: Run the command
pip install prophetto install the Prophet library, which will be used for time series forecasting.Create a New Python Script: Open your favourite code editor, personally, I like VS Code and create a new Python script. Save it with a meaningful name, such as
forecast_app.py.
Importing the Required Libraries
In our Python script, we need to import the necessary libraries to build our app. Add the following lines of code at the beginning of your script:
import streamlit as st
import pandas as pd
from prophet import Prophet
The following libraries have been imported:
streamlit: This is the main library used to build the app interface.
pandas: This library is used for data manipulation and analysis, allowing us to work with structured datasets.
prophet: Prophet is a powerful library for time series forecasting developed by Facebook. It will be used to perform the forecasting in our app.
By importing these libraries, we have access to the necessary tools and functionality to build our time series forecasting app.
Define the Forecasting Function
Next, we’ll define a function that performs the time series forecasting using Prophet. Prophet’s documentation has great examples and datasets to get yourself started. The following code uses data and the code from the Prophet getting started walkthrough Here.
Add the following code to your script:
#Load prophet example data into a pandas dataframe
df = pd.read_csv('https://raw.githubusercontent.com/facebook/prophet/main/examples/example_wp_log_peyton_manning.csv')

def forecast(df):
    # Create a Prophet model
    m = Prophet()

    # Fit the model to the data
    m.fit(df)

    # Make future predictions
    future = m.make_future_dataframe(periods=365)
    forecast = m.predict(future)

    #Return the forecast DataFrame
    return forecast
This function takes a DataFrame (df) as input, creates a Prophet model, fits it to the data, and generates future predictions. The forecasted results are returned as a data frame.
Building the Streamlit App
Now, let’s start building the Streamlit app. Add the following code to your script:
def main():
  # Set Streamlit app title and description
  st.title('Time Series Forecasting App')
  st.write('My Forecast Data.')

  forecast_data = forecast(df)

  # Display the forecast output
  st.dataframe(forecast_data)
if __name__ == '__main__':
main()
Here, we define the main() function as the entry point of our app. We set the app title and description using st.title() and st.write(). Next, we call the forecast function and show the results in a streamlit data frame.
To run the app, navigate to the directory where you saved your Python script using the terminal or command prompt. Then, run the following command:
streamlit run forecast_app.py
This command starts the Streamlit development server and launches the app in your web browser.
One thing that I found awesome was how easily you can deploy your app to a hosting platform or cloud service. I used Streamlit Community Cloud to publish mine for free. Equally, you can use the IP Address of running your application locally and share the app with others on the same network as you to gather feedback, collaborate, or showcase your work.
Congratulations on building your Time Series Forecasting App using Streamlit and the Prophet library! Now that you have a functional app, you can further enhance and customize it to suit your specific needs.
My Forecasting App
How satisfying is it to have a data web application up and running with just 30 lines of code? Building upon the guide above, I started exploring the additional possibilities that Streamlit unlocks.
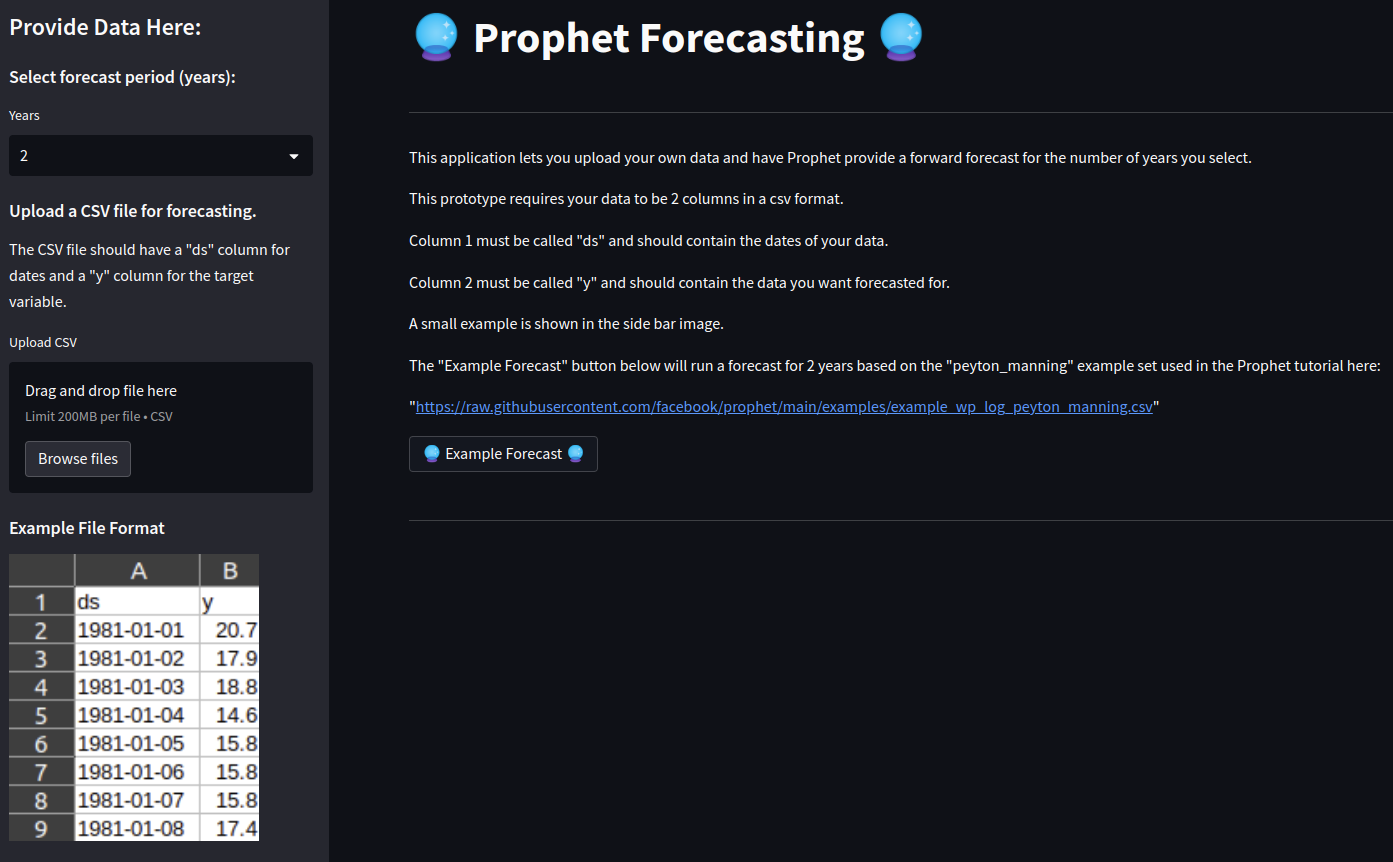
Bring Your Data: I added a simple CSV uploader to the app, allowing you to use your data for forecasting.
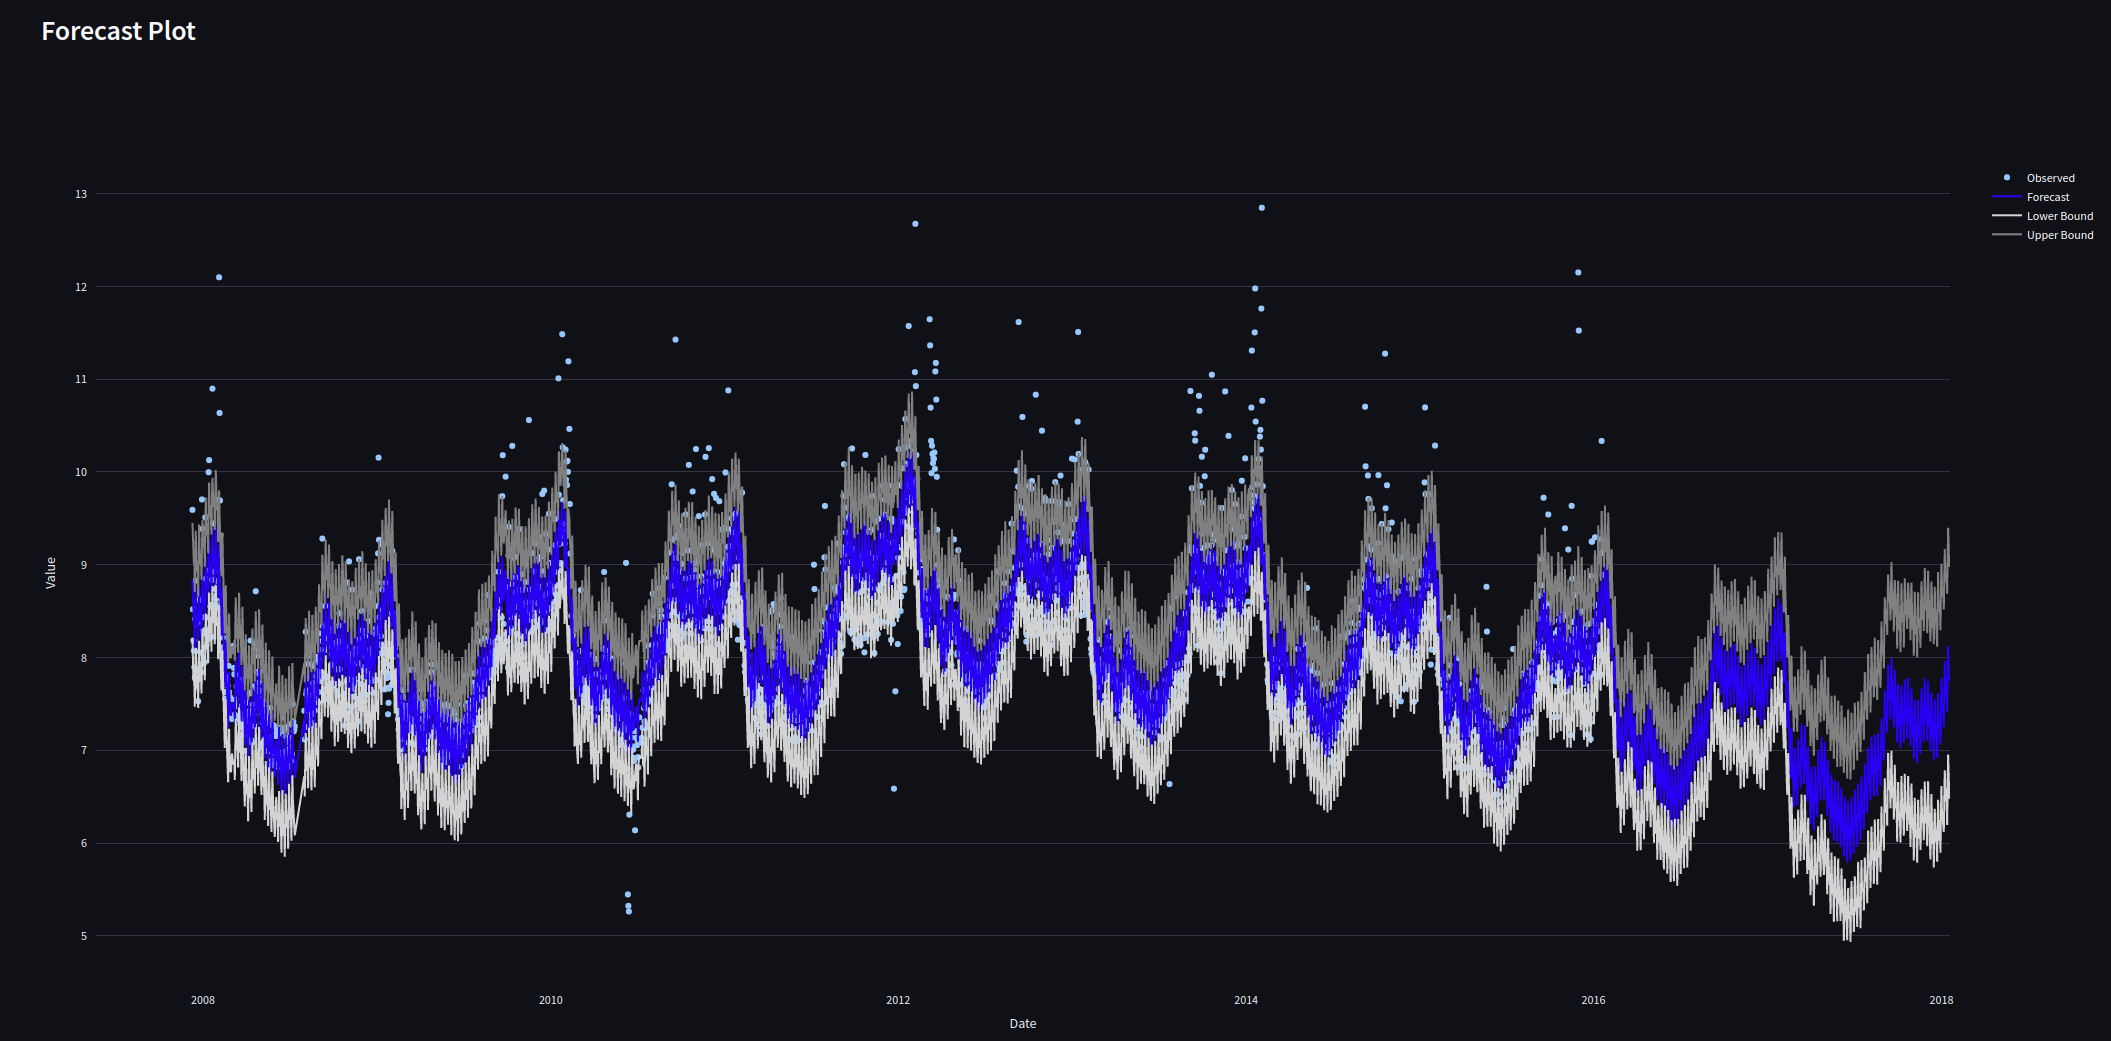
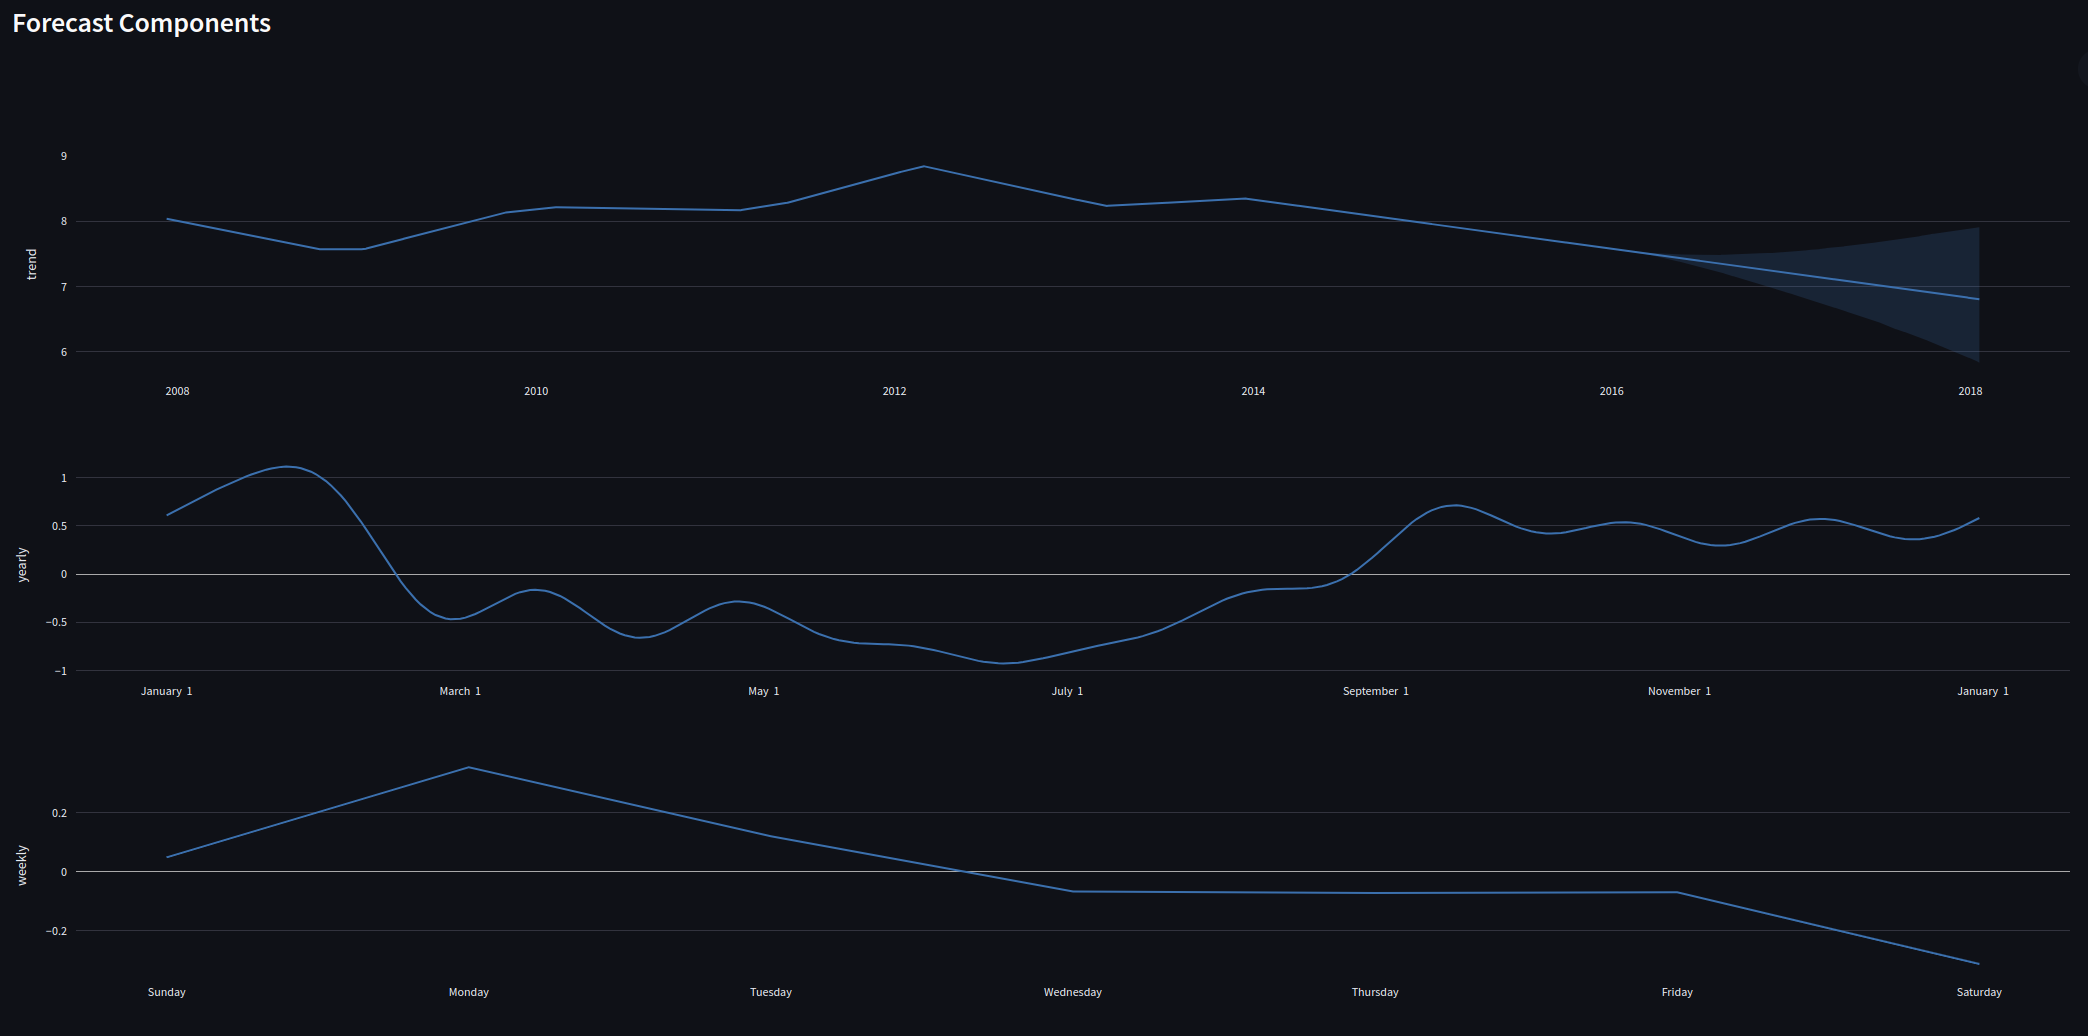
Visualizing Prophet Outputs: I utilized Plotly to display the visualizations generated by Prophet, showcasing the forecasted results in graph form.
Built an Example: I included a Prophet example dataset to demonstrate the capabilities of the app using a sample file at the push of a button.
Streamlit Presentation: I leveraged Streamlit’s sidebar feature, enabling users to customize the number of years to forecast for.

You can access the prototype of my app here
Enhancements and Customizations
I hope this post has encouraged you to explore Streamlit and witness the power of Prophet. Although I developed and deployed the app within an afternoon, there are several areas where it can be enhanced. Here are a few ideas that came to mind:
Additional CSV Flexibility, Validation, and Error Handling: To make the uploader more flexible, I could incorporate validation checks to ensure the uploaded CSV file meets the required criteria. For instance, validating data types, checking for missing values, or enforcing specific constraints on the date range.
User-Defined Parameters: Enabling users to define additional Prophet parameters would provide more customization options for the forecasting process. For example, users could customize seasonality settings, choose different confidence intervals, or specify holidays that may impact the forecast.
Advanced-Data Visualization: I would like to explore different visualization techniques and refine the visual representation of the forecasted results within Streamlit.


Last Words
For a relative beginner to coding Python, the Streamlit library has enabled me to get started with ideas I have had for a long time and make them a reality. The simplicity and speed that Streamlit allows you to create data apps has got me excited to try new and different ways of using data libraries.
I am enjoying how quickly I can experiment, iterate, and explore new features and libraries and make them work for me. The Streamlit community provides extensive documentation, examples, and resources to support you.
Now that you have a foundation for building a Streamlit app, feel free to explore and experiment further. Streamlit’s extensive documentation, examples, and community support are valuable resources to help you unleash the full potential of this powerful library.
Happy forecasting and exploring!
References and links
Streamlit
Prophet
- Prophet Quick Start: Link
If you are like me and enjoy tinkering with data and tech feel free to add me on LinkedIn and follow me here to force me to write more :)
Subscribe to my newsletter
Read articles from David Marquis directly inside your inbox. Subscribe to the newsletter, and don't miss out.
Written by

David Marquis
David Marquis
I am a people leader in the area of data & analytics. I enjoy all things data, cloud & board game related.