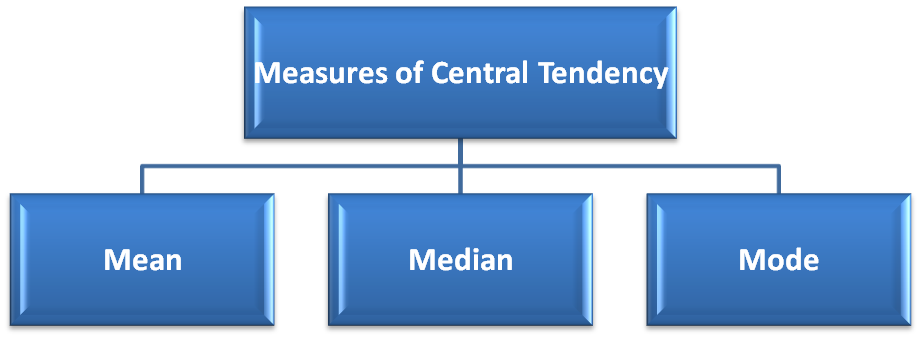
Measures Of Central Tendency in Probability
 Lasya Sighakolli
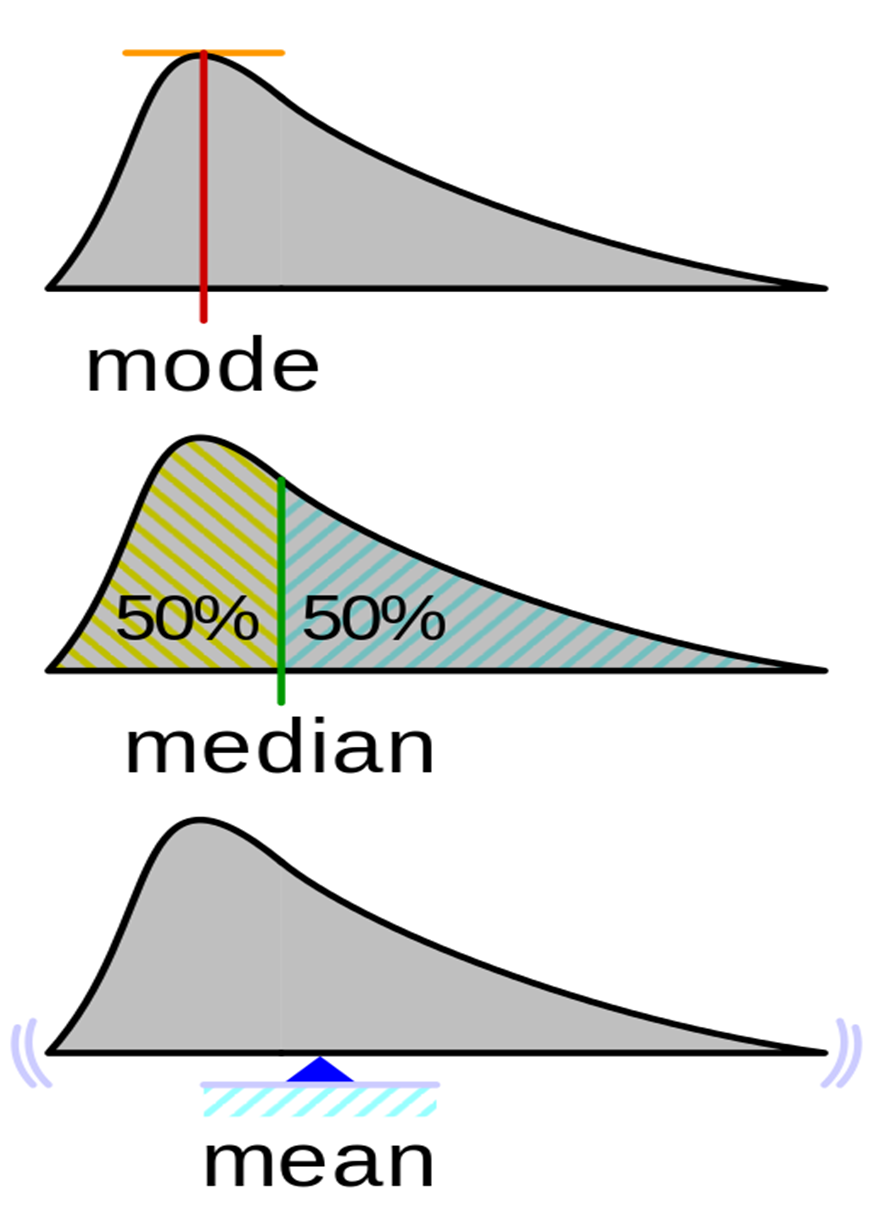
Mean: Mean is the average value after collecting data from a sample. The average is found by adding all observations and dividing by the total number of observations.
Mean=sum f observations/number of observations
Mean=∑xi/n
Example: We have a sample which consists of three observations 5, 4 and 3. The mean of this sample is (5+4+3)/3=12/3=4. The mean of this sample is 4.
Median: The Median is the middle number found by ordering all the observations and picking the one in the middle. If there are two middle numbers take the average of two middle numbers.
Example: The median of 5,1,3 is 3 because when the numbers are in order (1,3,5), the number 3 is in the middle.
The median of 7,3,5,1 is 4 because when the numbers are in order (1, 3, 5, 7 ) the numbers 3 and 5 are middle numbers. Hence take an average of 3 and 5 which is 4.
Mode: It is the most frequently occurring observation in a set of observations. Example: In a set of {5,4,3,1,3,4,3,2} the mode is 3 as it occurs more frequently as compared to other values.

Variance: Variance is how far data is spread out from the actual mean.
Standard deviation: It is the square root of variance.
Probability and Statistics are efficient in building robust and easy predictive machine learning models.
Subscribe to my newsletter
Read articles from Lasya Sighakolli directly inside your inbox. Subscribe to the newsletter, and don't miss out.
Written by
