Confusion Matrix - An easy way to remember and use
 Uday Kiran Kavaturu
If you have ever done logistics regression, then you must be aware of the confusion matrix. The name is so apt for this important machine-learning concept. I used to get so confused trying to make sense of the matrix and the formulas.
I struggled with it for a while until I figured out a way to remember the formulas and their meanings. In this blog post, I attempt to share that with you and I hope you find that helpful. Before we get to the remembering part, let's get into the definitions first.
What is the confusion matrix?
The confusion matrix is a matrix of numbers built on classification machine-learning models. It is one of the most important evaluation tools to assess if the classification model did well. While this matrix can be applied to both binary and multi-class classification problems, for simplicity, let's stick to binary classification for this article.
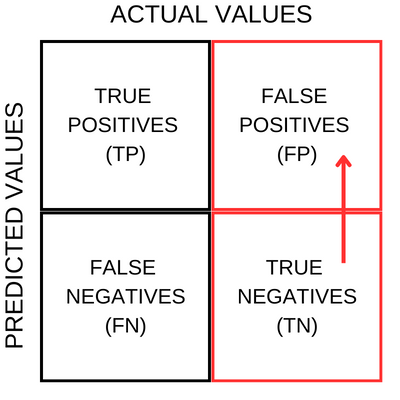
In simple terms, the matrix tells us the numbers of true-positives, false-positives, true-negatives and false-negatives. To understand these, let's pull up a matrix chart.
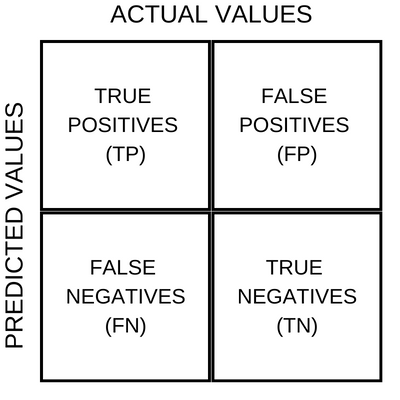
On the X-Axis we have the actual values from a dataset and on the Y-Axis we have the values predicted by a machine-learning binary classifier model. And below are the broad meanings of the four quadrant blocks from the chart above.
TRUE POSITIVES - these are the number of samples which the model predicted as positive, and in reality too they were indeed positive.
TRUE NEGATIVES - these are the number of samples which the model predicted as negative, and in reality too they were indeed negative.
FALSE POSITIVES - these are the number of samples which the model predicted as positive, and in reality, they were negative.
FALSE NEGATIVES - these are the number of samples which the model predicted as negative, and in reality, they were positive.
Are you with me so far? Ok, moving on.
Key metrics
Now, there are numbers in the four quadrants in the matrix, right? If we play around with them we could derive some interesting insights that could be useful in telling how the model is performing.
Accuracy
Let's start with analysing how the model is doing overall. That is, all things aside, let's look at how many samples did the model predict correctly.
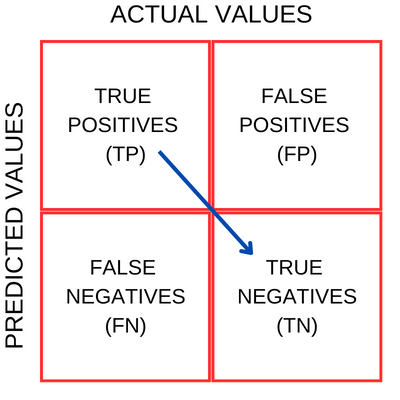
To get this we take the count of correct predictions (true-positives and true-negatives) and divide this number by the total number of samples. This measure is simply called Accuracy.

What does this tell us - Accuracy tells us how the model is able to correctly predict the classes overall*.* It's like a generalised metric and a starting point to look at while evaluating a model.
Where to use this -
Example: Assessing a spam email classifier.
Use case: You want to determine the overall effectiveness of the model in classifying emails as spam or non-spam. Accuracy provides an overall measure of how many emails were correctly classified.
Precision
Precision is this - among the positive predictions, how many were right?
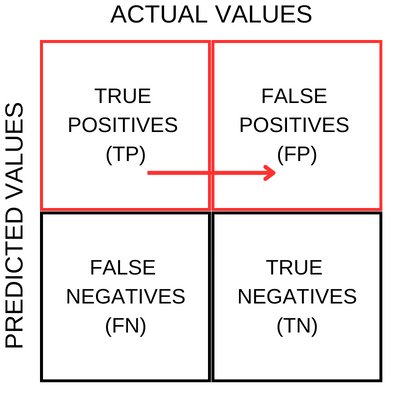
To get this, we take the count of true-positives and divide by the sum of true-positives and false positives.

What does this tell us - Precision indicates how well the model avoids false positive predictions.
Where to use this -
Example: Evaluating a medical model trained for detecting a rare disease.
Use case: In cases where a false positive result could lead to unnecessary treatments or interventions, precision is crucial. High precision ensures that the model minimizes the number of false positives, reducing the chances of unnecessary actions.
Recall a.k.a Sensitivity a.k.a True Positive Rate
Recall is this - among the combination of true positives and false negatives, how many of them were true positives?
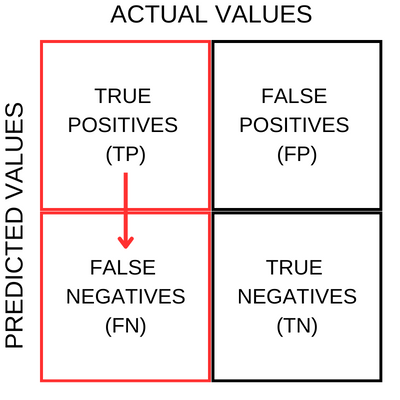
To get this, we take the count of true-positives and divide it by the sum of true-positives and false negatives.

What does this tell us - Recall indicates how well the model avoids false negative predictions.
When to use this -
Example: Assessing a cancer detection model.
Use case: When dealing with potentially life-threatening conditions, such as cancer, it is essential to have a high recall. A high recall value indicates that the model is effectively identifying positive cases, minimizing the chances of false negatives and ensuring that true positive cases are not missed.
Specificity a.k.a True Negative Rate
Specificity is this - among the combination of true negatives and false positives, how many of them were true negatives?
To get this, we take the count of true-negatives and divide it by the sum of true-negatices and false positives.

What does this tell us - Specificity indicates how well the model avoids false positive predictions for negative instances.
When to use this -
Example: Analyzing a credit card fraud detection system.
Use case: In fraud detection, specificity is crucial to avoid falsely flagging legitimate transactions as fraudulent.
When to use what
Here's a quick summary of the previous section
| Metric | When to Use |
| Accuracy | Use when you need an overall measure of the model's correctness and the costs of false positives and false negatives are similar. |
| Precision | Use when the cost of false positives is high, and you want to minimize the chances of falsely identifying negative cases as positive. |
| Recall | Use when the cost of false negatives is high, and you want to minimize the chances of missing positive cases. |
| Specificity | Use when the cost of false positives for negative cases is high, and you want to minimize false alarms or false positive detections. |
How to remember
As I said, I used to find it confusing to remember and interpret the meaning of the above-discussed metrics. So I came up with a system.
Let's look at the confusion matrix chart once again.

Here's my system for remembering the metrics.
I have built an acronym APRS which stands for Accuracy, Precision, Recall, and Specificity. I remember this sequence and built formulas around it.
Let's look at each of the metrics now.
Accuracy
To remember the formula for Accuracy, I use the following notation.

In my head, it looks like this:
Precision
To remember the formula for Precision, I use the following notation. Here q1 is quadrant 1 (top left).

In my head, it looks like this:
Recall
To remember the formula for Precision, I use the following notation.

In my head, it looks like this:
Specificity
To remember the formula for Precision, I use the following notation.

In my head, it looks like this:
So imagine a GIF image cycling through the above patterns and I'm sure you will find it easy to recollect during an exam or an interview. It definitely helped me.
Code Examples
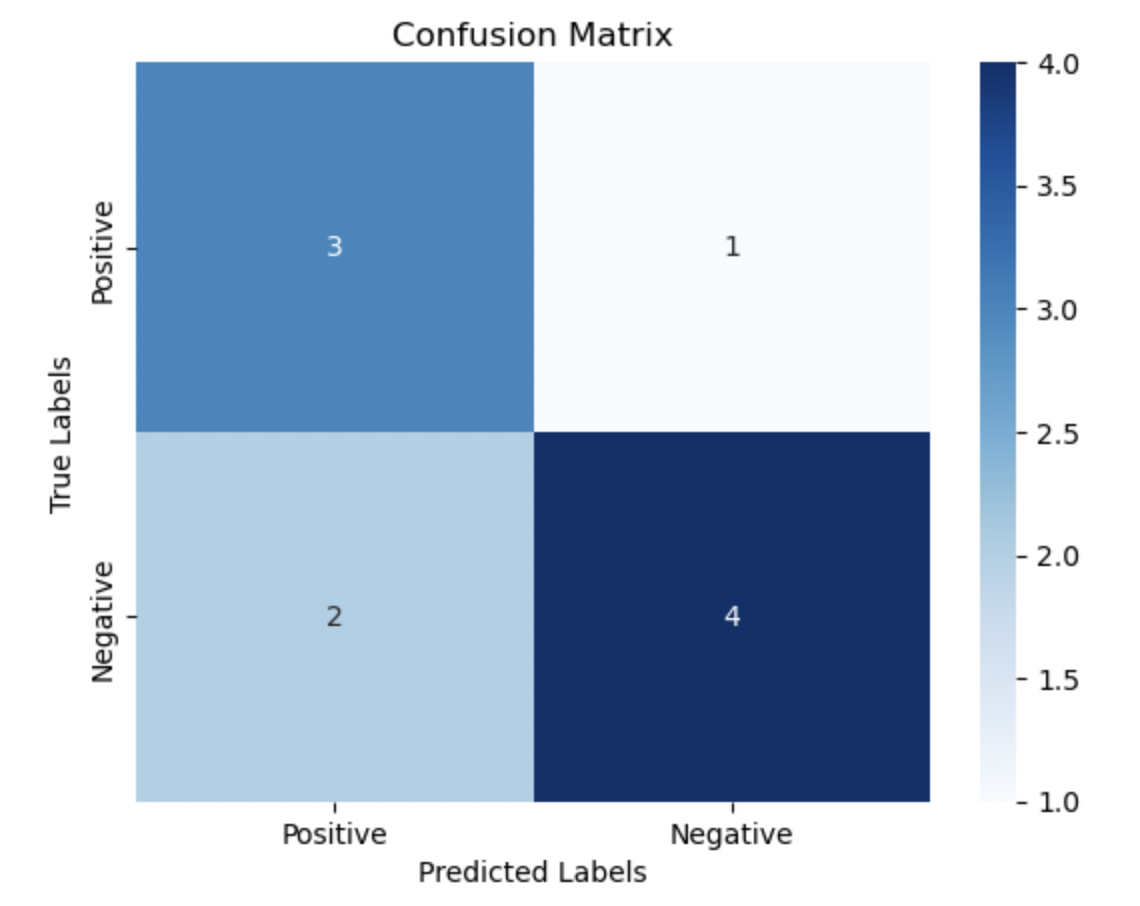
The following is the code to build and visualise the confusion matrix of a binary classification scenario.
import numpy as np
import matplotlib.pyplot as plt
import seaborn as sns
from sklearn.metrics import confusion_matrix

# True labels
y_true = [0, 1, 1, 0, 1, 0, 0, 1, 1, 1]

# Predicted labels
y_pred = [0, 1, 0, 0, 1, 1, 0, 1, 0, 1]

# Compute confusion matrix
matrix = confusion_matrix(y_true, y_pred)

# Create a heatmap visualization
labels = ['Negative', 'Positive']
ax = plt.subplot()
sns.heatmap(matrix, annot=True, fmt="d", cmap="Blues", ax=ax)

# Set labels, title, and axis ticks
ax.set_xlabel('Predicted Labels')
ax.set_ylabel('True Labels')
ax.set_title('Confusion Matrix')
ax.xaxis.set_ticklabels(labels)
ax.yaxis.set_ticklabels(labels)

# Show the plot
plt.show()
Output:
Conclusion
Well, there you go. That's my trick to remember the confusion matrix.
It is also key to remember that the APRS metrics we discussed here aren't the only ones used in the evaluation of classification models. There are other metrics like the F1 score and the ROC Curve which can be used in conjunction with the above metrics for an even better evaluation. However, it largely depends on the context of the problem you are trying to solve.
If you have used the confusion matrix in any of your model building, comment below on what was the use case and how the confusion matrix helped you.
Thank you for reading through this article. Please feel free to leave your comment and if you found this blog useful, do leave a like and I'd highly appreciate it.
Cheers,
Uday
Subscribe to my newsletter
Read articles from Uday Kiran Kavaturu directly inside your inbox. Subscribe to the newsletter, and don't miss out.
Written by

Uday Kiran Kavaturu
Uday Kiran Kavaturu
IIIT-B | CovUni | Passionate AI ML Web Software Engineer | Solves problems through web apps and ML models