Enhancing Data Analysis with PandasAI
 Nitin Agarwal
In the realm of Python libraries, PandasAI is a revolutionary tool that seamlessly integrates generative artificial intelligence capabilities into Pandas, transforming data frames into conversational interfaces. This integration enables users to interact with their data in a more intuitive and natural language-based manner. This blog post aims to provide a comprehensive guide to the basics of PandasAI, demonstrating how it can simplify and enhance your data analysis tasks.
Installation
Kickstarting your journey with PandasAI is as simple as executing a pip command. You can install it using:
pip install pandasai
Getting Started with PandasAI
PandasAI is designed to work in harmony with pandas, not as a replacement. It adds a conversational layer to pandas, enabling you to pose questions to your data in natural language. Here's a glimpse of how it works:
import pandas as pd
from pandasai import PandasAI

# Creating a Sample DataFrame
df = pd.DataFrame({
    "country": ["United States", "United Kingdom", "France", "Germany", "Italy", "Spain", "Canada", "Australia", "Japan", "China"],
    "gdp": [19294482071552, 2891615567872, 2411255037952, 3435817336832, 1745433788416, 1181205135360, 1607402389504, 1490967855104, 4380756541440, 14631844184064],
    "happiness_index": [6.94, 7.16, 6.66, 7.07, 6.38, 6.4, 7.23, 7.22, 5.87, 5.12]
})

# Instantiate a LLM
from pandasai.llm.openai import OpenAI
llm = OpenAI(api_token="YOUR_API_TOKEN")

pandas_ai = PandasAI(llm)
pandas_ai(df, prompt='Which are the 5 happiest countries?')
Executing the above code will yield the following result:
6            Canada
7         Australia
1    United Kingdom
3           Germany
0     United States
Name: country, dtype: object
Delving Deeper with Advanced Queries
PandasAI is not limited to simple queries. It can handle complex questions and perform intricate data manipulations. For instance, you can ask PandasAI to calculate the sum of the GDPs of the two least happy countries:
pandas_ai(df, prompt='What is the sum of the GDPs of the 2 unhappiest countries?')
The above code will return:
19012600725504
Visualizing Data with Charts
PandasAI can also assist with data visualization. You can ask it to draw a graph:
pandas_ai(
    df,
    "Plot the histogram of countries showing for each the gdp, using different colors for each bar",
)
Utilizing Shortcuts for Efficiency
PandasAI provides a set of shortcuts to quickly access the most common queries. These shortcuts are currently in beta, and more will be added in the future. Here are some of the available shortcuts:
clean_data
This shortcut performs data cleaning on the dataframe.
df = pd.read_csv('data.csv')
pandas_ai.clean_data(df)
impute_missing_values
This shortcut imputes missing values in the dataframe.
df = pd.read_csv('data.csv')
pandas_ai.impute_missing_values(df)
generate_features
This shortcut generates features in the dataframe.
df = pd.read_csv('data.csv')
pandas_ai.generate_features(df)
plot_pie_chart
This shortcut plots a pie chart of the dataframe.
df = pd.read_csv('data.csv')
pandas_ai.plot_pie_chart(df, labels = ['a', 'b', 'c'], values = [1, 2, 3])
plot_bar_chart
This shortcut plots a bar chart of the dataframe.
df = pd.read_csv('data.csv')
pandas_ai.plot_bar_chart(df, x = ['a', 'b', 'c'], y = [1, 2, 3])
plot_histogram
This shortcut plots a histogram of the dataframe.
df = pd.read_csv('data.csv')
pandas_ai.plot_histogram(df, column = 'a')
plot_line_chart
This shortcut plots a line chart of the dataframe.
df = pd.read_csv('data.csv')
pandas_ai.plot_line_chart(df, x = ['a', 'b', 'c'], y = [1, 2, 3])
plot_scatter_chart
This shortcut plots a scatter chart of the dataframe.
df = pd.read_csv('data.csv')
pandas_ai.plot_scatter_chart(df, x = ['a', 'b', 'c'], y = [1, 2, 3])
plot_correlation_heatmap
This shortcut plots a correlation heatmap of the dataframe.
df = pd.read_csv('data.csv')
pandas_ai.plot_correlation_heatmap(df)
plot_confusion_matrix
This shortcut plots a confusion matrix of the dataframe.
df = pd.read_csv('data.csv')
pandas_ai.plot_confusion_matrix(df, y_true = [1, 2, 3], y_pred = [1, 2, 3])
plot_roc_curve
This shortcut plots a ROC curve of the dataframe.
df = pd.read_csv('data.csv')
pandas_ai.plot_roc_curve(df, y_true = [1, 2, 3], y_pred = [1, 2, 3])
boxplot
This shortcut plots a box-and-whisker plot using the DataFrame df, focusing on the 'A' column and grouping the data by the 'B' column. The style parameter allows users to communicate their desired plot customizations to the Language Model, providing flexibility for further refinement and adaptability to specific visual requirements.
df = pd.read_csv('data.csv')
pandas_ai.boxplot(df, col='A', by='B', style='Highlight outliers with a x')
rolling_mean
This shortcut calculates the rolling mean of the dataframe.
df = pd.read_csv('data.csv')
pandas_ai.rolling_mean(df, column = 'a', window = 5)
rolling_median
This shortcut calculates the rolling median of the dataframe.
df = pd.read_csv('data.csv')
pandas_ai.rolling_median(df, column = 'a', window = 5)
rolling_std
This shortcut calculates the rolling standard deviation of the dataframe.
df = pd.read_csv('data.csv')
pandas_ai.rolling_std(df, column = 'a', window = 5)
segment_customers
This shortcut segments customers in the dataframe.
df = pd.read_csv('data.csv')
pandas_ai.segment_customers(df, features = ['a', 'b', 'c'], n_clusters = 5)
These shortcuts are designed to make your data analysis tasks even more efficient and intuitive. By using these shortcuts, you can perform complex data operations with just a single line of code. This not only saves time but also makes your code cleaner and easier to read. As PandasAI continues to evolve, more shortcuts will be added to further enhance its capabilities.
Case Study - IPL data 2023
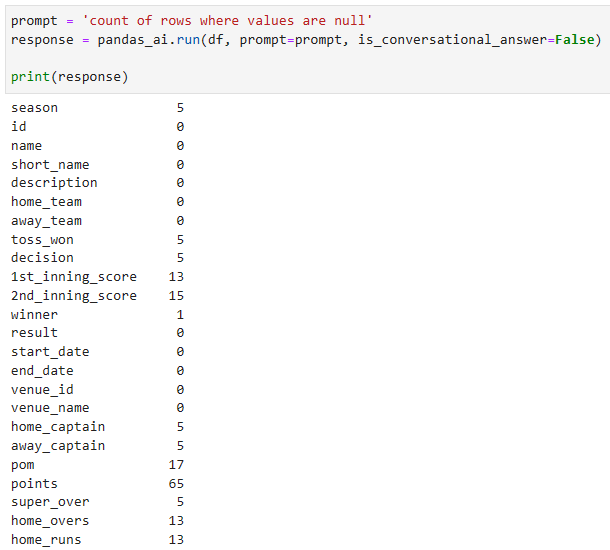
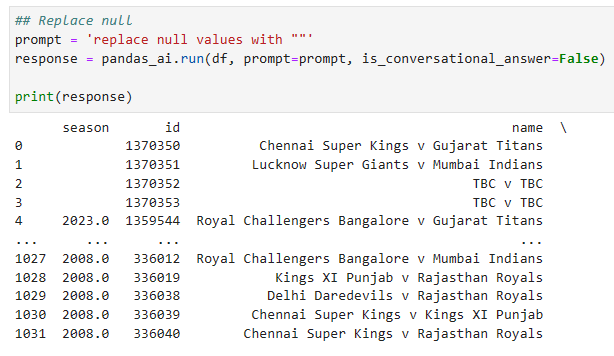
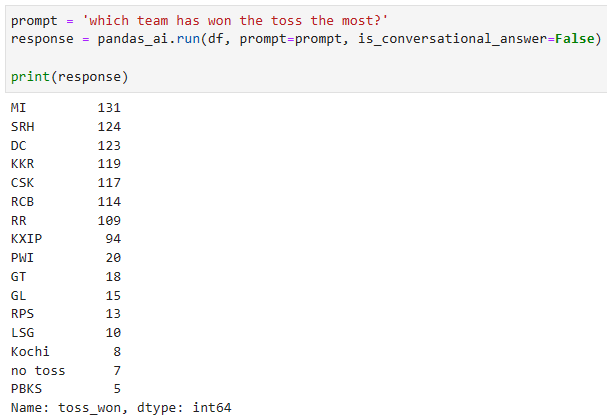
In this case study, we will be analyzing a cricket dataset using the pandas and PandasAI libraries. The dataset contains various details about cricket matches, such as the teams playing, the season, the match description, and more.
In this code, Starcoder model of Huggingface has been used. Here are some sample results.
Data shape

Checking NULL values

Replacing NULL values

Unique Values

Insights - Most Toss wins

Refer to the detailed case study notebook. I will be adding more case studies in the upcoming days.
Conclusion
In this guide, we delved into the PandasAI library, understanding its advanced structure. This tool provides a handy way for users to query their data without requiring in-house training of the Large Language Models (LLMs). Despite its numerous applications, users should be aware that the code generated by LLMs can sometimes yield unexpected results.
PandasAI (git repo) is a dynamic project under active development, promising continuous improvements and exciting new features, thanks to its dedicated contributors.
Subscribe to my newsletter
Read articles from Nitin Agarwal directly inside your inbox. Subscribe to the newsletter, and don't miss out.
Written by

Nitin Agarwal
Nitin Agarwal
Data Scientist with 12 years of industry experience.