Descriptive Statistics
 Nitin Agarwal
Descriptive statistics is a fundamental branch of statistics that provides tools and techniques to summarize and describe datasets. By calculating measures of central tendency, dispersion, and visualizing data, data scientists can gain valuable insights and identify patterns.
Measures of Central Tendency
Measures of central tendency aim to identify the center or average value of a dataset. The three commonly used measures are:
Mean: The mean is calculated by summing all the values in a dataset and dividing it by the number of observations. It is highly sensitive to outliers.
Median: The median represents the middle value when the dataset is arranged in ascending or descending order. It is more robust to outliers compared to the mean.
Mode: The mode refers to the value or values that occur most frequently in a dataset. It is particularly useful for categorical or discrete data.
Applications: Measures of central tendency provide insights into the typical or representative value of a dataset. They are commonly used in various fields, such as market research, social sciences, and finance, to analyze trends, assess average performance, or understand the distribution of data.
Python Implementation: In Python, the numpy library offers functions to compute measures of central tendency. The following code snippet demonstrates how to calculate the mean, median, and mode of a dataset using numpy:
import numpy as np
from scipy import stats as st
data = [10, 20, 40, 40, 50, 60, 70]

mean = np.mean(data)
median = np.median(data)
mode = st.mode(data)

print("Mean:", mean)
print("Median:", median)
print("Mode:", mode.mode[0])
output:
Mean: 41.42857142857143
Median: 40.0
Mode: 40
Measures of Dispersion
Measures of dispersion quantify the spread or variability of data points within a dataset. The three commonly used measures are:
Variance: Variance measures the average squared difference of each data point from the mean. It provides insights into how much the data points deviate from the mean.
Standard Deviation: Standard deviation is the square root of the variance. It indicates the average distance between each data point and the mean. It is widely used due to its intuitive interpretation.
Range: The range is the difference between the maximum and minimum values in a dataset. It provides a simple measure of spread but is highly influenced by outliers.
Applications: Measures of dispersion are crucial for understanding the variability and distribution of data. They help identify the degree of uncertainty, assess the consistency of data, and detect outliers or abnormal observations.
Python Implementation: The numpy library in Python provides functions to calculate measures of dispersion. The following code demonstrates how to compute variance, standard deviation, and range using numpy:
import numpy as np

data = [10, 20, 30, 40, 50, 60, 70]

variance = np.var(data)
std_deviation = np.std(data)
data_range = np.ptp(data)

print("Variance:", variance)
print("Standard Deviation:", std_deviation)
print("Range:", data_range)
output:
Variance: 400.0
Standard Deviation: 20.0
Range: 60
Data Visualization
Data visualization techniques play a crucial role in descriptive statistics to effectively communicate insights. Two common visualization methods are:
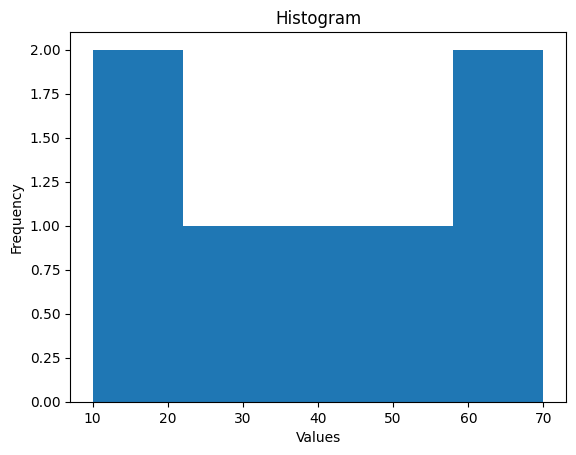
Histogram: A histogram is a graphical representation of the distribution of numerical data. It displays the frequency or count of data points within predefined intervals or bins.
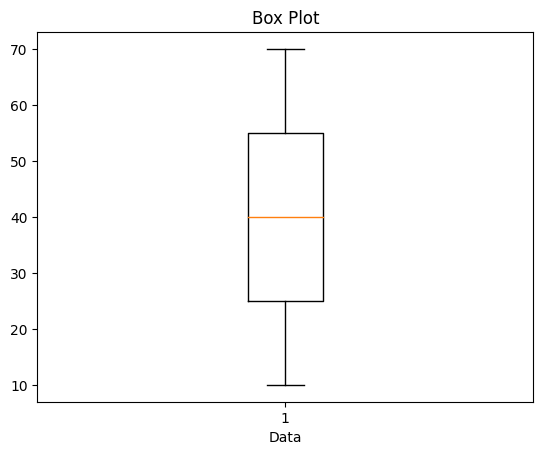
Box Plot: A box plot provides a visual summary of the distribution of data, including the median, quartiles, and potential outliers. It helps identify skewness, symmetry, and the presence of extreme values.
Applications: Data visualization techniques aid in understanding the shape, distribution, and characteristics of data. They assist in identifying patterns, outliers, and making informed decisions based on visual cues.
Python Implementation: Python's matplotlib library offers functions to create histograms and box plots. The following code snippet demonstrates their implementation:
import matplotlib.pyplot as plt

data = [10, 20, 30, 40, 50, 60, 70]

# Histogram
plt.hist(data, bins=5)
plt.xlabel("Values")
plt.ylabel("Frequency")
plt.title("Histogram")
plt.show()

# Box Plot
plt.boxplot(data)
plt.xlabel("Data")
plt.title("Box Plot")
plt.show()
output:


Conclusion
Descriptive statistics play a vital role in understanding datasets by providing measures of central tendency, dispersion, and visualizations. In this article, we explored key concepts, and applications, and provided Python implementation codes for descriptive statistics. By leveraging these techniques, data scientists can gain valuable insights and make informed decisions based on the characteristics of the data at hand.
Subscribe to my newsletter
Read articles from Nitin Agarwal directly inside your inbox. Subscribe to the newsletter, and don't miss out.
Written by

Nitin Agarwal
Nitin Agarwal
Data Scientist with 12 years of industry experience.