Statistical Functions
 Onasanya Victor Oluwatimileyin
Today, I learned about statistical functions, and it was fascinating. I went through the following areas:
COUNT
AVERAGE/MEDIAN/MODE
MIN/MAX
PERCENTILE
STANDARD DEVIATION
VARIANCE
RANK
SMALL/LARGE
RAND/RANDBETWEEN
SUMPRODUCT
COUNTIFS/SUMIFS/AVERAGEIFS
It looks bulky, but don't worry; the explanations will be short.
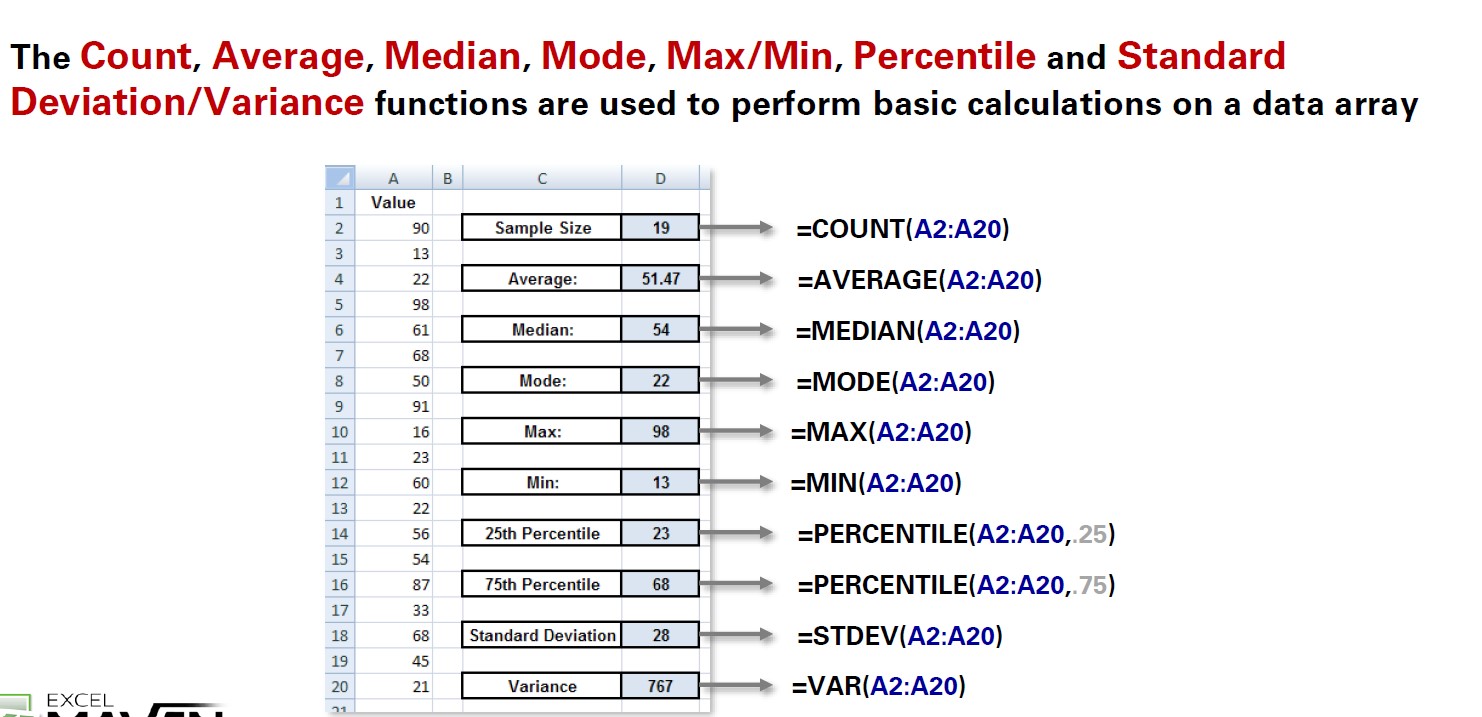
The screenshot below explains COUNT to VARIANCE.

The RANK and SMALL/LARGE functions are explained below:

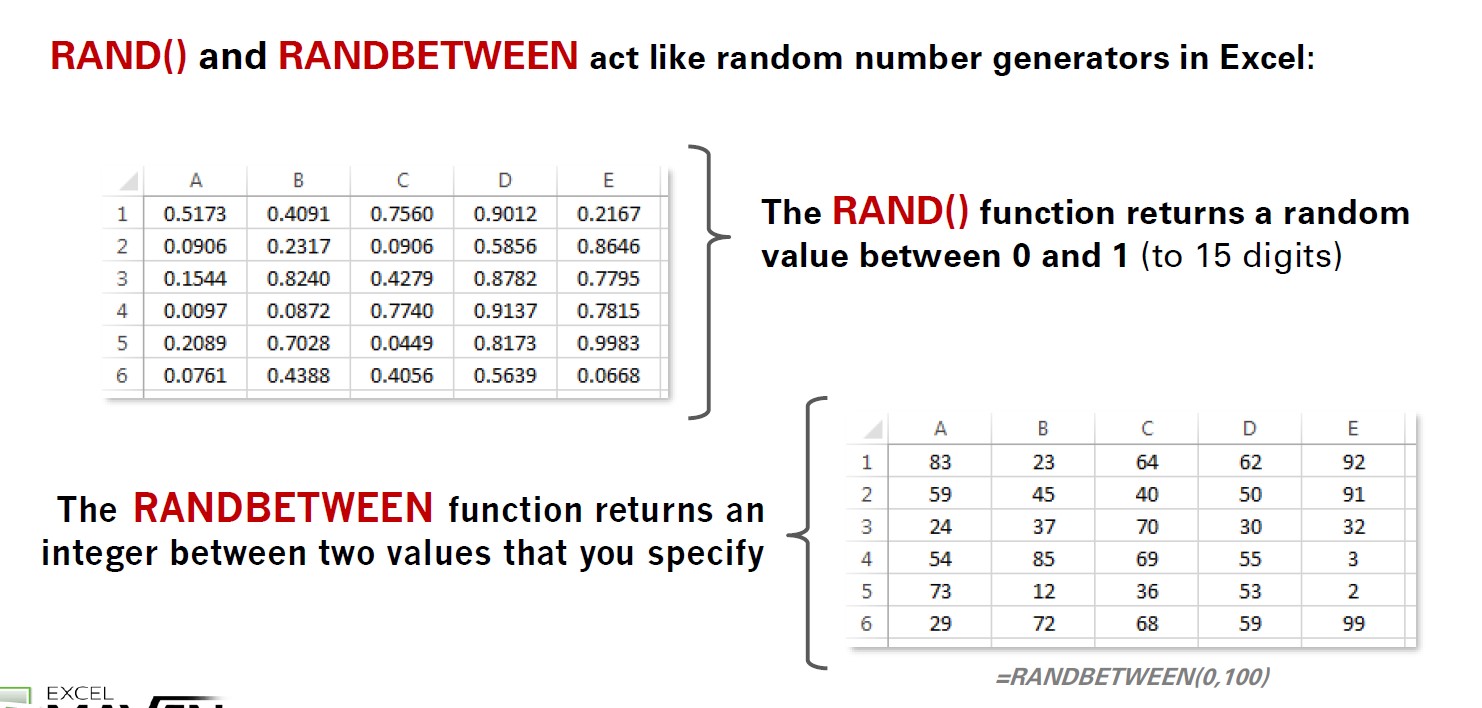
RAND and RANDBETWEEN functions generate random numbers; RAND between 0 and 1, and RANDBETWEEN between two specified numbers.

Now, onto the ones I found most exciting:
SUMPRODUCT
| A |
|
|
|
|
| B |
|
|
| Quantity | Price | Revenue |
|
|
| Quantity | Price | Revenue |
| 2 | $0.50 | $1.00 |
|
|
| 2 | $0.50 |
|
| 4 | $1.00 | $4.00 |
|
|
| 4 | $1.00 |
|
| 3 | $0.80 | $2.40 |
|
|
| 3 | $0.80 |
|
Total |
|
| $7.40 |
|
| Total |
|
| $7.40 |
For example, we want to find the total revenue in the above dataset. While we could try method A, multiplying each quantity by its corresponding price, then adding everything together, the SUMPRODUCT function allows us to do this all at once. The function is written as:
=SUMPRODUCT(array 1,array 2)
The arrays refer to the cell references of values under quantity and price.
COUNTIFS/SUMIFS/AVERAGEIFS
These functions are used to get a count, sum, or average based on multiple conditions. The functions are written as follows:
=COUNTIFS(criteria range 1, criteria 1, criteria range 2, criteria 2...)
=SUMIFS(sum range, criteria range 1, criteria 1, criteria range 2, criteria 2...)
=AVERAGEIFS(average range, criteria range 1, criteria range 1, criteria range 2, criteria 2...)
Note: “sum range” and “average range” are the range of the values you added up and averaged.
Let’s check out the table below.
| A | B | C | D |
1 | Month | Tactic | Campaign | Clicks |
2 | Jan | Search | 166 | |
3 | Jan | Search | MSN | 263 |
4 | Jan | Display | Contextual | 289 |
5 | Jan | Display | Retargeting | 137 |
6 | Feb | Search | 124 | |
7 | Feb | Search | MSN | 311 |
8 | Feb | Display | Contextual | 350 |
9 | Feb | Display | Retargeting | 384 |
10 | Mar | Search | 168 | |
11 | Mar | Search | MSN | 358 |
12 | Mar | Display | Contextual | 347 |
13 | Mar | Display | Retargeting | 390 |
Here, I want to know how often clicks exceeded 200 with the tactic "Search". Additionally, I want the sum of clicks in February under the tactic "Display". Lastly, I want to get the average number of clicks in January with the "MSN" campaign method. The formula would be written as follows:
COUNTIFS =COUNTIFS(B2:B13,B2,D2:D13, ">200") = 3
SUMIFS =SUMIFS(D2:D13,A2:A13,A7,B2:B13,B5) = 734
AVERAGEIFS =AVERAGEIFS(D2:D13, A2:A13, A2, C2:C13,C3) = 263
That's all for now. Please read through it and let me know what you think.
Subscribe to my newsletter
Read articles from Onasanya Victor Oluwatimileyin directly inside your inbox. Subscribe to the newsletter, and don't miss out.
Written by

Onasanya Victor Oluwatimileyin
Onasanya Victor Oluwatimileyin
I'm a Christian, from Ogun State, Nigeria. 🙂 Passionate about bettering my digital skills. I also write articles on the side too.