Probability For Mastering Data Science - Part 5
 Naymul Islam
In the previous part, we covered The Normal Distribution and The Standard Normal Distribution Today we are gonna explore some more Continuous Distribution.
Continuous Distribution: The Student’s T-Distribution👇
We use “t(k)” to define the student's T-distribution.

The student’s t-distribution is a small sample size approximation of a Normal Distribution
Certain characteristics + sufficient data = Normal Distribution
Certain characteristics = student’s t-distribution
For example-
The average lap times for the entire season of a formula one race follow a normal distribution, but the lap times for the first lap of the Monaco grand prix would follow a student’s t-distribution
The curve of a student’s t-distribution is also bell-shaped and symmetric.
Another key difference between the student’s t-distribution and the normal one is that apart from the mean and variance we must also define the degrees of freedom for the distribution
The expected value of student’s t-distribution -
If k > 2
Then,

The variance of student’s t-distribution -
If k > 2
s² = the variance of the sample

The student’s t-distribution is frequently used when conducting statistical analysis
It plays a major role when we want to do hypothesis testing, with limited data, since we also have a table summarizing the most important value of its CDF.
Continuous Distribution: The Chi-Squared Distribution👇
We denote the chi-squared distribution following way-


Very few events in life follow such a distribution
Chi-squared is most featured in statistical analysis when doing hypothesis testing and computing confidence intervals.
We most commonly find it when determining the goodness of fit of categorical values.
The graph of chi-squared distribution is not symmetric but rather asymmetric. Its graph is highly skewed to the right-
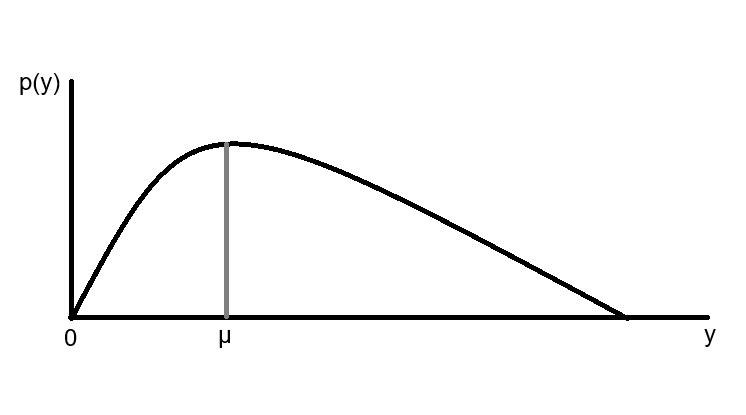
Furthermore, the values depicted on the x-axis start from 0 rather than negative numbers.
A convenient feature of the chi-squared distribution is that it also contains a table of known values just like the normal(N) or student’s t-distribution(T).
The expected value of any chi-squared distribution-

The variance of any chi-squared distribution -

Continuous Distribution: The Exponential Distribution👇
We define the exponential distribution with “Exp(λ)”

Variables that mostly closely follow an exponential distribution are ones with a probability that initially decreases before eventually plateauing
Graphically, the PDF of such a function would start off very high and sharply decrease within the first few timeframes-
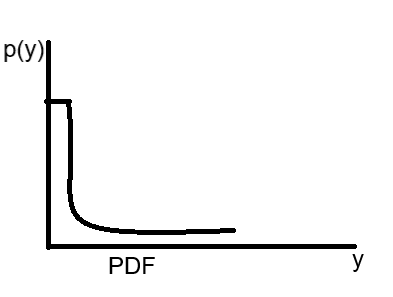
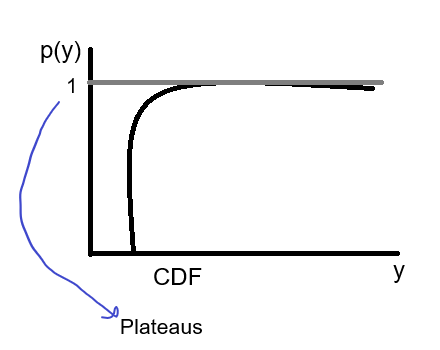
To define an exponential distribution we require a rate parameter(λ)
Rate parameter → λ
This parameter determines how fast the CDF curve reaches the point of plateauing and how spread out the graph is.
The expected value of an exponential distribution is -

The variance of an exponential distribution is -

However, unlike the normal or chi-squared distributions, we do not have a table of the known variable for it which is why sometimes we prefer to transform it.
Generally, we can take the natural logarithm of every set of an exponential distribution and get a normal distribution -

It is one of the most common transformations.
Continuous Distribution: The Logistic Distribution👇
We denote the logistic distribution with the entire word logistic like-


For example -
We can analyze whether the average speed of a tennis player's serve plays a crucial role in the outcome of the match.
Expectation: sending the ball with higher velocity leaves opponents with a shorter period to respond.
Reality: To reach that highest speed tennis players often give up some control over the shot, so they are less accurate
Therefore, we can assume there is a linear relationship between point conversion and serve speeds.
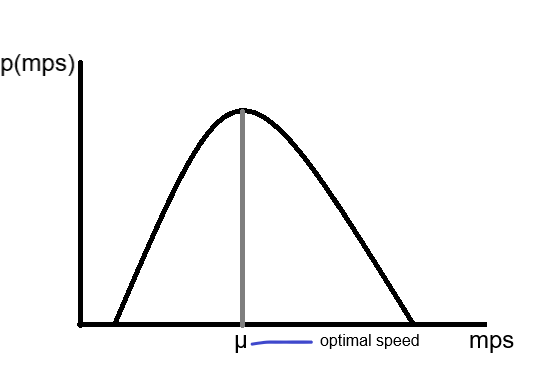
The graph of the PDF of a logistic distribution would like similar to the normal distribution
The graph of the logistic distribution is defined by two key features its mean and its scale parameter.
Mean:
Scale Parameter:
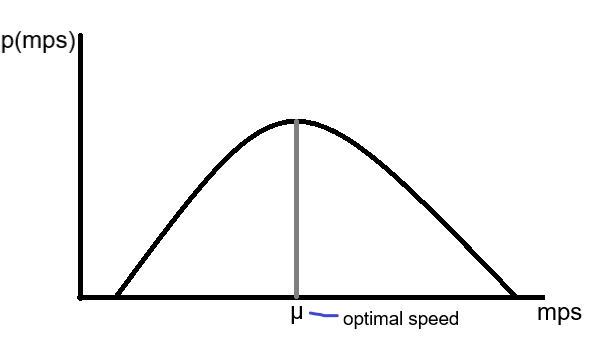
For tennis example,(µ) would represent the optimal speed while the scale would dictate how lenient we can be hit.
The CDF should be a curve that starts off slow but picks up rather quickly before plateauing around the 1 mark, that’s because once we reach values near the mean the probability drastically goes up.
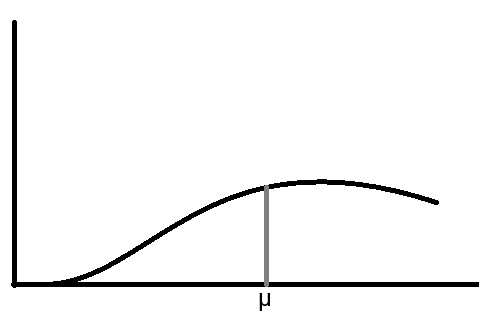
The scale would dictate the shape of the graph. In this case, the smaller the scale, the later the graph starts to pick up, but the quicker it reaches values close to 1.
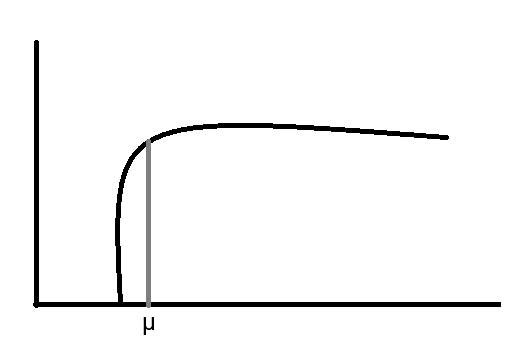
We can use expected value to estimate the variance of the distribution
The expected value of the logistic distribution is-

The variance of the logistic distribution is -


Probability in Finance👇
What is Option Pricing?👇
The option is an agreement between two parties for the price of a stock or item at a future point in time. it allows one of the sides to decide whether to go through with the deal at a later date.
Probability in Statistics👇
What is Statistic?👇
The term statistic is the sample equivalent of characteristics for a population data set
The field of statistics focuses predominantly on sample and incomplete data.
A confidence interval or CI uses sample data to define a range with an associated degree of certainty these degrees of certainty are usually 90%,95% or 99% and express the likelihood of the population mean being within that interval.
To calculate the confidence intervals we must know what mean, variance and standard deviation are.
A hypothesis is an idea that can be tested.
3 crucial requirements for hypothesis testing are mean, variance and type of the destination.
The statistic is the natural expression of probability.
Before we end…
Thank you for taking the time to read my posts and share your thoughts. If you like my blog please give a like, comment and share it with your circle and follow for more I look forward to continuing this journey with you.
Let’s connect and grow together. I look forward to getting to know you better.
Here are my socials links below-
Linkedin: https://www.linkedin.com/in/ai-naymul/
Twitter: https://twitter.com/ai_naymul
Github: https://github.com/ai-naymul
Subscribe to my newsletter
Read articles from Naymul Islam directly inside your inbox. Subscribe to the newsletter, and don't miss out.
Written by

Naymul Islam
Naymul Islam
👉 I'm an ML Research 7 Open-Source Dev Intern at Menlo Park Lab. 👉 I'm a Machine Learning and MLOps Enthusiast. 👉 I’m One Of The Semi-Finalist Of The Biggest ICT Olympiad In Bangladesh Called “ICT Olympiad Bangladesh” In 2022. 👉 I've More Than 15 Google Cloud Badges. ⭐️ Wanna Know More About Me? Drop Me An Email At: naymul504@gmail.com ★