Building a CKAN Release Timeline
 Mueez Khan
A version of this blog post has also been republished on datHere's blog.
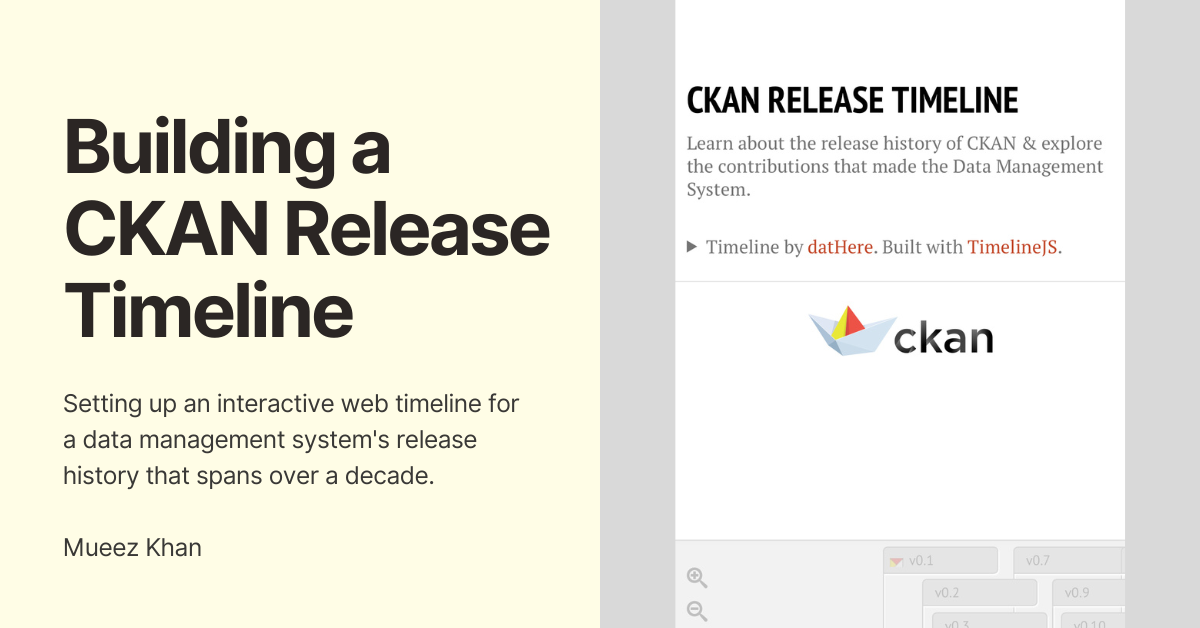
Let's walk through the process of setting up this interactive timeline (embedded below) based on CKAN's version release history.
Background
While exploring new tools for developing my monthly presentation as a Data Engineering Intern at datHere, I found TimelineJS while searching on GitHub for showcasing my work in a timeline format. I customized the timeline styles locally and integrated the timeline as the final slide in my presentation I built with sli.dev.
During the presentation, our team at datHere decided to make a timeline using TimelineJS for the open-source data management system CKAN as part of the Pathways to Enable Open-Source Ecosystems (POSE) project.
Setting Up the Timeline Template
TimelineJS has step-by-step instructions on how to make a timeline website using a spreadsheet from Google Sheets as your data source, so I simply followed the steps:
Your timeline website also updates after making changes to the spreadsheet, and by following the steps you'll get a link to your hosted timeline and embed code for inserting the timeline in blog posts, websites, and more.
Considering our Options
There are two main ways to import data into a timeline: Google Sheets or JSON. Considering Google Sheets to be more user-friendly and collaborative than working on a JSON file locally, we decided on the former as our data source.
But two questions remained:
From where should we source the CKAN release history?
How do we convert the changelog data to a usable format for our spreadsheet?
Sourcing the Release Data
An initial suggestion from the team was to gather the commit history from the repository and port them into the timeline. As of the time of writing this article, there are 24,906 commits in the master branch of the ckan/ckan GitHub Repository. This would result in a timeline that could be hard to follow (commit messages aren't always the most descriptive) were we to continue with this idea without further improvements (e.g. using a large-language model to generate release summaries based on the commit data).
Conveniently, there is a CHANGELOG.rst file in the GitHub repository for CKAN consolidating all release versions including each of their dates and changes made in a more readable format. The file is written in a format similar to Markdown, so I decided to build a Python script.
Converting the Changelog Data to CSV format
The following is the final iteration of a Python script to convert the CHANGELOG.rst data into CSV format which we could import into our spreadsheet.
import csv
import markdown

# Generate a list from a file for importing into a CSV
def extract_data(file_path):
    # Open the .rst file
    with open(file_path, 'r') as file:
        # Generate a string list of each line from the .rst file
        lines = file.readlines()

    # List of each release's data to import into CSV
    data = []
    # Row values for each column in the CSV
    year = ''
    month = ''
    day = ''
    headline = ''
    text = ''

    # Loop through each line in the .rst file
    for line in lines:
        # Remove starting and ending whitespaces (if any)
        line = line.strip()

        # Line starts with v or v. followed by a number (v2 or v.2)
        if (line.startswith('v') and line[1].isdigit()) or (line.startswith('v.') and line[2].isdigit()):
            # Append the accumulated data for the previous version to the list
            data.append([year, month, day, headline, text])
            # Reset the text for writing the current version's changes
            text = ''
            # Extract the release version and date information
            headline = line.split()[0]
            datetime = line.split()[1]
            year, month, day = datetime.split('-')
        # Ignore lines starting with '=' (section headers)
        elif line.startswith('='):
            continue
        # Accumulate the lines between release versions into the text variable
        else:
            # Convert the current line to HTML
            text += markdown.markdown(line) + '\n'

    # Append the last release version's data to the data list
    data.append([year, month, day, headline, text])

    return data

# Write the extracted release data to a CSV file
def write_to_csv(data, output_file):
    # Create or overwrite a CSV file
    with open(output_file, 'w', newline='') as file:
        # Instantiate a CSV file writer object
        writer = csv.writer(file)
        # Write the header row in the same format as the Google Sheet
        writer.writerow(['Year', 'Month', 'Day', 'Headline', 'Text'])

        # Write each release to the CSV file as a row
        for row in data:
            writer.writerow(row)

# Example usage
file_path = 'CHANGELOG.rst'
output_file = 'output.csv'

# Extract data from the .rst file
file_data = extract_data(file_path)
# Write the data to a .csv file
write_to_csv(file_data, output_file)
The first iteration of the script did not convert the data into HTML format but instead provided the raw changelog output. We learned that TimelineJS allows for rendering HTML in certain columns including a row's Text field, which includes the description for a release of CKAN. Therefore, I used the markdown package to convert each line into HTML format since the input was akin to Markdown styling.
Caveats
There are some caveats with this method of conversion.
Most of the timeline had formatting but there are places with custom formatting and other syntax (perhaps related to
.rstformat or for rendering the data on a changelog page on CKAN's docs site) that were not covered in the conversion properly.Since we're converting the document to HTML line by line, the output can result in redundancy (like using a separate
<ul>for each<li>), though this is fine since we can reuse the script by writing the release description in Markdown if revising it.Versions 0.1 and 0.2 did not have a
dayvalue so they were removed from CHANGELOG.rst and manually inputted into the timeline (though this can be fixed by editing the script).The timeline is not in sync with the
CHANGELOG.rstfile, so any modifications made would need to be updated in the Google Sheet including new version releases. An automation system is definitely possible though.Not all releases have been manually verified, and there may be formatting issues due to .rst and .md having similarities and differences in syntax.
Regardless, the output CSV was usable for importing into the spreadsheet and can be updated by reusing the script or directly within the timeline. Simply copying and pasting each column's data from the CSV to the same named column in the Google Sheets spreadsheet worked well!
I also added eras to the timeline which add colors for the major release sections such as v0.X/v1.X/v2.X Releases.
Conclusion
The timeline was presented at the July CKAN Monthly Live by the POSE team to members of the CKAN community. You can view the timeline at the top of this blog post, a more succinct outline of the major/minor releases on this blog post from POSE & datHere, and thanks to the team at datHere for also working on the CKAN release timeline.
Subscribe to my newsletter
Read articles from Mueez Khan directly inside your inbox. Subscribe to the newsletter, and don't miss out.
Written by

Mueez Khan
Mueez Khan
I'm a software developer who enjoys building projects and sharing what I learn occasionally at blog.mueezkhan.com. I work with technologies in software engineering and full-stack apps involving Next.js & React, and infrastructure programming with Terraform. I enjoy using Python & TypeScript/JavaScript, and am learning Rust and more.
