Setting Up Devtron on Kubernetes Cluster
 Anusha
Devtron is a production-ready Kubernetes-native Application Management Platform that covers all your requirements on Kubernetes, such as continuous integration, continuous delivery, GitOps, observability, troubleshooting, security, and governance.
I heard about Devtron first at KCD Bengaluru and I couldn't help but get excited when I was told that Devtron could manage your application requirements on Kubernetes end to end. I had to give it a try already.
Pre-Requisites
kubectl Installation (On Windows), Refer Install Tools | Kubernetes for MacOS / Linux.
curl.exe -LO "https://dl.k8s.io/release/v1.27.3/bin/windows/amd64/kubectl.exe"helm Installation, download helm release based on your system, Releases · helm/helm (github.com)
Skip this step if you already have kubectl and helm installed
Setup
Create a 2-Node k8s Cluster from your preferred provider, in this article - I'll be using Digital Ocean.
Minimum system configurations required for Devtron Installation
1.2 vCPUs
2.4GB+ of free memory
3.20GB+ free disk space
I'll be choosing node size with 2.5GB RAM(usable 4GB)/2vCPU configuration with two of them

Once your cluster is up and running, check the node status

Install Devtron with CI/CD along with GitOps (Argo CD)
  helm repo add devtron https://helm.devtron.ai

  helm install devtron devtron/devtron-operator \
  --create-namespace --namespace devtroncd \
  --set installer.modules={cicd} \
  --set argo-cd.enabled=true
You'll get instructions like the below screenshot after running the above command

Get the status of all pods in the devtroncd namespace
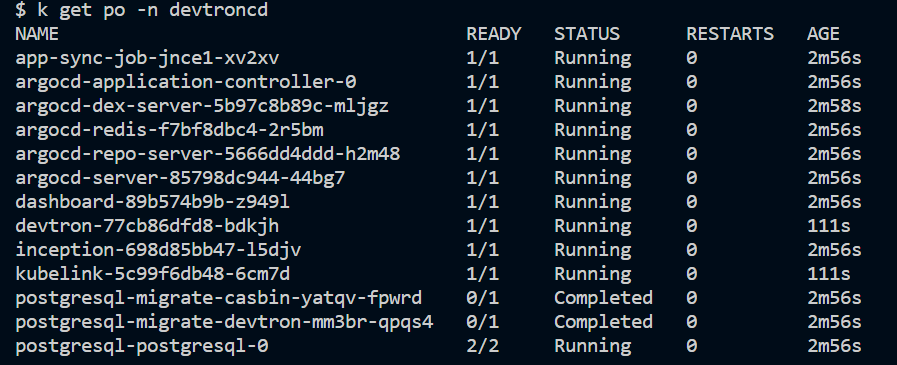
Get the status of all jobs in devtroncd namespace

Access the Ingress Endpoint, IP address from the below command
kubectl get svc -n devtroncd devtron-service -o jsonpath='{.status.loadBalancer.ingress}'Log in as administrator with the password from the below command:
kubectl -n devtroncd get secret devtron-secret -o jsonpath='{.data.ADMIN_PASSWORD}' | base64 -d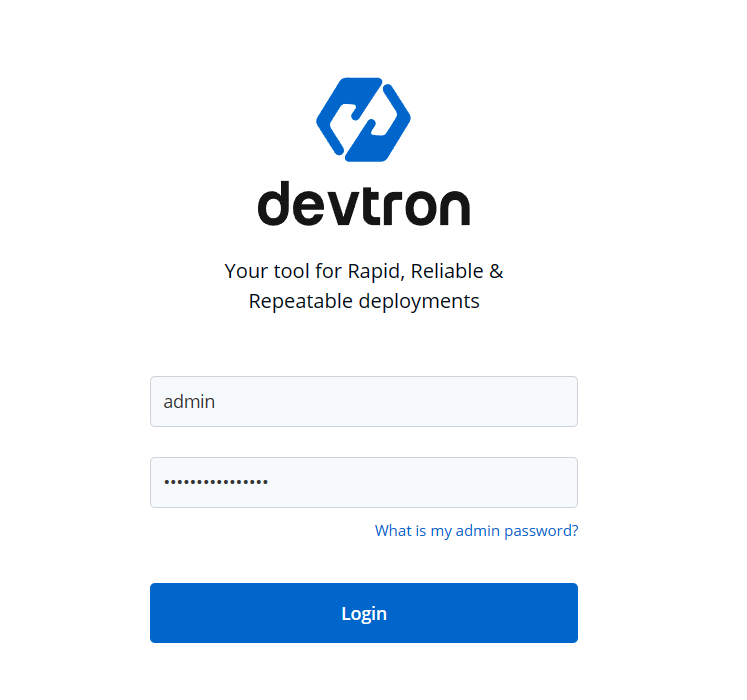
After logging in, you can either pick to create app from scratch or deploy from available helm charts
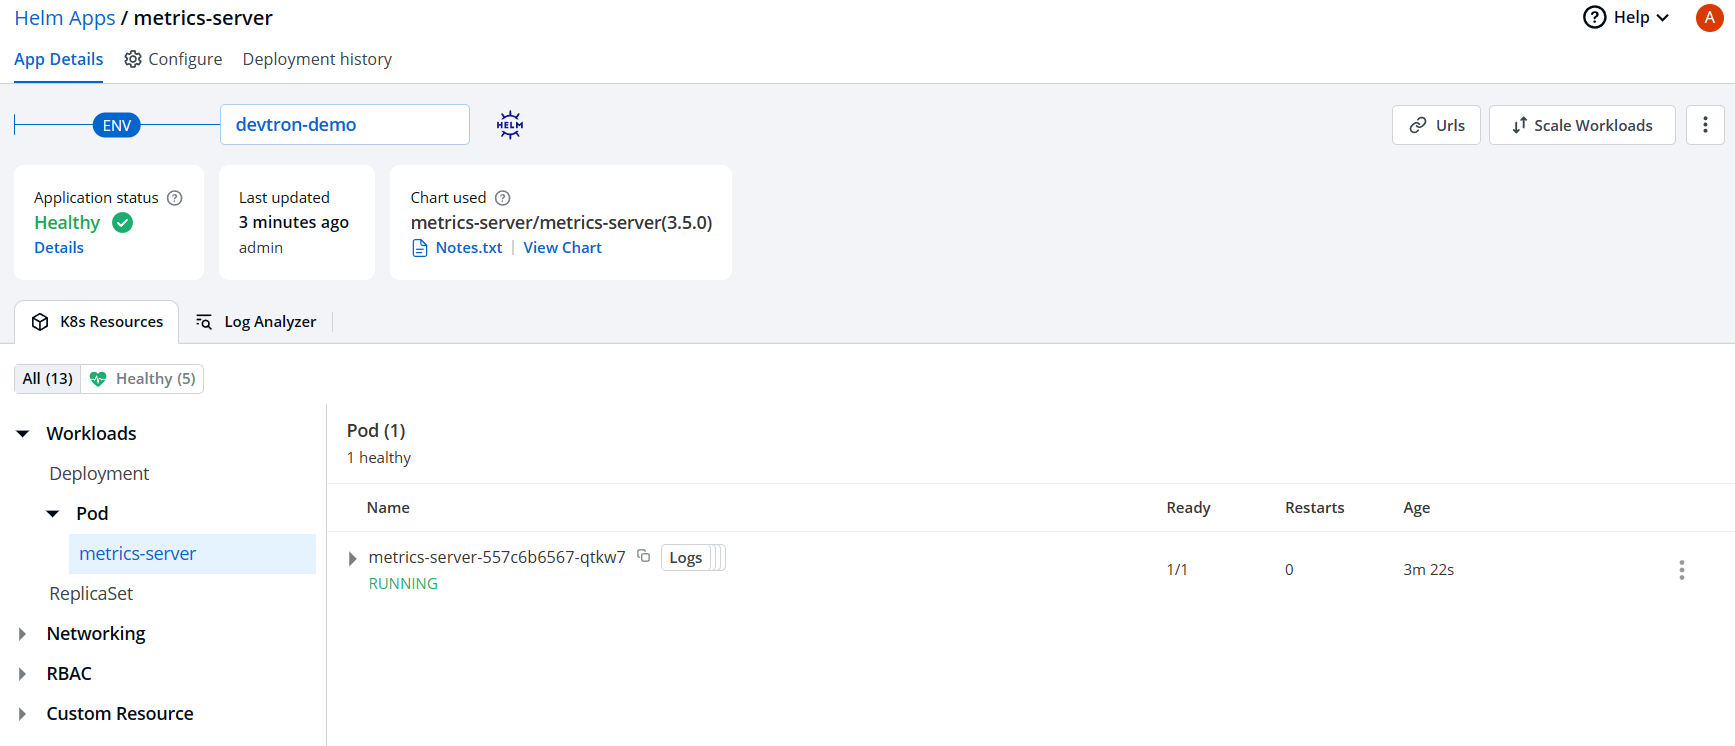
This is an example of deploying metrics-server helm chart
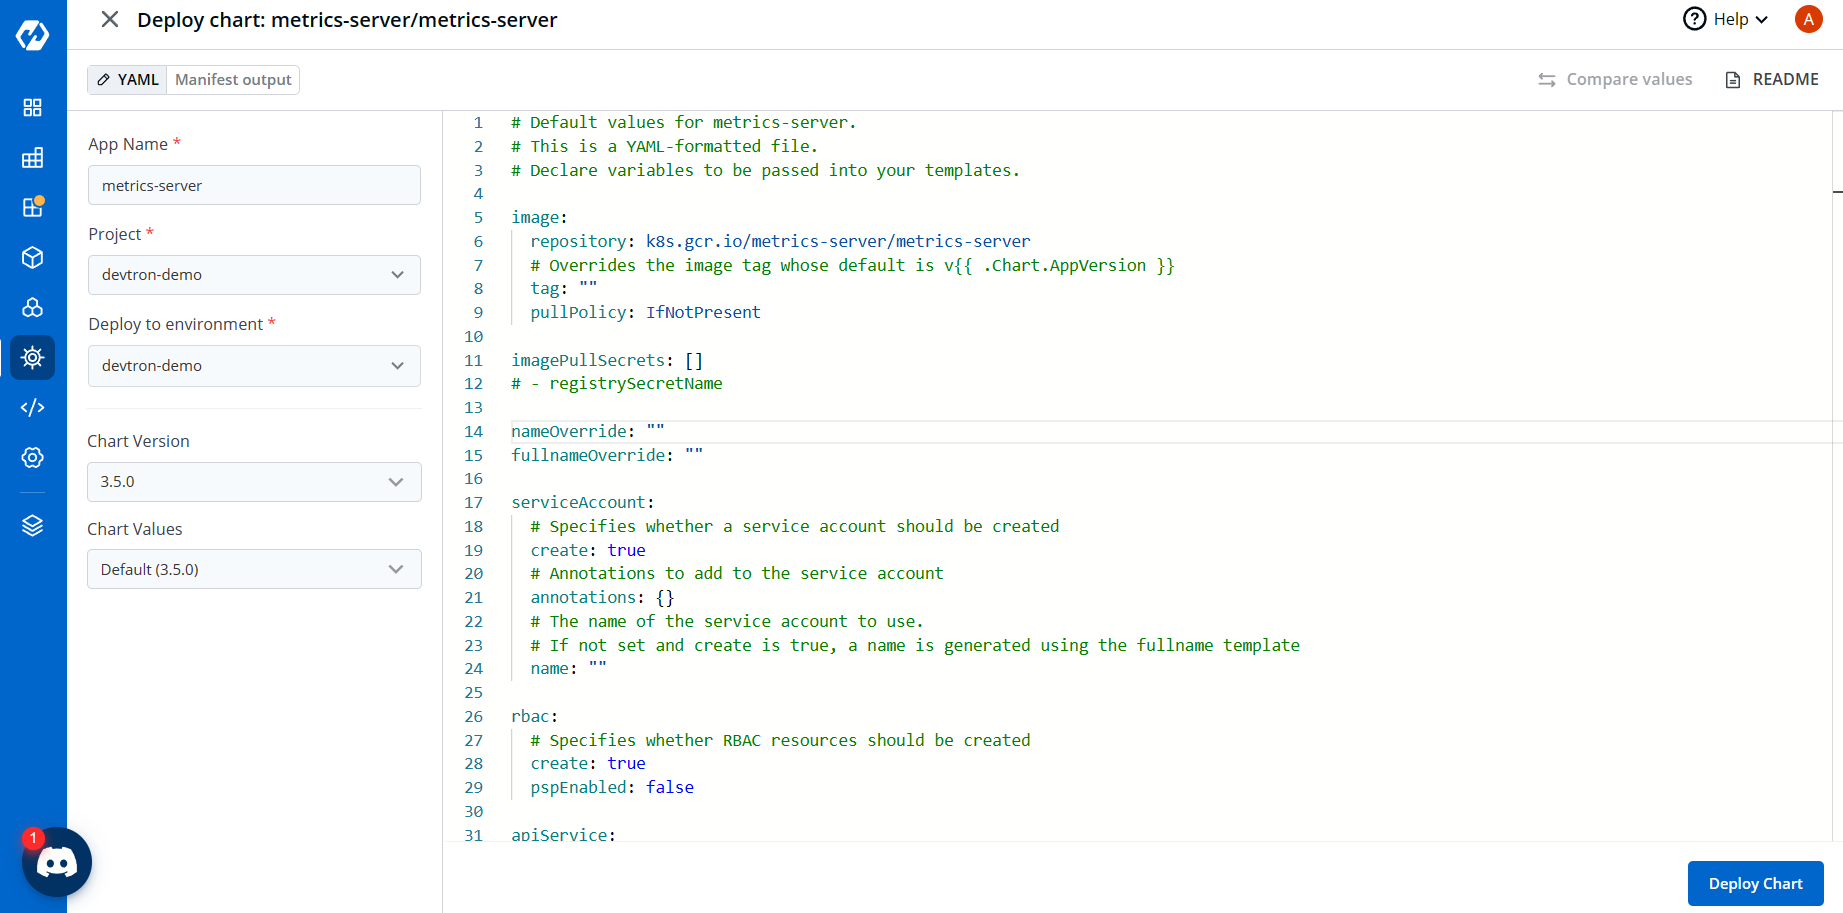
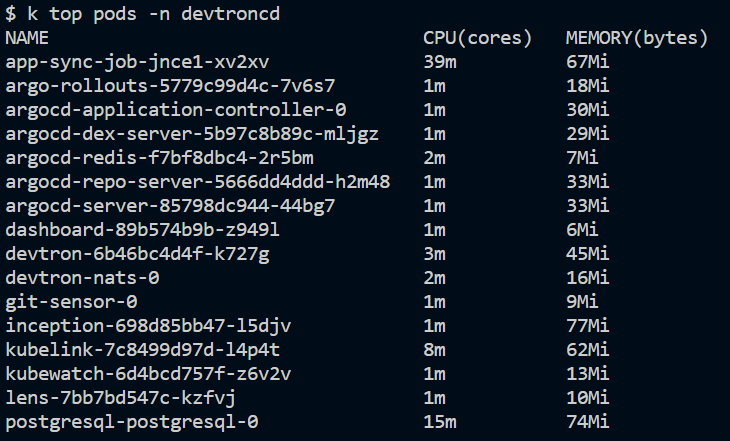
Before and after metrics-server installation


Memory/CPU consumption of pods in devtroncd namespace
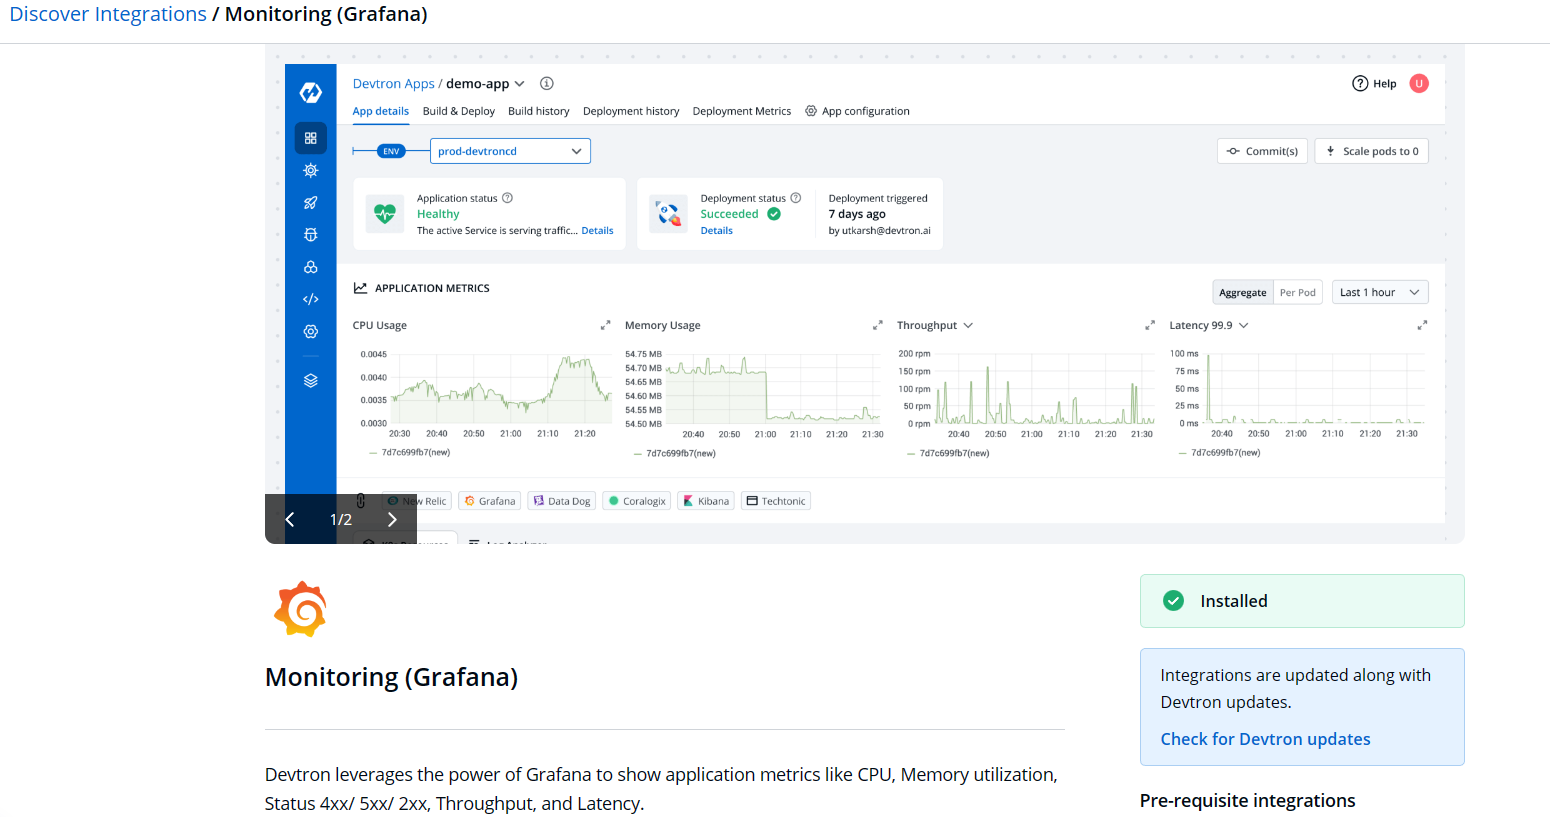
You can add integrations from 'Discover integrations' section, ex: Grafana (Monitoring)
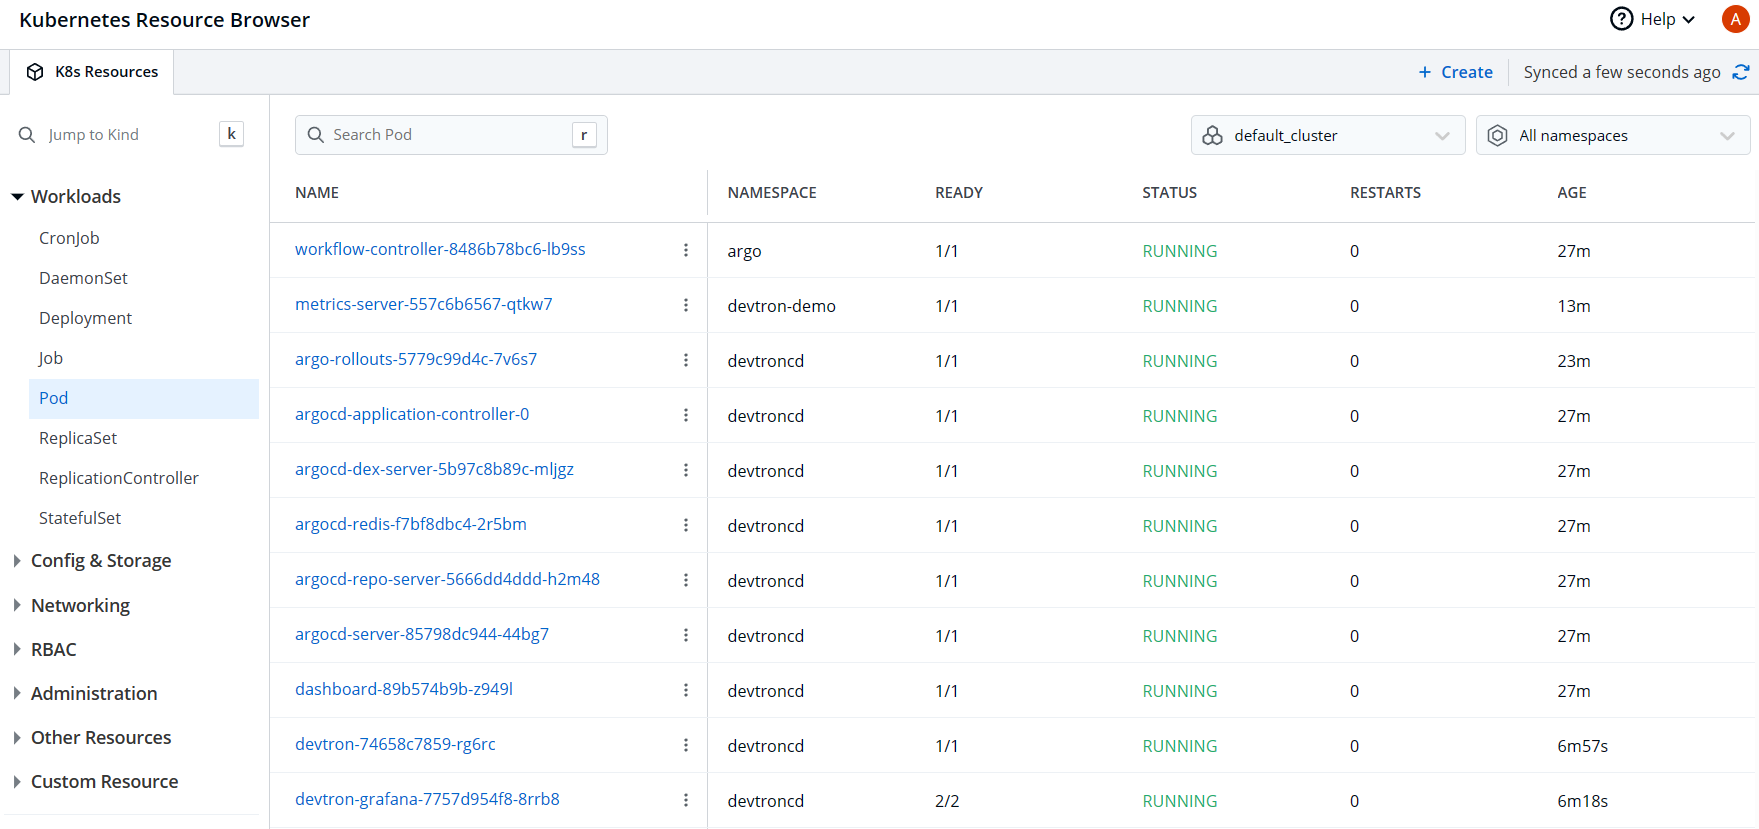
Explore resource browser to get a view into currently deployed kubernetes resources
Try to install Prometheus helm chart from the CLI
helm install my-release oci://registry-1.docker.io/bitnamicharts/kube-prometheusGo back to the Devtron UI to observe that your helm installation from CLI is auto-discovered

Port forward Prometheus service to 9090 to view it on your localhost
kubectl port-forward --namespace prometheus-operator svc/my-release-kube-prometheus-prometheus 9090:9090Explore different metrics and their graphs
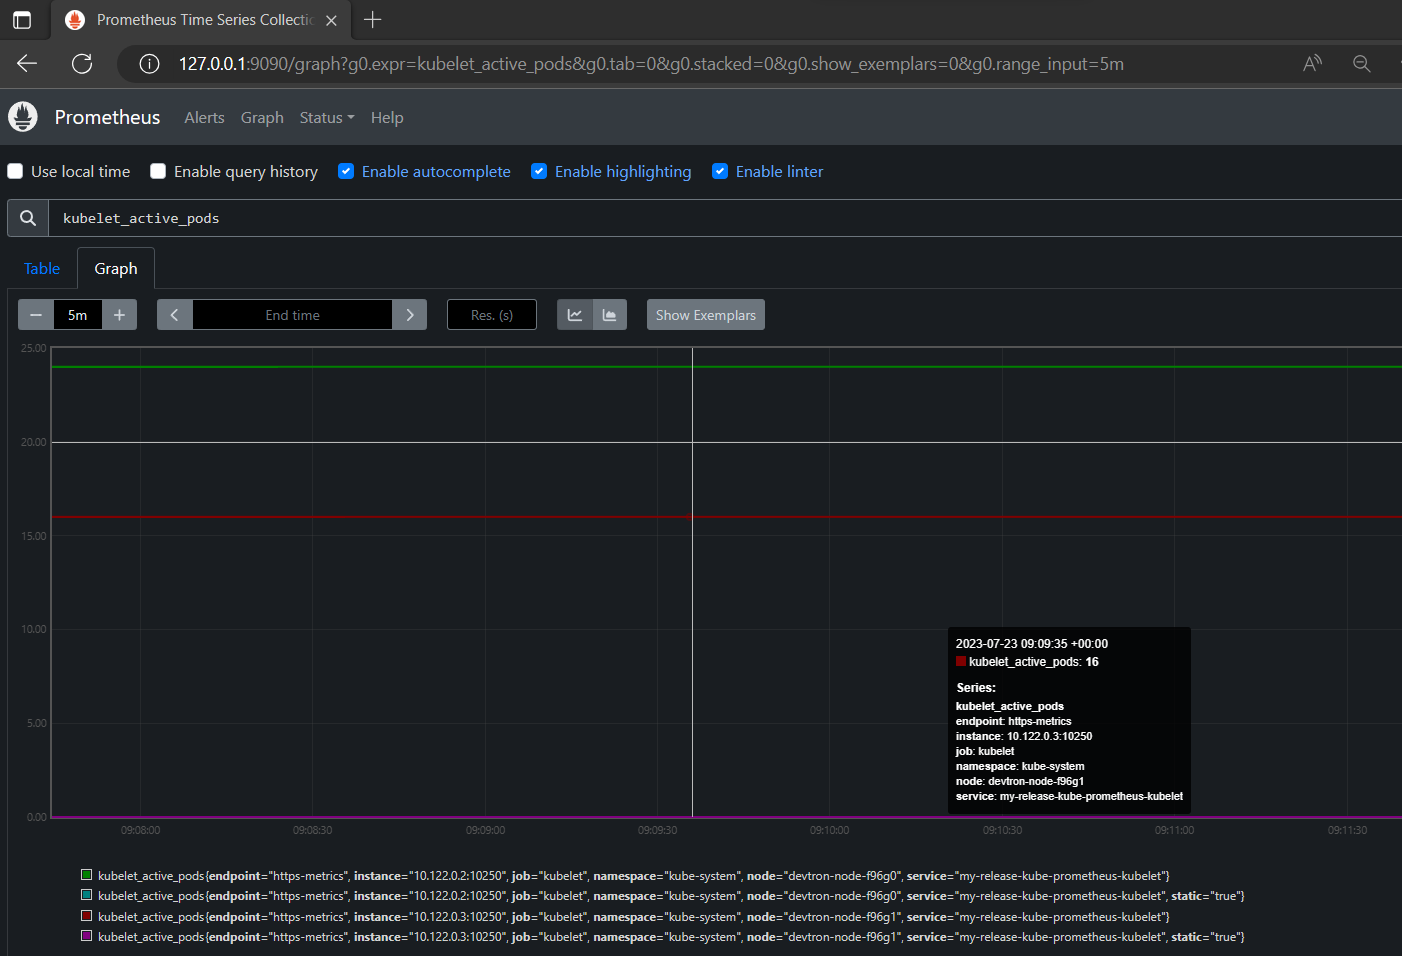
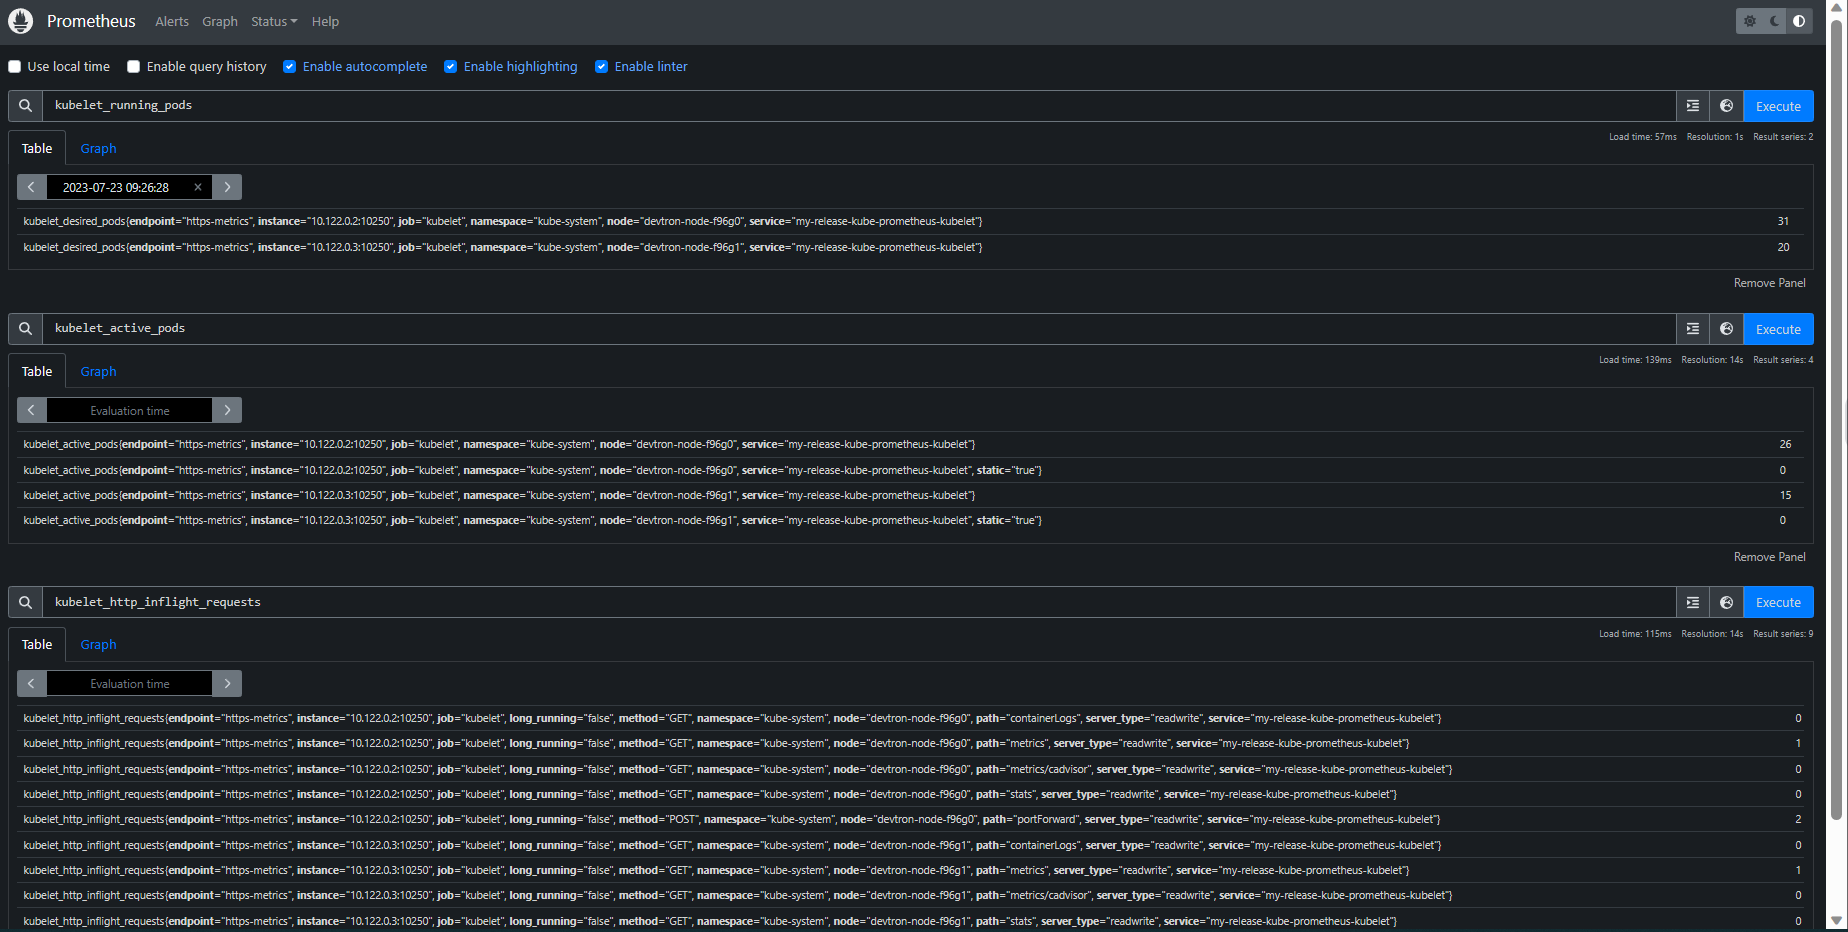
Devtron also enables you to ssh into the node of the connected k8s cluster
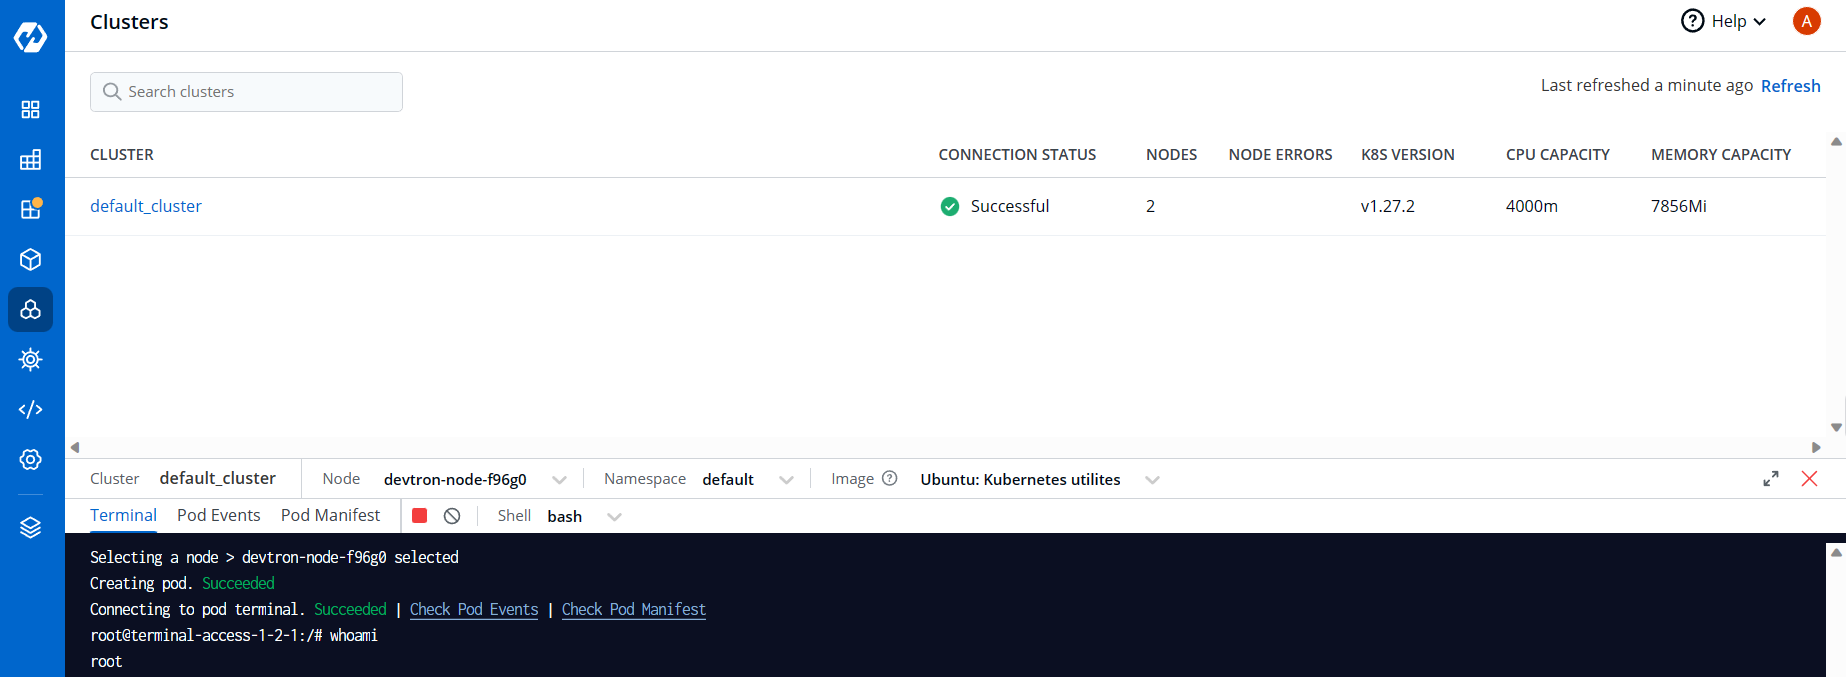
That's all from the setup side of things. Please share your implementations of Devtron in the comments.
Thank you!
Subscribe to my newsletter
Read articles from Anusha directly inside your inbox. Subscribe to the newsletter, and don't miss out.
Written by

Anusha
Anusha
I'm a DevOps Engineer with a passion for exploring emerging technologies and turning innovative ideas into practical, scalable systems with a foundation in automation, CI/CD, cloud infrastructure, and containerization. Areas of Interest: 🔧 CI/CD Pipelines | ☁️ Cloud Platforms | 🐳 Containers & Orchestration (Docker, Kubernetes) | 🧪 Infrastructure as Code | 🔍 Monitoring & Observability | 🧠 Emerging Tech & Innovation