Set up OpenTelemetry for full-stack JavaScript applications
 Zameer Fouzan
OpenTelemetry is a vendor-neutral observability framework that simplifies the collection of telemetry data. You’ll find it useful for monitoring and tracing the performance and behavior of your applications across different environments. With robust support for many programming languages, OpenTelemetry is evolving rapidly to enhance its support. OpenTelemetry generates telemetry data that can help you optimize and debug your JavaScript apps proactively. Also, distributed tracing can help you identify the correct pain points in larger systems.
If you’re using a JavaScript stack like PostgreSQL, Express, React, and Node.js (PERN) to deploy a full-stack web application, you might be considering options to collect telemetry from your application.
PERN stack is one of the most common stacks in web development, similar to the likes of MERN or MEAN stack. So, how easy is it to add observability to your full-stack JavaScript app with the open-source OpenTelemetry framework? This blog post breaks it down into actionable steps.
This blog post guides you through setting up and configuring OpenTelemetry for each layer and shows examples of what you can see using OpenTelemetry and New Relic. You’ll learn how to set up OpenTelemetry for a JavaScript application using a PERN stack, including:
Understanding common OpenTelemetry APIs and packages—and their purpose for setting up instrumentation for JavaScript applications.
Instrumenting your backend Node.js and Express apps.
Instrumenting your frontend React app.
Instrumenting your PostgreSQL database.
Exporting the collected telemetry data to our choice of Observability backend, which in this case is New Relic.
Before you begin
Here’s what you’ll need to follow along with all the steps in this blog post:
Basic knowledge of OpenTelemetry
A New Relic ingest license key (Log into your New Relic account or sign up for a free account.)
Understanding APIs and packages to use with OpenTelemetry and JavaScript
Here’s a brief overview of some common APIs and packages you need to set up instrumentation for JavaScript applications. Each section describes the package and its purpose.
opentelemetry/core
The @opentelemetry/core package provides default implementations of the OpenTelemetry API for traces and metrics. This blog post uses these APIs:
W3CTraceContextPropagator: This function, based on the W3C Trace Context specification, propagates SpanContext through trace context format propagation.
W3CBaggagePropagator: This function propagates baggage through context format propagation, based on the W3C Baggage specification.
CompositePropagator: This function combines multiple propagators into a single propagator.
To learn more, see~ the OpenTelemetry API propagators documentation.
opentelemetry/sdk-node
The @opentelemetry/sdk-node package provides the complete OpenTelemetry SDK for Node.js, including tracing and metrics. You can use this package along with the meta package @opentelemetry/auto-instrumentations-node to set up automatic instrumentation for Node.js.
opentelemetry/sdk-trace-web
The @opentelemetry/sdk-trace-web module provides automated instrumentation and tracing for web applications. It provides an API named WebTracerProvider that automatically creates the traces within the browser.
OTLPTraceExporter
The OTLPTraceExporter is a common API provided in the @opentelemetry/exporter-trace-otlp-http and @opentelemetry/exporter-trace-otlp-proto packages for exporting the collected telemetry to a collector or a choice of backend. This blog post shows how to use the New Relic native OTLP Endpoint to export your telemetry data.
Instrument your backend Node.js and Express apps
You’ll start by instrumenting your backend Node.js app. OpenTelemetry includes the @opentelemetry/auto-instrumentations-node meta package for easy instrumentation. This package helps instrument the most popular libraries directly from one package.
The meta package already contains instrumentation for both Express and PostgreSQL, as @opentelemetry/instrumentation-express and @opentelemetry/instrumentation-pg. You’ll just need to enable the configuration to be able to instrument them.
Step 1: Install the packages
First, install all the required packages for Node.js. Copy this command and run it in the root of your Node app:
npm install --save
@opentelemetry/core
@opentelemetry/api
@opentelemetry/sdk-node
@opentelemetry/auto-instrumentations-node
@opentelemetry/exporter-trace-otlp-proto
Step 2: Create a tracing.js file in the Express app
Next, create a new file with the name tracing.js in the main folder of the Node Express app. Copy and paste this code into the file:
"use strict";
const opentelemetry = require("@opentelemetry/sdk-node");
const {
  getNodeAutoInstrumentations
} = require("@opentelemetry/auto-instrumentations-node");

const {
  CompositePropagator,
  W3CBaggagePropagator,
  W3CTraceContextPropagator,
} = require("@opentelemetry/core");

const {
  OTLPTraceExporter
} = require("@opentelemetry/exporter-trace-otlp-proto");

// For troubleshooting, set the log level to DiagLogLevel.DEBUG
const {
  diag,
  DiagConsoleLogger,
  DiagLogLevel
} = require("@opentelemetry/api");
diag.setLogger(new DiagConsoleLogger(), DiagLogLevel.DEBUG);

const COLLECTOR_STRING = "<https://otlp.nr-data.net:4318/v1/traces>";

// The `newRelicExporter` is an instance of OTLPTraceExporter configured to send traces to New Relic's OTLP-compatible backend.
// Make sure you have added your New Relic Ingest License to NR_LICENSE env-var
const newRelicExporter = new OTLPTraceExporter({
  url: COLLECTOR_STRING,
  headers: {
    "api-key": `${process.env.NR_LICENSE}`,
  },
});

const sdk = new opentelemetry.NodeSDK({
  // The name of the service, configured below, is how you will
  // identify your app in New Relic
  serviceName: "node-express-otel",
  traceExporter: newRelicExporter,
// Configure the propagator to enable context propagation between services using the W3C Trace Headers
  textMapPropagator: new CompositePropagator({
    propagators: [new W3CBaggagePropagator(), new W3CTraceContextPropagator()],
  }),
  instrumentations: [
    getNodeAutoInstrumentations({
        // Enable Instrumentations for PostgreSQL Database
      "@opentelemetry/instrumentation-pg": {
        requireParentSpan: true,
        enhancedDatabaseReporting: true,
      },
      "@opentelemetry/instrumentation-http": {
        ignoreIncomingRequestHook(req) {
          // Ignore routes to avoid the trace capture, e.g. RegEx to ignore the incoming route /api/telemetry
          const isIgnoredRoute = !!req.url.match(
            /^(https?:\\/\\/)?([\\da-z\\.-]+)(\\/[\\d|\\w]{2})(\\/api\\/traces)/
          );
          return isIgnoredRoute;
        },
      },
      "@opentelemetry/instrumentation-express": {
        enabled: true,
      },
    }),
  ],
  autoDetectResources: true,
});

// Register the SDK instance as the global OpenTelemetry tracer provider
sdk.start();
Step 3: Start the Node.js app with the new instrumentation
To initialize OpenTelemetry, use this command when you launch the app:
node --require './tracing.js' server.js
If you use PM2 as your Node.js process manager, add the node_args configuration to your ecosystem.config.js file. Here’s an example of a complete configuration file:
module.exports = {
    apps : [{
      name   : "expressApp-otel",
      script : "./server.js",
      node_args:"--require './tracing.js'",
      env: {
        "PORT": 8080
      }
    }]
  }
Step 4: Review your data in New Relic
Now that you’ve set up the instrumentation for your Node backend, how does the telemetry data look?
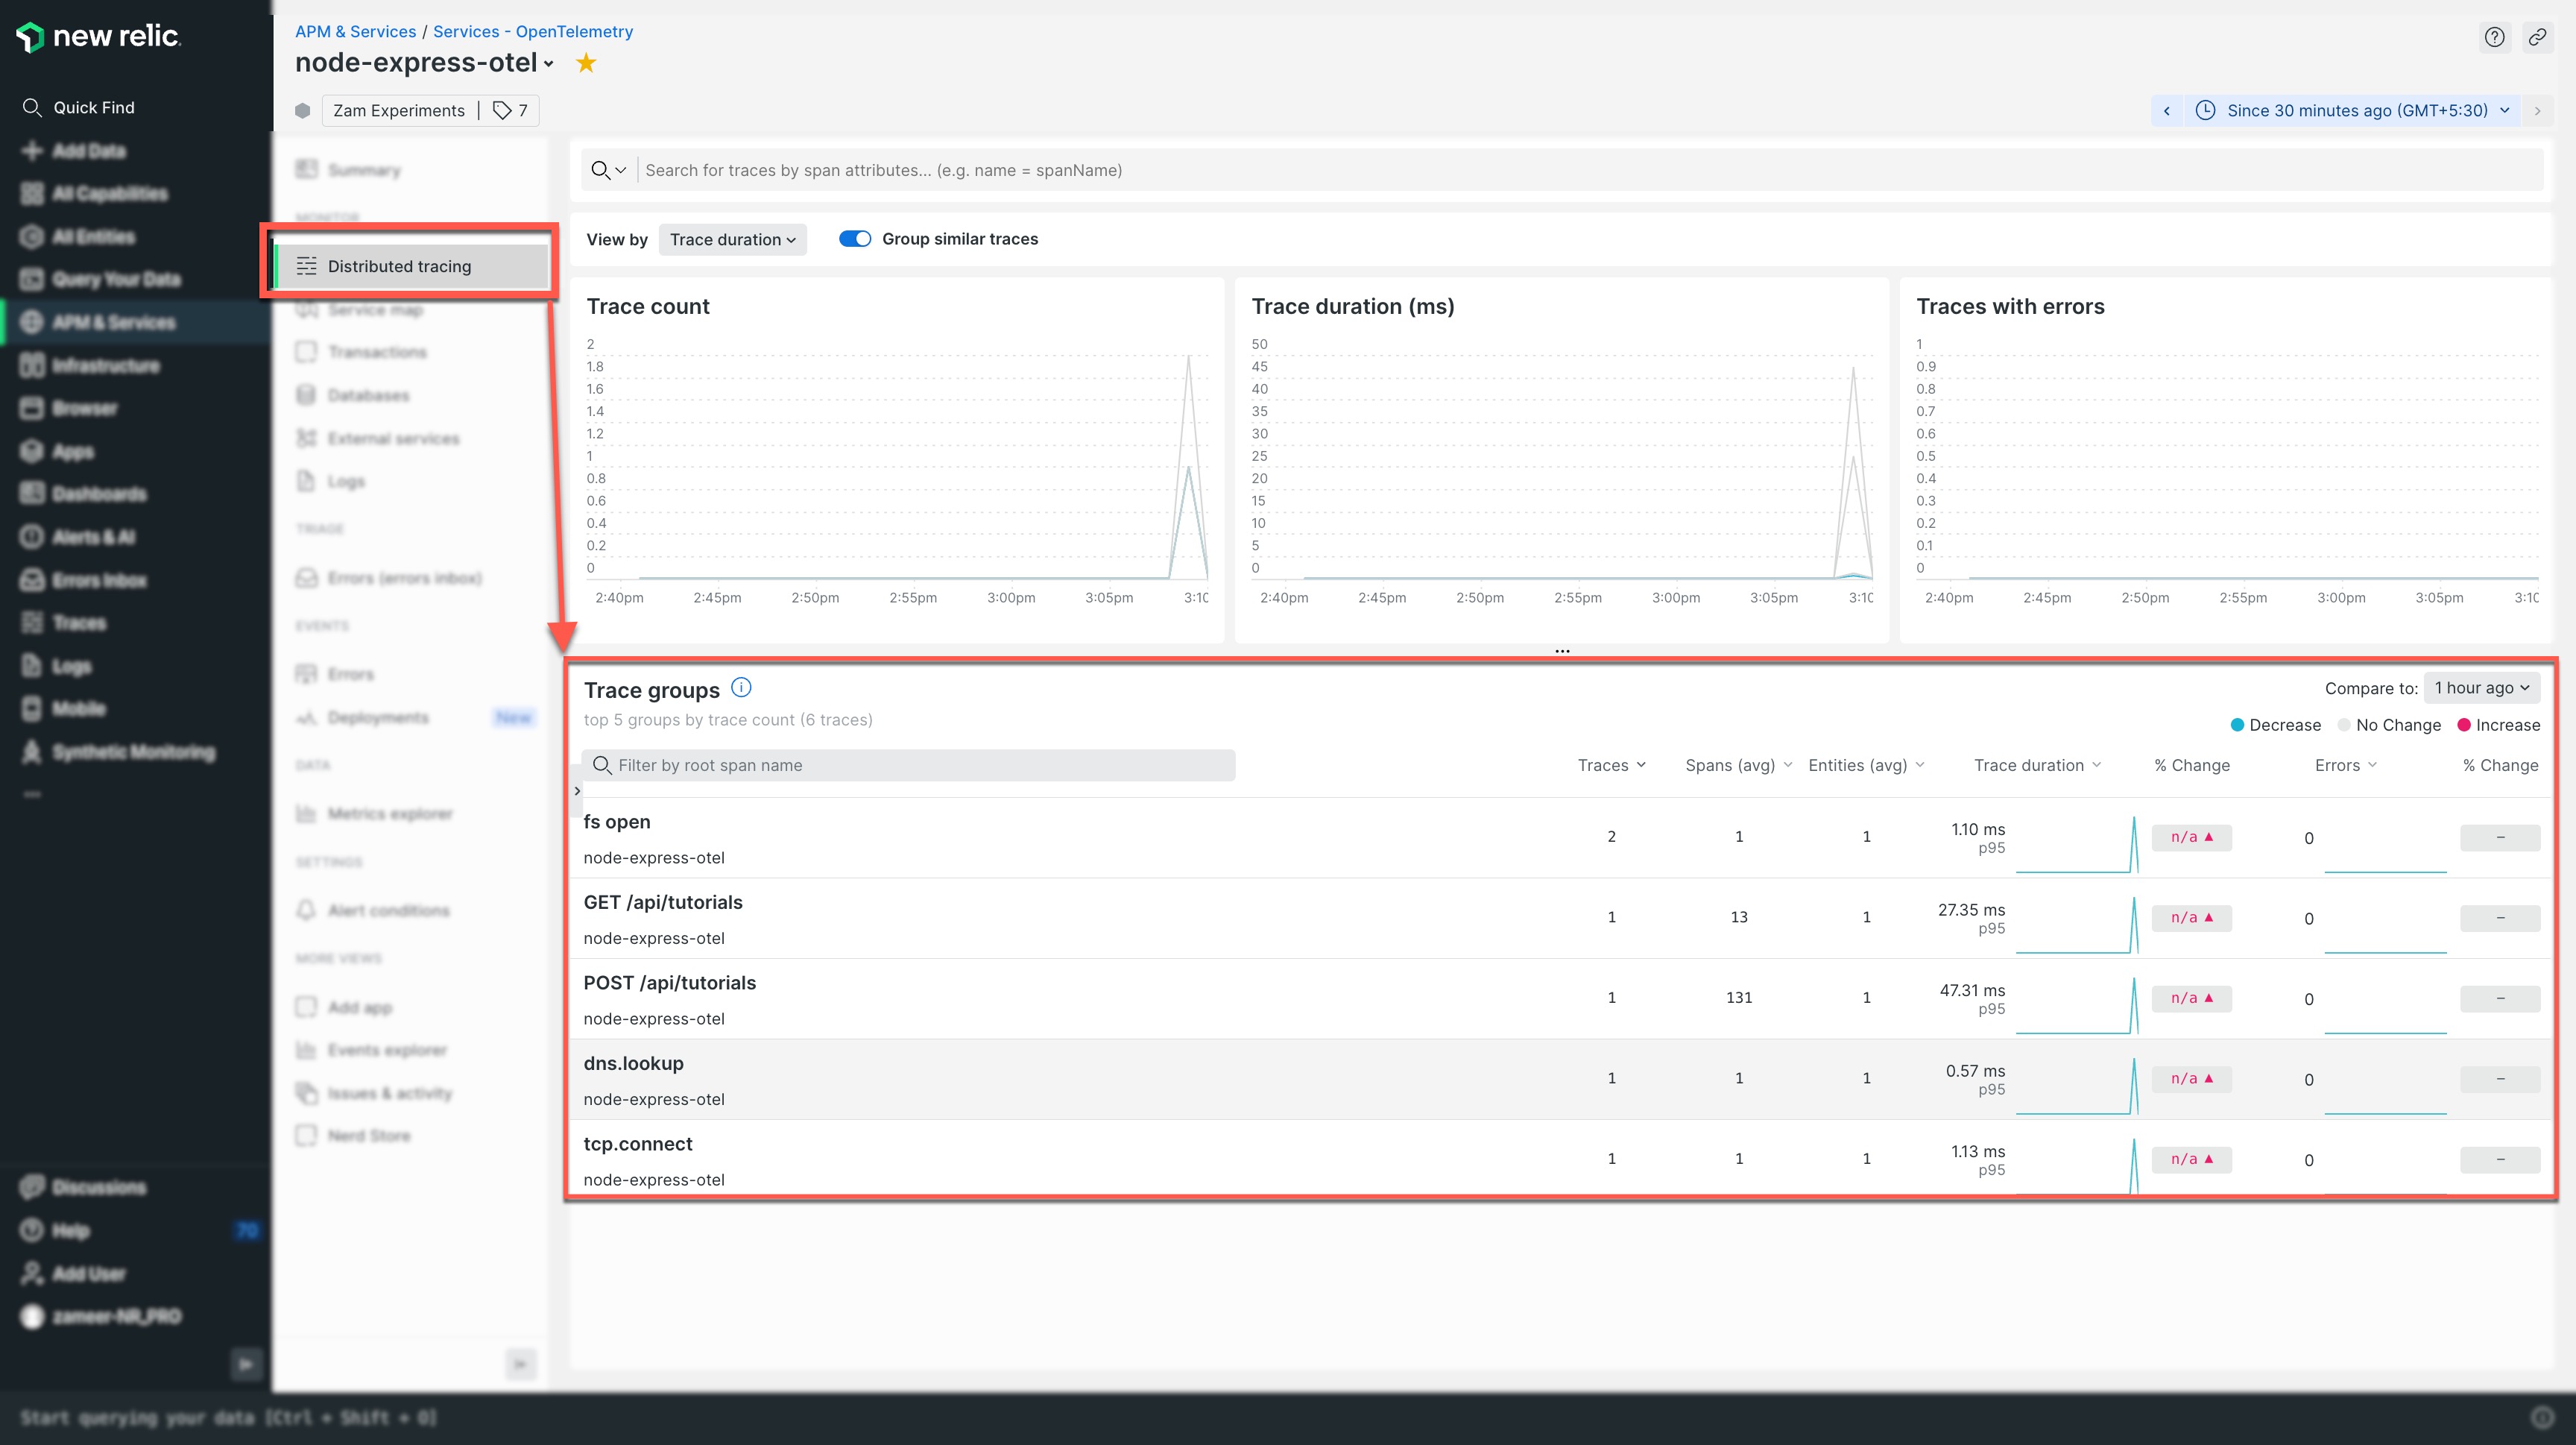
After you’ve found your Node app in your New Relic account on the APM & Services page, you can view your distributed traces, along with the top five trace groups by trace count.
You can drill down into trace details to see information about individual spans within a trace, including how much time each span took to complete:
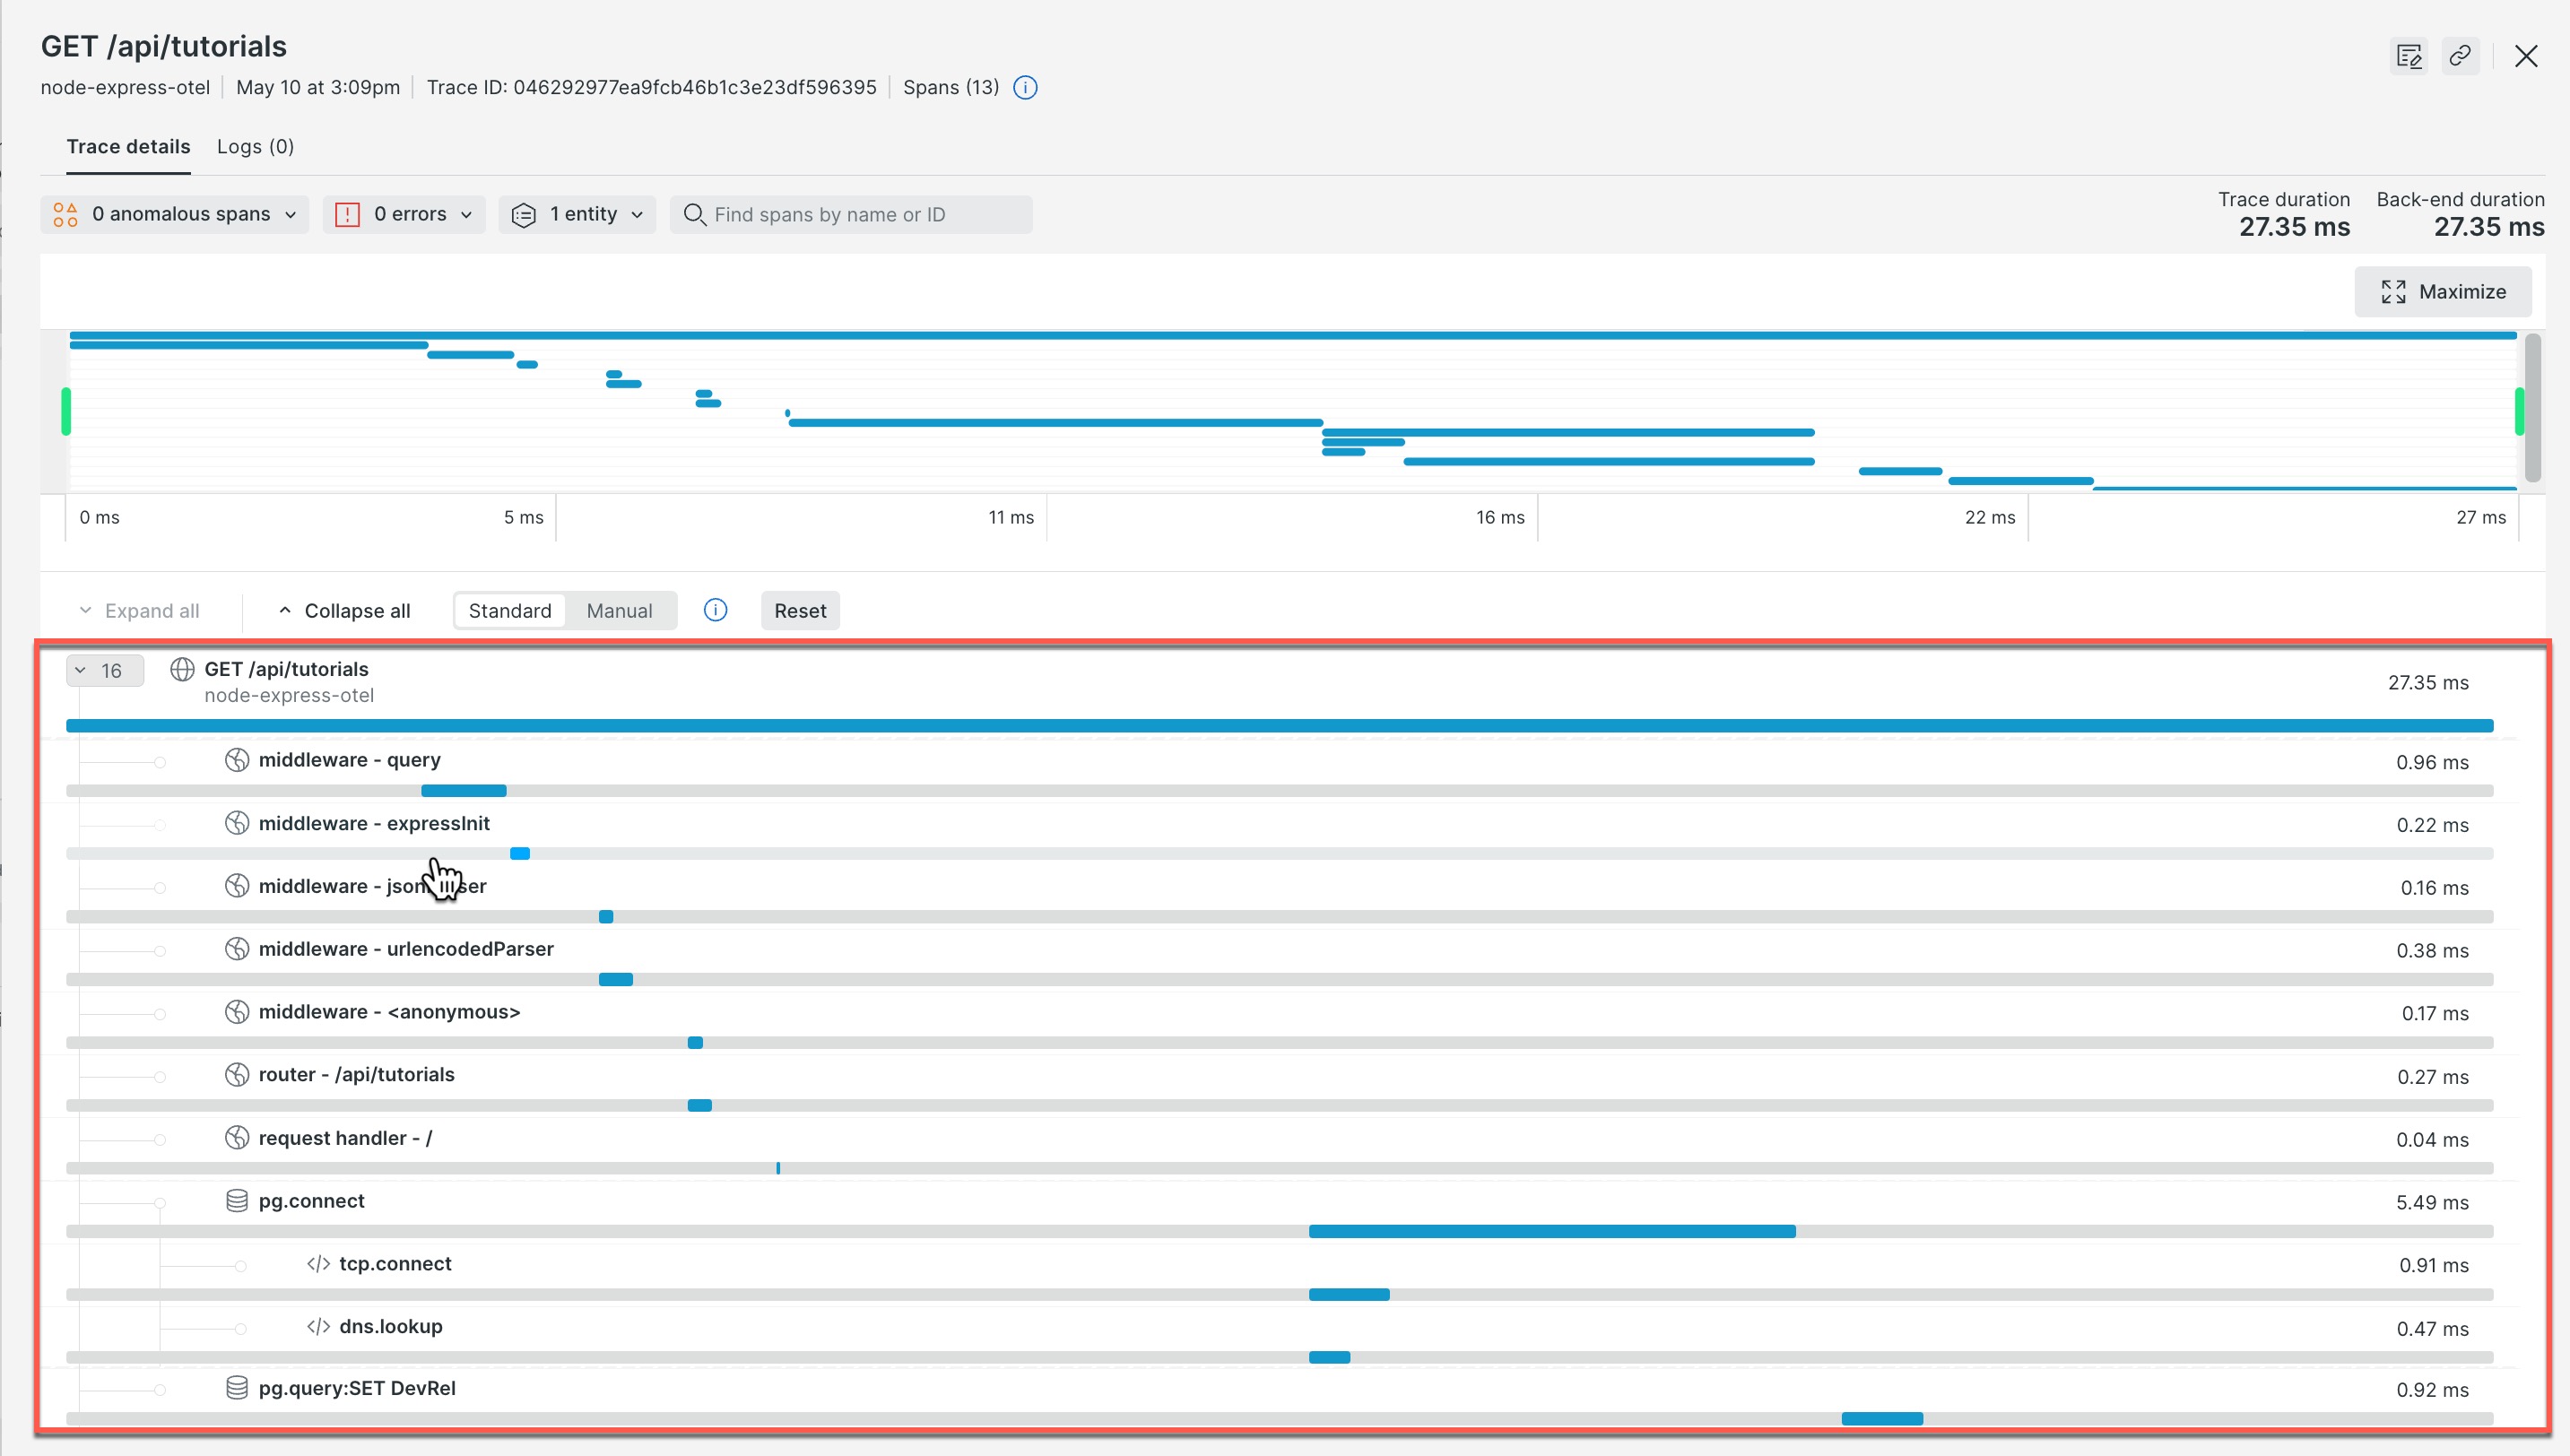
In this trace, you can also view details about your database calls, such as the name of the executed queries and the duration of each.
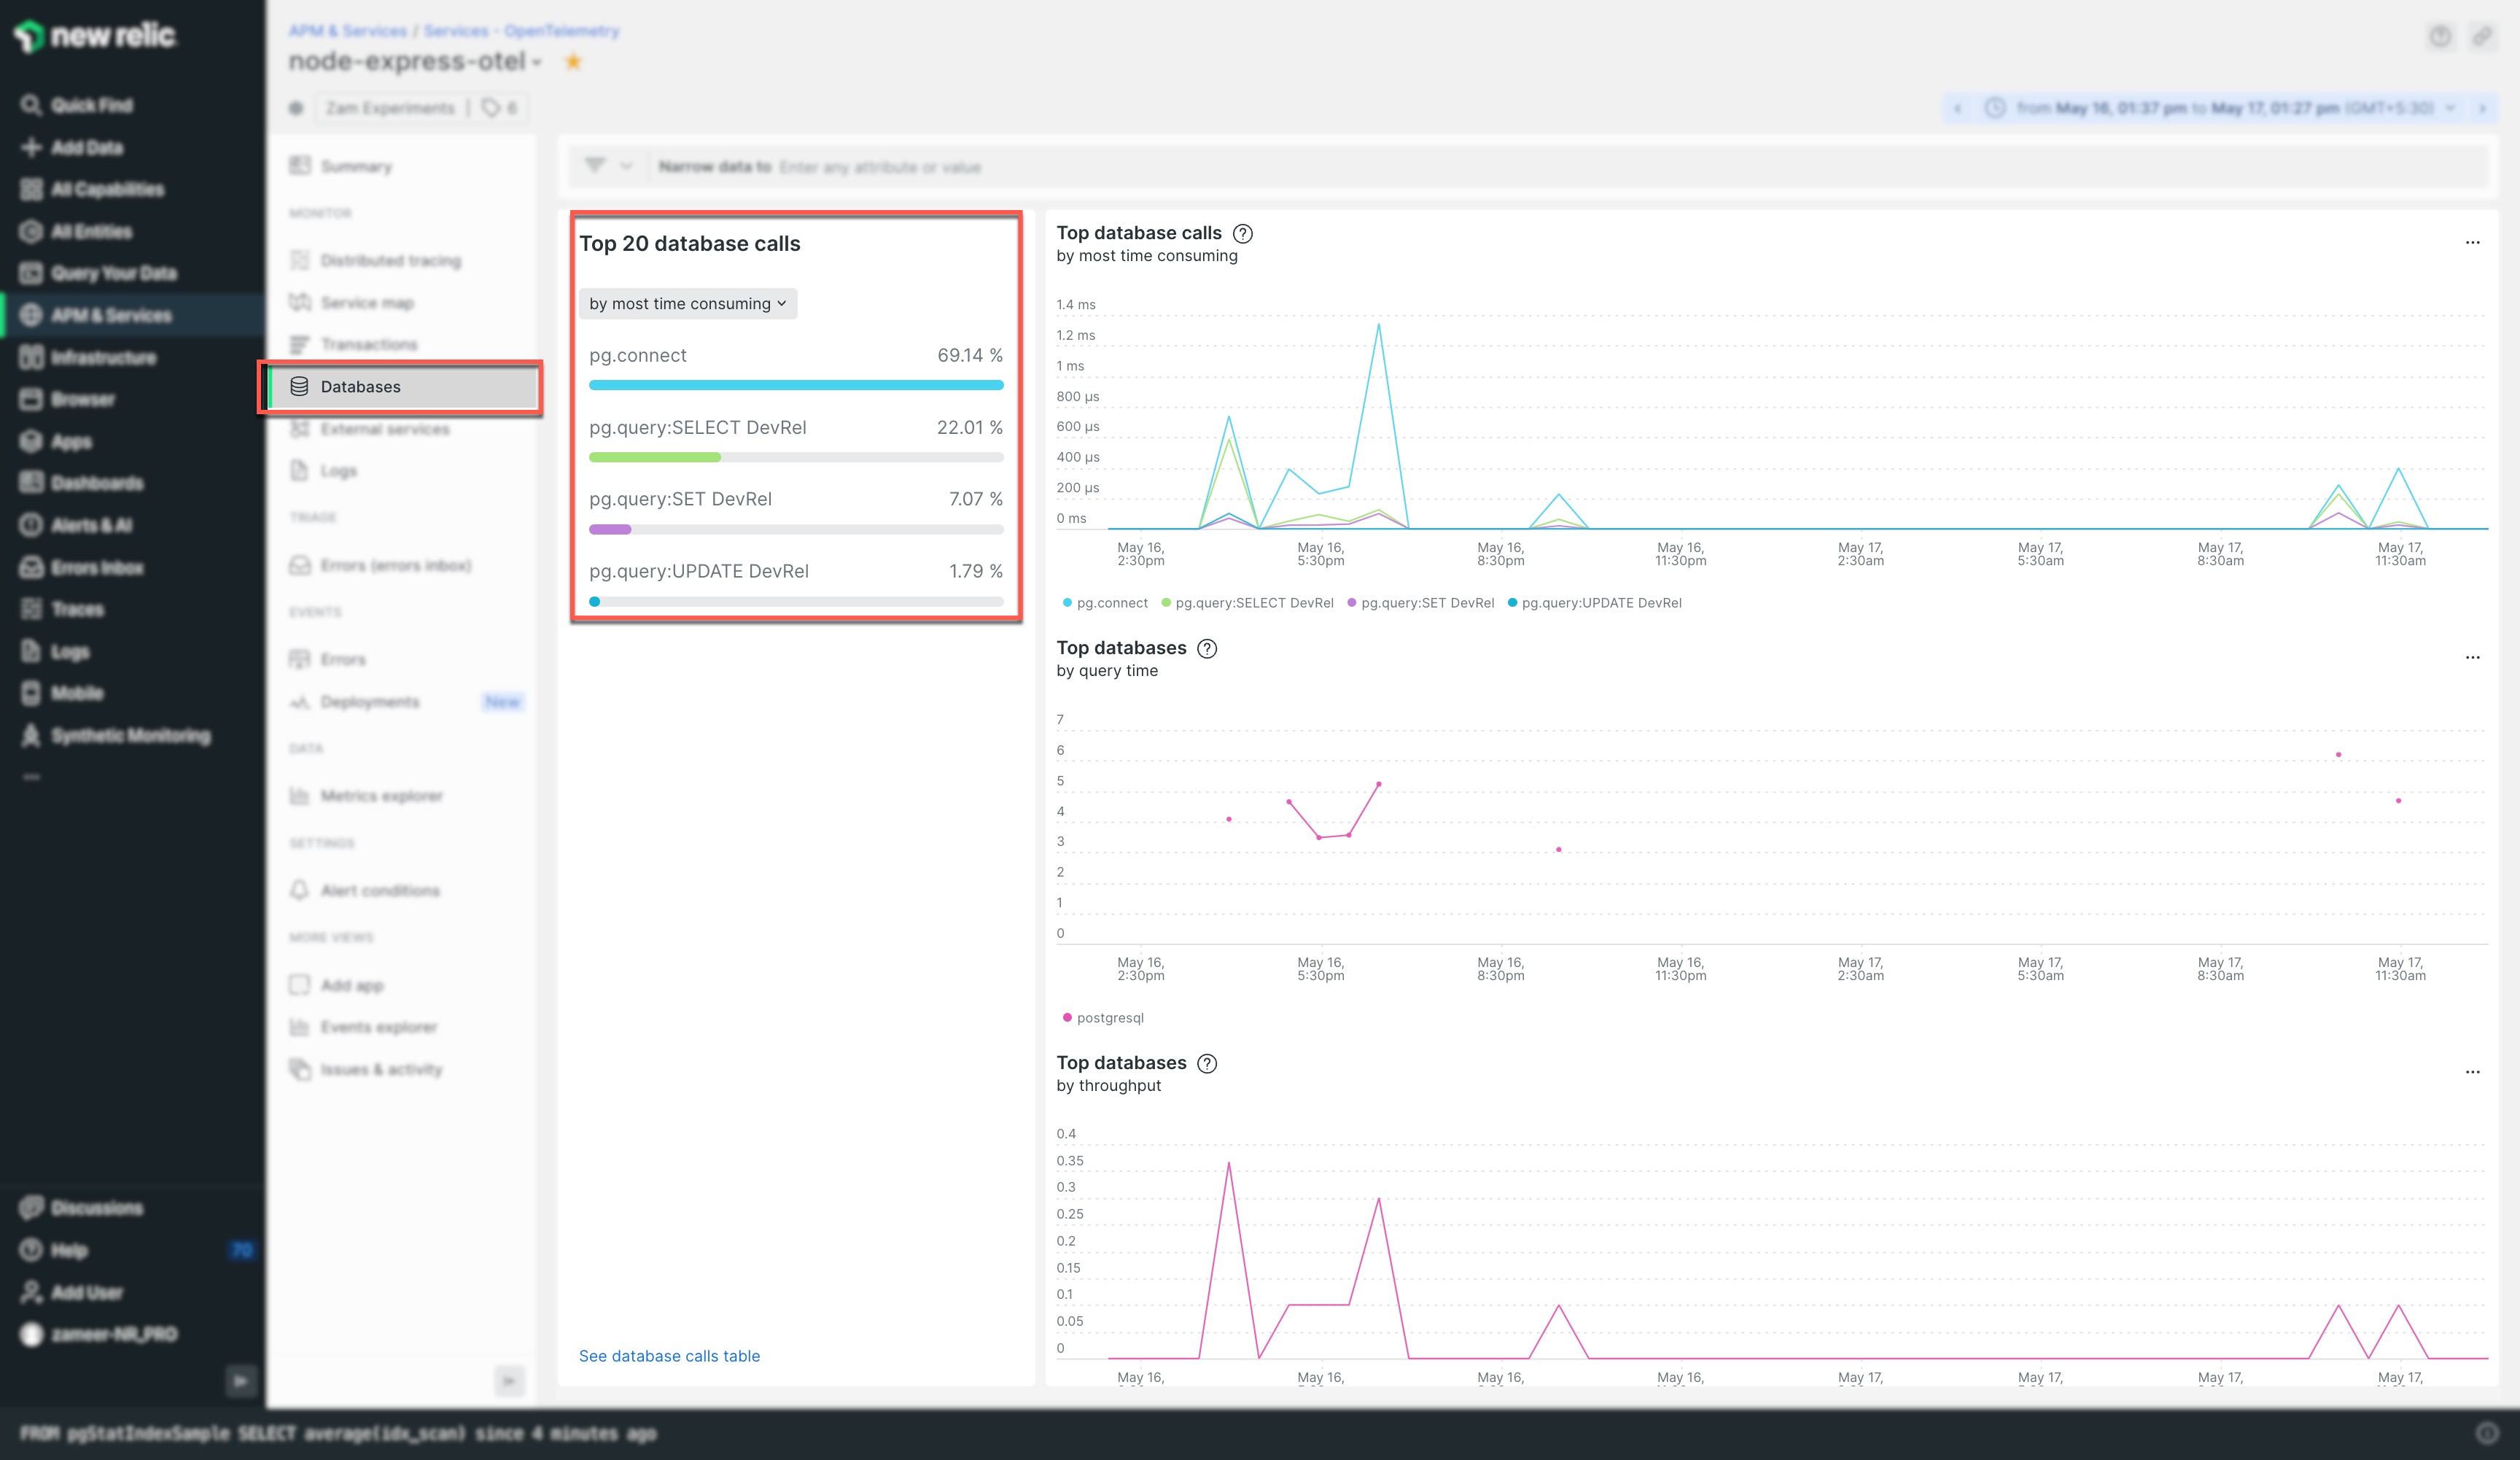
Select Databases for your Node.js entity to review all the collated database calls and insights like the top 20 database calls.
Instrument your frontend React app
For the frontend web application, OpenTelemetry provides a meta package called @opentelemetry/auto-instrumentations-web. Similar to the Node version, this package includes all the necessary plugins to set up instrumentation for aspects of a web application such as document load, user interactions, and HTTP requests.
Step 1: Install the packages
Install the required packages for the JavaScript web application, copy this command, and run it in the root of your React app:
npm install --save
@opentelemetry/sdk-trace-web
@opentelemetry/sdk-trace-base
@opentelemetry/auto-instrumentations-web
@opentelemetry/api
@opentelemetry/context-zone
@opentelemetry/core
@opentelemetry/resources
@opentelemetry/semantic-conventions
@opentelemetry/instrumentation
@opentelemetry/exporter-trace-otlp-http
Step 2: Configure OpenTelemetry
After installing all the packages, you’ll set up OpenTelemetry configurations for your React web application.
Create a file named opentelemetry.js in the src directory of your app (the directory might be different depending on your app structure).
Copy this code and paste it into the opentelemetry.js file:
import { WebTracerProvider } from "@opentelemetry/sdk-trace-web";
import { getWebAutoInstrumentations } from "@opentelemetry/auto-instrumentations-web";
import { ZoneContextManager } from "@opentelemetry/context-zone";

import {
  CompositePropagator,
  W3CBaggagePropagator,
  W3CTraceContextPropagator,
} from "@opentelemetry/core";

import { Resource } from "@opentelemetry/resources";
import { SemanticResourceAttributes } from "@opentelemetry/semantic-conventions";

import { registerInstrumentations } from "@opentelemetry/instrumentation";

//exporters
import {
  ConsoleSpanExporter,
  SimpleSpanProcessor,
  BatchSpanProcessor,
} from "@opentelemetry/sdk-trace-base";

import { OTLPTraceExporter } from "@opentelemetry/exporter-trace-otlp-http";

const COLLECTOR_STRING = `${import.meta.env.VITE_APP_OTLP_URL}`;

//console.log(`CollectorString: ${COLLECTOR_STRING}`);

// The SemanticResourceAttributes is an enum that provides a set of predefined attribute keys for commonly used attributes in OpenTelemetry to maintain consistency across different OpenTelemetry implementations
const resourceSettings = new Resource({
  [SemanticResourceAttributes.SERVICE_NAME]: "react-tutorials-otel",
  [SemanticResourceAttributes.SERVICE_VERSION]: '0.0.1',
});

// The `newRelicExporter` is an instance of OTLPTraceExporter configured to send traces to New Relic's OTPL-compatible backend.
// Make sure you have added your New Relic Ingest License to VITE_APP_NR_LICENSE env-var of your React App
const newRelicExporter = new OTLPTraceExporter({
  url: COLLECTOR_STRING,
  headers: {
    "api-key": `${import.meta.env.VITE_APP_NR_LICENSE}`
  },
});

const provider = new WebTracerProvider({resource: resourceSettings});

//Uncomment this to enable debugging using consoleExporter
//provider.addSpanProcessor(new SimpleSpanProcessor(new ConsoleSpanExporter()));

// The BatchSpanProcessor is responsible for batching and exporting spans to the configured exporter (newRelicExporter in this case).
provider.addSpanProcessor(
new BatchSpanProcessor(
  newRelicExporter,
   //Optional BatchSpanProcessor Configurations
    {
      // The maximum queue size. After the size is reached spans are dropped.
      maxQueueSize: 100,
      // The maximum batch size of every export. It must be smaller or equal to maxQueueSize.
      maxExportBatchSize: 50,
      // The interval between two consecutive exports
      scheduledDelayMillis: 500,
      // How long the export can run before it is cancelled
      exportTimeoutMillis: 30000,
    }
)
);

// ZoneContextManager is a context manager implementation based on the Zone.js library. It enables context propagation within the application using zones.
provider.register({
contextManager: new ZoneContextManager(),
// Configure the propagator to enable context propagation between services using the W3C Trace Headers
propagator: new CompositePropagator({
  propagators: [new W3CBaggagePropagator(), new W3CTraceContextPropagator()],
}),
});

const startOtelInstrumentation = () => {
  console.error(`Registering Otel ${new Date().getMilliseconds()}`);
  // Registering instrumentations
  registerInstrumentations({
    instrumentations: [
      getWebAutoInstrumentations({
        "@opentelemetry/instrumentation-xml-http-request": {
          enabled:true,
          ignoreUrls: ["/localhost:8081/sockjs-node"],
          clearTimingResources: true,
          propagateTraceHeaderCorsUrls: [/.+/g]
        },
        "@opentelemetry/instrumentation-document-load": {
          enabled: true
        },
        "@opentelemetry/instrumentation-user-interaction": {
          enabled:true
        },
      }),
    ],
  });
};

export { startOtelInstrumentation };
Step 3: Instrument for additional events beyond the click event (Optional)
In the plugin @opentelemetry/instrumentation-user-interaction, by default only the click event is instrumented. To enable instrumentation for additional events, update the plugin configuration as shown in this example:
"@opentelemetry/instrumentation-user-interaction": {
          enabled: true,
          eventNames: [
            "click",
            "load",
            "loadeddata",
            "loadedmetadata",
            "loadstart",
            "error",
          ],
Note for distributed traces: For the propagateTraceHeaderCorsUrls property under the @opentelemetry/instrumentation-xml-http-request plugin, the regex /.+/g in the previous code sample will "allow all the URLs" to be propagated with trace headers. This is useful when you want to capture all the traces from your web app.
But if the origins for the frontend and backend don’t match, or if you want to capture traces for only certain selected endpoints, you’ll need to specify a regex for those specific URLs. Use this example code snippet to filter out URLs for your distributed traces. In this example, notice that it only allows localhost, 127.0.0.1, and URL patterns similar to https://api.twitter.com/v1/api/analytics.
        "@opentelemetry/instrumentation-xml-http-request": {
          enabled:true,
          ignoreUrls: ["/localhost:8081/sockjs-node"],
          clearTimingResources: true,
          propagateTraceHeaderCorsUrls: [
            /http:\\/\\/127\\.0\\.0\\.1:\\d+\\.*/,
            /http:\\/\\/localhost:\\d+\\.*/,
            // matches URL of pattern for =>  "<https://api.twitter.com/v1/api/analytics>"
            ^(http|https):\\/\\/[a-z0-9-]+(?:\\.[a-z0-9-]+)(.\\w*)+\\/?\\w?\\d?\\/api\\/\\w+\\.*
          ],
        },
Step 4: Initialize instrumentation for React
To enable and initialize the instrumentation for React, you’ll import the startOtelInstrumentation function from the newly created opentelemetry.js file into the main file of your React app (for example, main.jsx):
// OpenTelemetry Import
import { startOtelInstrumentation } from './opentelemetry';

// Add this before the initialization of your main App, so it can capture all the traces.
startOtelInstrumentation();

ReactDOM.createRoot(document.getElementById('root')).render(
  <BrowserRouter>
    <App />
  </BrowserRouter>,
)
Step 5: Deploy and review results in New Relic
Start your React application by running npm start.
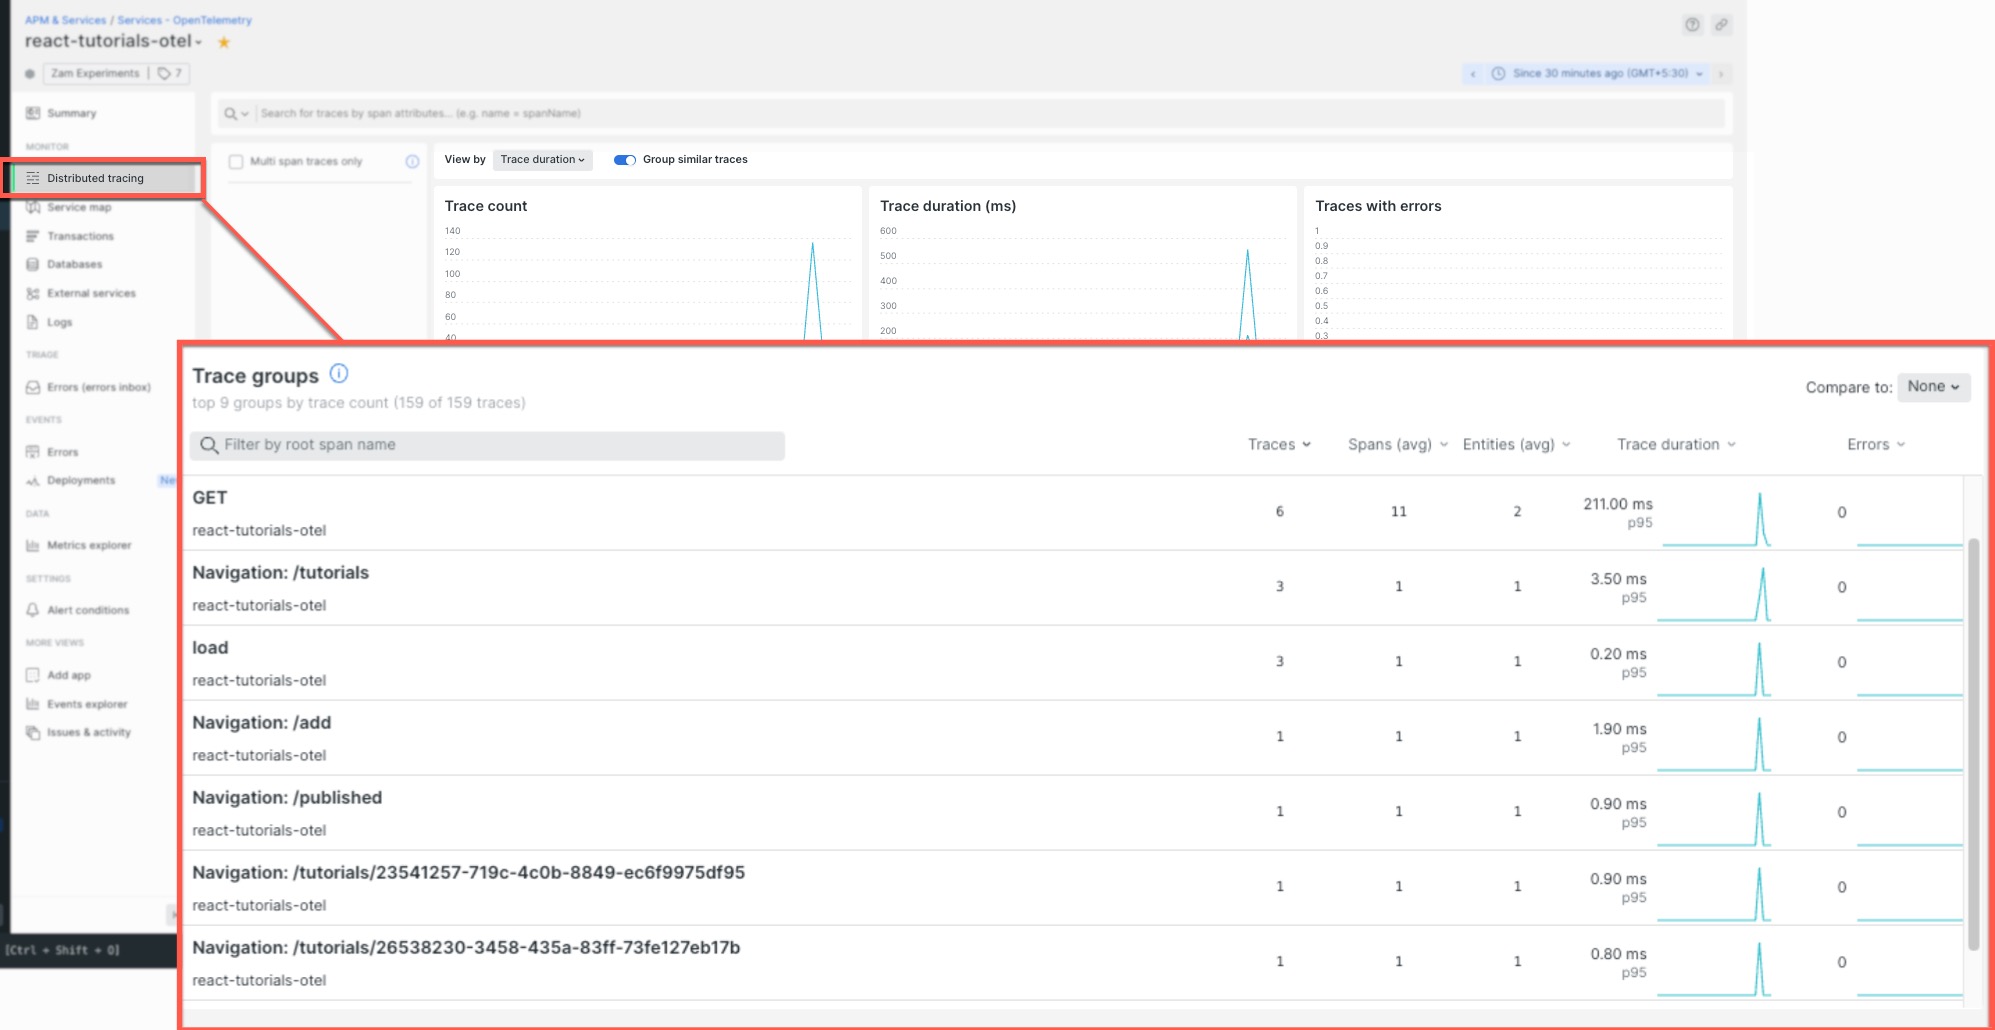
After you’ve deployed your React application, traces will be generated by the OpenTelemetry instrumentation you added. You can view the traces that were captured, including your HTTP calls, by selecting Distributed tracing:
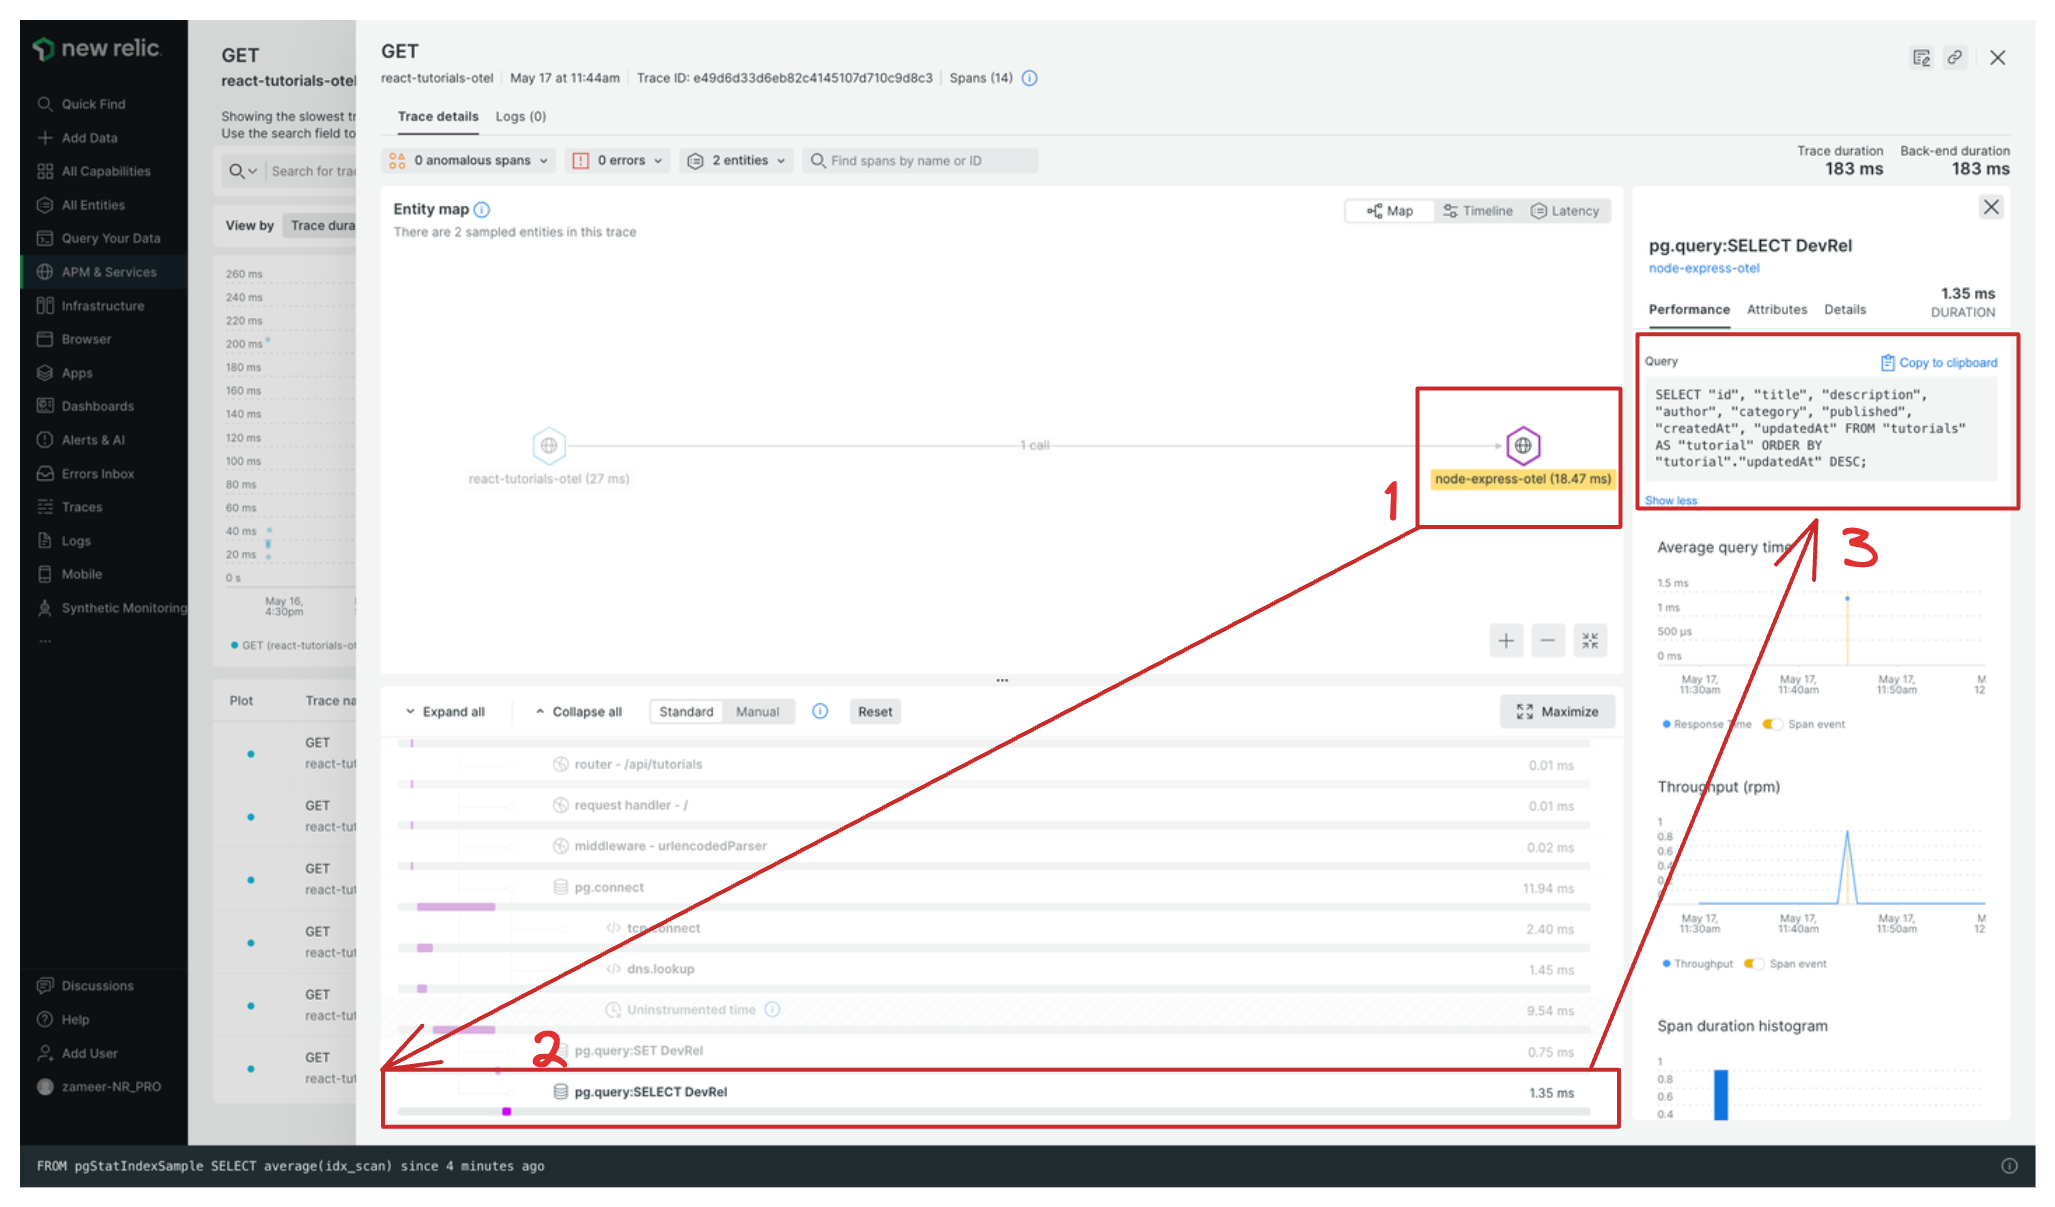
In this next example screenshot:
When you select a trace, you can see the entity map. In this example, you see that the React app has made one call to the Node app (node-express-otel).
In addition, you can see more details about each span. This example shows selecting one of the PostgreSQL database spans.
From here, you can see details about this span, such as the query that was executed for this HTTP call.
In this short video demo, you’ll see distributed traces on the service map, including the total number of calls to the Node.js entity and also the traces from within the Node entity itself.
As you’ve learned in this blog post, when setting up OpenTelemetry for full-stack JavaScript applications, you need to consider the right packages for both web apps and Node.js: the @opentelemetry/core package, the @opentelemetry/sdk-node package, the @opentelemetry/sdk-trace-web package, and the OTLPTraceExporter API. OpenTelemetry offers many official npm packages, many of them contributed by the community. Not all packages will be suitable for your needs, and loading unnecessary packages can increase the build size of your apps.
After you’ve integrated OpenTelemetry instrumentation into your apps, it generates telemetry data that can be useful for proactively optimizing and debugging your JavaScript apps. Distributed traces can also help you identify the correct pain points in larger systems.
Next steps
Explore OpenTelemetry by using the sample application with the PERN stack provided in this GitHub repository: github.com/newrelic-experimental/pern-js-otel.
Subscribe to my newsletter
Read articles from Zameer Fouzan directly inside your inbox. Subscribe to the newsletter, and don't miss out.
Written by

Zameer Fouzan
Zameer Fouzan
Zameer Fouzan is a Lead Developer Relations Engineer at New Relic with a strong background in full-stack development. He’s passionate about web technologies, cloud-native solutions, open-source software, and observability. Zameer enjoys exploring the latest developer trends and sharing his knowledge to support and empower the developer community.