Debugging the Arduino
 Donald Koech
In the past few years,the Arduino board has been my go-to-Micro Controller Unit(MCU) board for hobby and school projects.And as any Engineering, tech student or hobbyist would tell you,bugs come along and here is where debugging comes in.
BUGS
A term referring to a type of problem you might come across when connecting those wires,uploading code;basically if it doesn't work,there's a bug somewhere,unless you're the bug yourself.
Debugging is the process of confirming that, one by one, many things that we believe to be true and functional in our code are true.
~Arduino
So how do we identify them and choose the best method to debug?Let's find out.
METHODS FOR DEBUGGING
Well,depending on the application and the resources you have,I would classify the methods into 4 categories;
Software debugging methods
Hardware debugging methods
Dedicated debugging tools
Debugging Wireless Communications
Examples or representations for each are also given.
Software debugging
As the name suggests,this technique mostly or wholly involves the software part of the project,and has to do with the program or code and in our case,the Arduino Integrated Development Environment(IDE).
COMPILER
A compiler is a special program that translates a programming language's source code into machine code, bytecode or another programming language.
In the Arduino IDE,right when trying to upload code to the board,you might get a red indication of an error and directed to the line(s) of code affected.This is often accompanied by an error in form of text,and all you need to do is follow the instruction and fix it,be it a syntax error-commas or a wrong function used ;being the common cause of it.
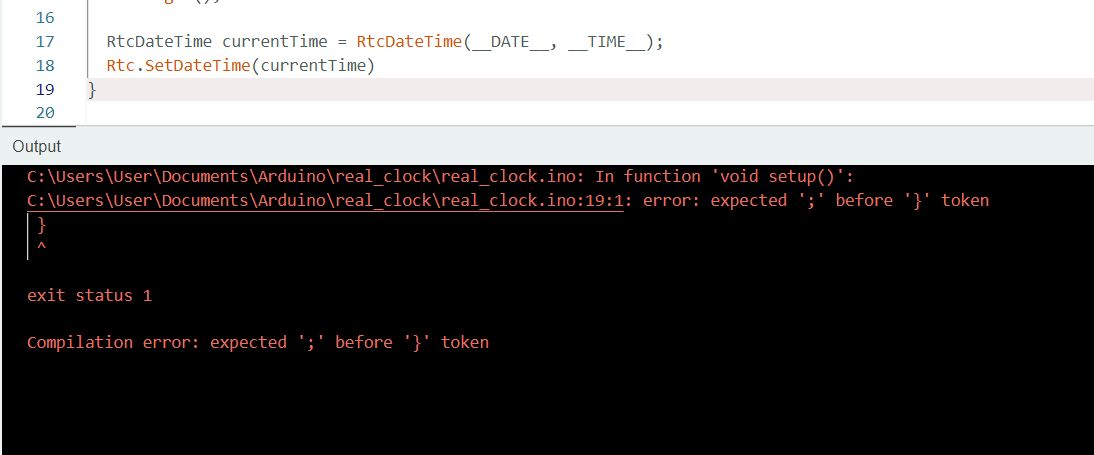
fig.1: a syntax error on line 18 is an example of a compiler error.
ARDUINO DEBUGGER
Arduino IDE 2 onwards has a debugging feature which can be accessed on the IDE interface and is compatible with a some boards i.e;SAMD boards-family of ARM-based processors that are available on certain boards in the Arduino Ecosystem.
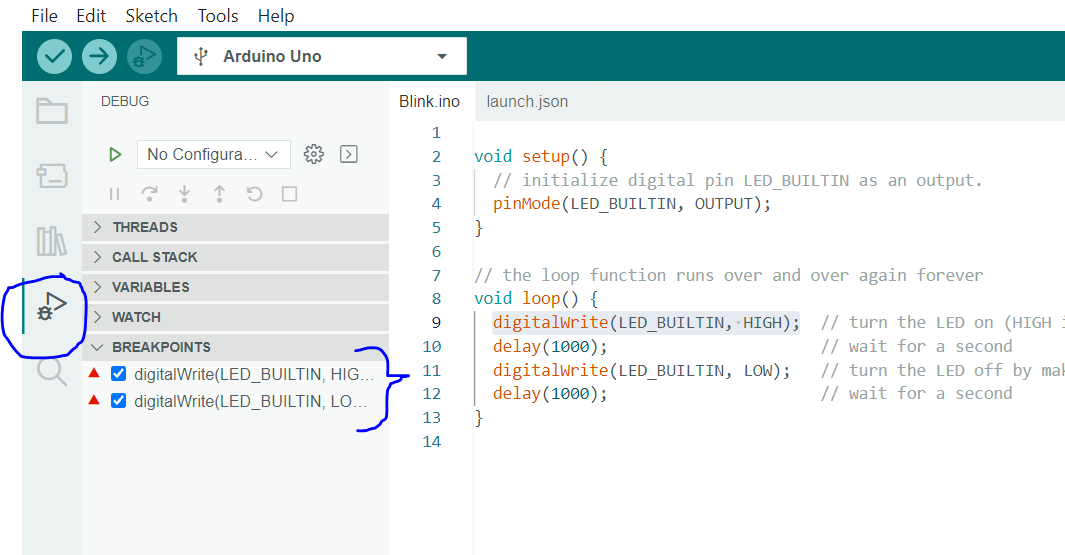
fig.2: the debugger in the Arduino IDE.
One has to have the correct hardware,after which you can create your own breakpoints where you want the program to pause,more info on the arduino documentations here.
SIMULATOR
I have used tools like TinkerCad and it could serve as a method to anticipate what would happen if a certain set up is run,giving one an opportunity to debug the issues or make certain of no corrections to be made on the actual circuit.
It is an easy-to-use and have lots of hardware tools to choose from.
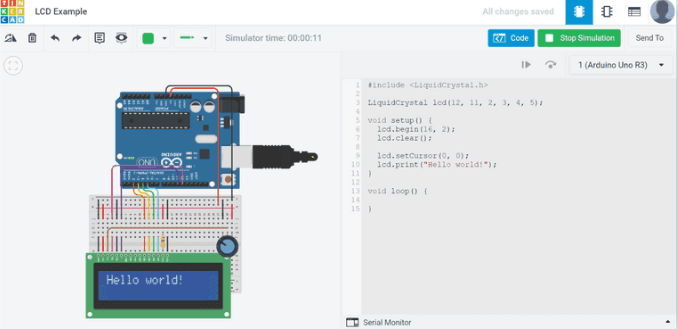
fig.3: Tinkercad software interface.
Hardware debugging
While this cannot stand alone,I still find it necessary to have its own section.
LEDS
A common method to show if a certain command arrived at its destination,and perhaps an easy one too.This can be done using the in-built LED or even an external one that you can add to a circuit.
Using an LED is advantageous since it provides a visual representation of whatever is happening in the backend.
IN CIRCUIT DEBUGGER(ICD)
SAMD boards feature on-chip debug capabilities ;giving them the ability to use external ICDs like Atmel-ICE while Arduino Zero boards have an on-board Embedded Debugger(EDGB),meaning it doesn't require an additional hardware setup to use the debugging feature with the IDE 2.
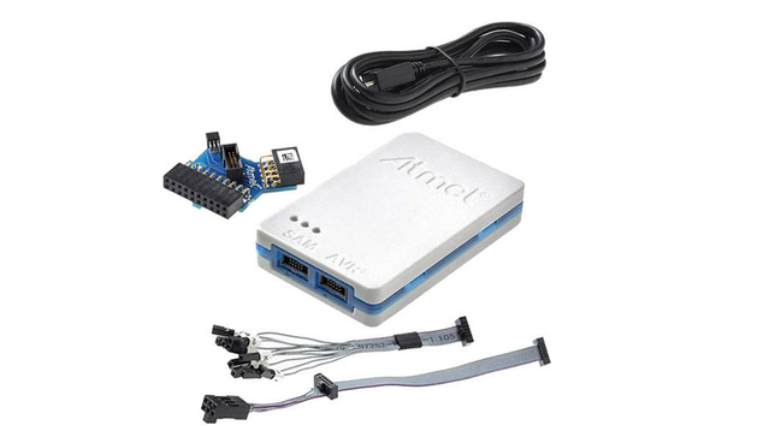
fig.4: Atmel-ICE.
Debugging Tools
These are the general tools that are used generally for any type of electronics project and not necessarily Arduino.
OSCILLOSCOPE
An Oscilloscope is a tool for visual representation of signals.
An oscilloscope displays voltage changes over time as a graph, with voltage represented on the vertical axis (Y-axis) and time on the horizontal axis (X-axis). It helps in analyzing and troubleshooting electronic circuits, measuring signal frequencies, amplitudes, and durations.
A digital Oscilloscope contains an Analog to Digital Converter(ADC) and as expected;works faster and is more accurate than its predecessor,the Analog one.
LOGIC ANALYZERS
A logic analyzer is another valuable electronic instrument used in digital systems and embedded design to capture, display, and analyze digital signals.
This tool consists of several digital inputs pins capable of detecting whether an electric signal is at a specific logic level (1 or 0)
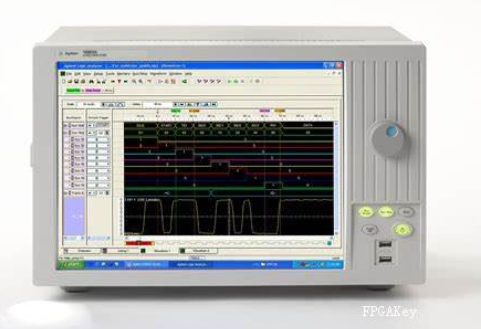
fig.5: logic analyzer credits: FPGA key
Debugging Wireless Communications
Wireless Communication provide an alternative faster way of transmitting and receiving data but comes with its own challenges especially when you can't seem to find the issues causing slow,inefficient or wrong output.
The common method one would use is checking data logs on transmitting and receiving ends,(check more on acknowledge flags)then go further to do analysis using tools discussed earlier,but what if you simply want to analyse data in between?What if we need to verify that the wireless transceiver configuration of a particular embedded system is correct, for example, its transmission power?
Here we could then use a Spectrum analyzer,which measures magnitude of a signal against its frequency.Using this device ,one can verify the transmission and reception power, the number of bytes transmitted, and the frequency it is supposed to transmit.Debugging could then be done as one wishes.
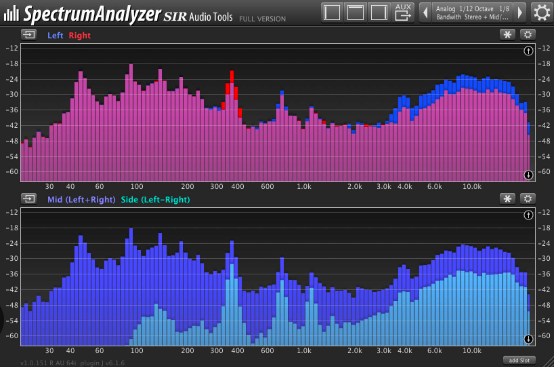
fig.6: spectrum analyzer interface ,credits:SIR Audio tools.
REcap
All through the article,any method for debugging starts with whatever hardware and/or software you have,which then dictates largely what you would use for debugging.Goodluck finding them bugs!
The author is a second year Electrical Engineering student using this platform to learn and share insights into the world of tech.
Subscribe to my newsletter
Read articles from Donald Koech directly inside your inbox. Subscribe to the newsletter, and don't miss out.
Written by

Donald Koech
Donald Koech
Here to learn,write and contribute onnengineering and tech in general. Follow me on all channels.