Containerized JVM OOMKilled problem
 Piotr
Piotr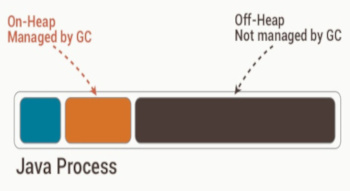
Symptoms
You have deployed your container to Kubernetess. You are using Netty to utilise your hardware in most efficient manner.
After some time you are seeing memory usage that is increasing. Expecting some memory leaks you connect to a jvm to profile your app, but the only thing you see is that resources are under control. Heap and off-heap reports stable values, but Kubernetess shows that it increases over time. Finally the app gets OOMKilled by Kubernetess as it exceeded the limits.
Reproduction
Let's reporduce above example, using just Docker.
Here is a repository with sample app: https://github.com/piotrdzz/java-malloc/
First of all, we gonna use grpc. The server implementation will use Netty. We will performance load our app with Gatling + grpcPlugin.
    private static StringBuilder multiplyInputName(GreetingsServer.HelloRequest req) {
        StringBuilder builder = new StringBuilder();
        for (int i = 0; i < 100; i++) {
            builder.append(req.getName()).append(";");
        }
        return builder;
    }
    @Override
    public void sayHello(GreetingsServer.HelloRequest req, StreamObserver<GreetingsServer.HelloReply> responseObserver) {
        //measure();
        StringBuilder builder = multiplyInputName(req);
        GreetingsServer.HelloReply reply = GreetingsServer.HelloReply.newBuilder()
                .setMessage(builder.append("Hello ").toString())
                .build();
        responseObserver.onNext(reply);
        responseObserver.onCompleted();
    }
The server simply takes a text in unary call and returns it multiplied with some addition of "Hello ". We multiply the text to simulate heavy networking traffic.
Thanks to jib: https://github.com/GoogleContainerTools/jib we can create a minimum-size image.
./gradlew clean jibDockerBuild
Now we can run the container:
docker run -p50051:50051 -p5015:5015 pidu/javamalloc
and we can verify whether it is running:
docker ps -a
CONTAINER ID   IMAGE             COMMAND                  CREATED         STATUS         PORTS                                                                                      NAMES
2cd4fbfe60bc   pidu/javamalloc   "java -Xms128m -Xmx1…"   6 seconds ago   Up 5 seconds   0.0.0.0:5015->5015/tcp, :::5015->5015/tcp, 0.0.0.0:50051->50051/tcp, :::50051->50051/tcp   friendly_gauss
Please notice the resource limits that are set up for JVM in build.gradle script. Xmx150m means that heap size won't exceed 150 Megabytes.
Now we will send some requests to our server. Gatling will create 20 users that will constantly interface with our grpc service. Then a short break, and again 20 users. Total time of a test is 202 seconds. Gatling is a great tool for stress testing, recently upgraded to use Java too. https://gatling.io/docs/gatling/tutorials/quickstart/
setUp(scn.injectClosed(constantConcurrentUsers(20).during(100),
                        constantConcurrentUsers(1).during(2),
                        constantConcurrentUsers(20).during(100))
                .protocols(protocol));
We also take care that the input text is a large one to stress the traffic even more.
Let's run gatling and measure the resources metrics provided by "docker stats" command.
./gradlew gatlingRun
Reproduction results
docker stats command tells us as follows:
CONTAINER ID   NAME             CPU %     MEM USAGE / LIMIT     MEM %     NET I/O          BLOCK I/O     PIDS
2cd4fbfe60bc   friendly_gauss   0.10%     355.1MiB / 31.12GiB   1.11%     3.36GB / 278GB   0B / 1.36MB   50
We have used 355MB of memory. How is it possible? As our heap is constrained to 150MB, is the system and off-heap eating 200MB ?
Lets connect to the running app with jconsole:
jconsole localhost:5015
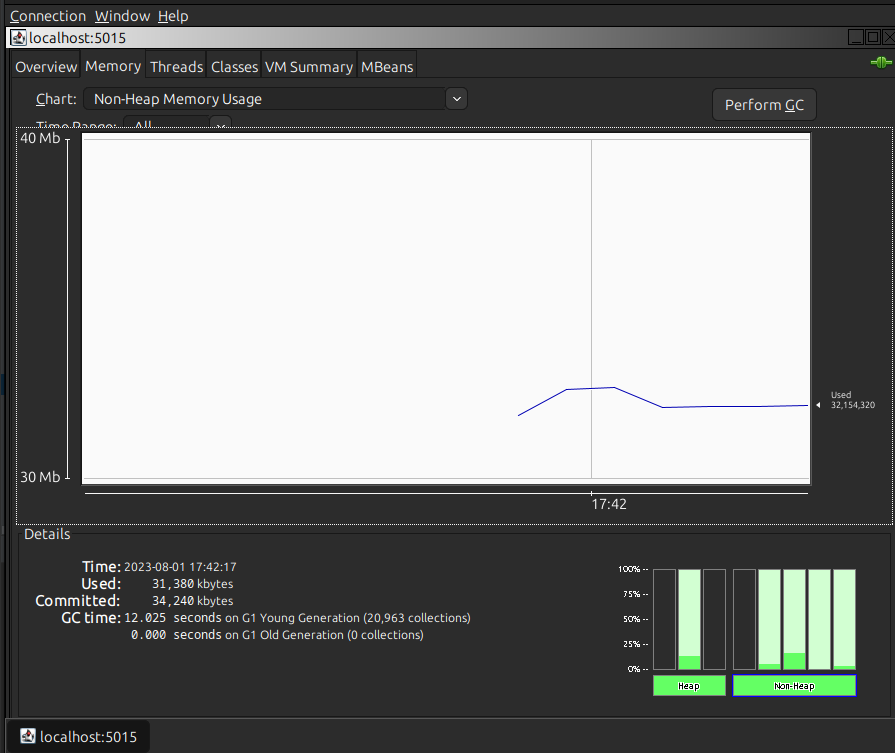
Non-heap memory usage is at the level of 35MB.
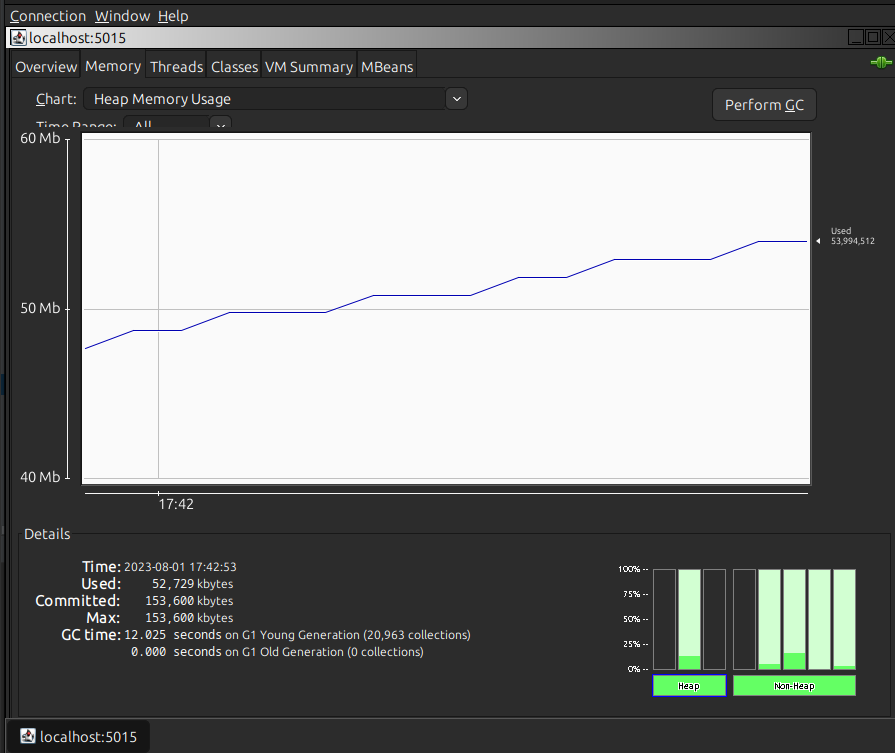
Heap memory usage is 60MB.
Lets run the gatling again and see how the resource usage looks like during load.
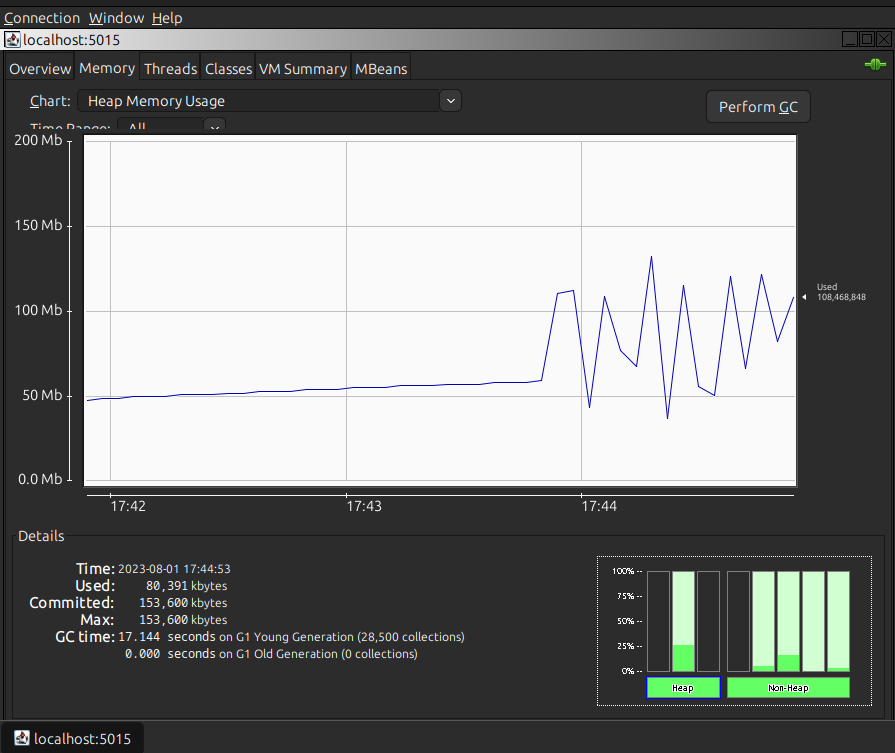
Heap is not even that stressed, and off-heap stays below 40MB. Lets see if somethign changed with total memory used after the run has finished.
CONTAINER ID   NAME             CPU %     MEM USAGE / LIMIT     MEM %     NET I/O          BLOCK I/O     PIDS
2cd4fbfe60bc   friendly_gauss   0.15%     443.2MiB / 31.12GiB   1.39%     6.88GB / 569GB   0B / 2.72MB   41
What?! The container uses now 443MB, where is that memory sinking?
Problem explanation
I have mentioned several times in this article that we are going to use Netty as our embedded server provider. This is not a coincidence. In order to be performant, Netty uses ByteBuffers and Direct Memory to allocate and deallocate memory efficiently. Thus it allocates system meory, so called off-heap memory. But, as we saw in previous chapter, the off-heap memory in our JVM is under controll.
Docker under the hood uses the RSS value of memory used by a processes inside cointaner. What can cause RSS to grow? The memory fragmentation. Here are the links to articles that explain thoroughly the problem:
In short:
by using Direct Memory, JVM no longer is responsible for allocating memory on its own heap. Now we call system methods to allocate system memory for us
by default in linux distributions, glibc is a libc implementation. Its malloc() method is responsible for allocating and deallocating memory
malloc is not exactly tuned to multithreaded applications, and when some memory is deallocated, it may not release it to the system
Thus, java app has released the memory, but system has not received it. Here is our "sink".
How to fix it?
Solution
As told in linked articles, we can tune the MAX_ARENAS parameter. Lets run the test again with new container:
docker run -p50051:50051 -p5015:5015 -e MALLOC_ARENA_MAX=2 pidu/javamalloc
The memory is lower:
CONTAINER ID   NAME                 CPU %     MEM USAGE / LIMIT     MEM %     NET I/O          BLOCK I/O     PIDS
e0f7330f932c   confident_margulis   0.10%     274.4MiB / 31.12GiB   0.86%     3.47GB / 287GB   0B / 1.36MB   31
From 355MB to 275MB. We can see that our setting is working. But as we launch the test again, memory is still growing. It seems that we only slowed the pace.
After 2nd run our memory is: 292MB.
Let's try another solution. We can change the default libc implementation to TCMalloc. In root folder of our repoistory is a Dcokerfile prepared. By installing google-perftools and setting env variable LD_PRELOAD, system will use TCMalloc.
Build the image:
docker build -t org/pidu/ubuntu/tcmalloc .
Change the default base image in build.gradle file:
jib {
    from {
        image = "docker://org/pidu/ubuntu/tcmalloc"
    }
..
}
Notice the docker:// prefix. It tells jib to use local docker cache, and not look for it externally.
Now clean build the containerized app and run it:
./gradlew clean jibDockerBuild
docker run -p50051:50051 -p5015:5015   pidu/javamalloc
The memory after spiking to 280MB settled at 265MB. TCMalloc is giving back some of fragmented memory. When run second time, it settles on 270MB.
I have been also plotting a simple performance metric. How many request we handle per second. Here are the results:
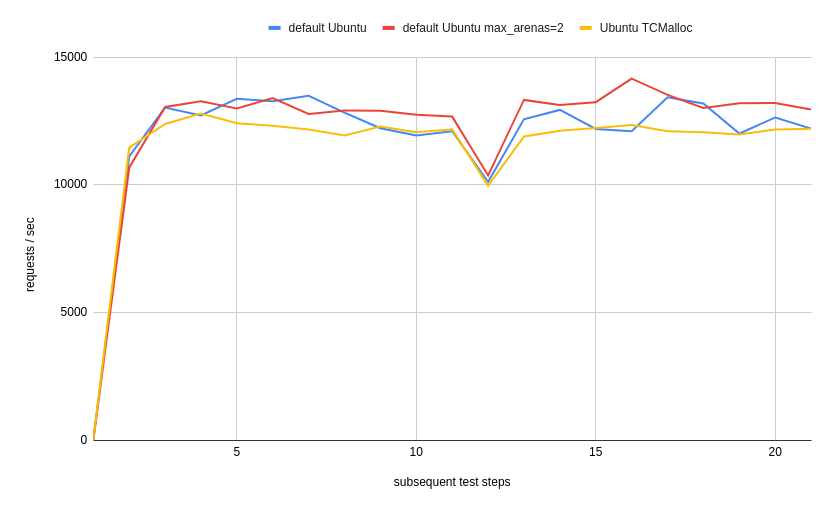
TCMalloc might have some performance impact, but such simple example cannot really capture it. It is strongly advised to measure the impact of different libc implementation.
System memory handling
One may think that trying to manage memory when system has plenty (there is no limit on docker container) is unnecessary. Linux works in a way that it does not waste resources on clearing memory when there is some to be easily allocated. (we can force some clearing as stated here: https://unix.stackexchange.com/questions/87908/how-do-you-empty-the-buffers-and-cache-on-a-linux-system).
If we had a luxury of setting a limit on our container in Kubernetess, we would not have above contemplations. For example, lets run above TCMalloc example with container memory set to 220MB:
docker run -p50051:50051 -p5015:5015 -m 220m pidu/javamalloc
Containers memory jumps to 220MB and Linux starts to clear and clean whatever it can to retrieve space for next allocations. Performance impact is negligible in our test, (but in other applications can be significant) :
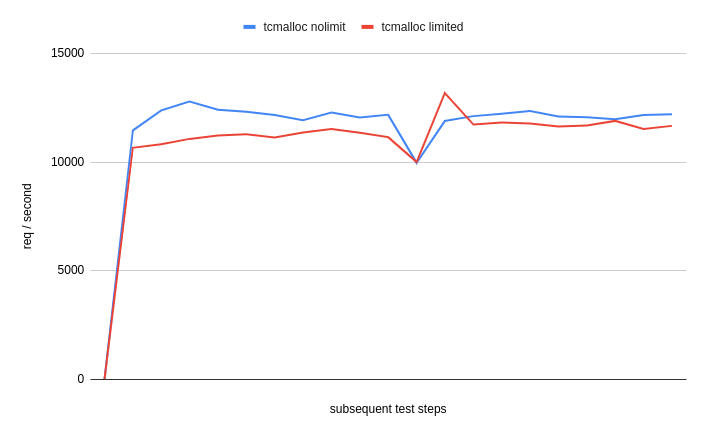
But, what is most important, there is no OOM exception, nothing is being killed. By inducing some memory pressure we just do not allow memory allocations to grow carelessly.
The point is that Kubernetess does not have such hard limits. It does not even use Docker, but generic container specification (https://kubernetes.io/docs/concepts/configuration/manage-resources-containers/#how-pods-with-resource-limits-are-run).
So how does Kubernetess memory quotas work? https://kubernetes.io/docs/concepts/configuration/manage-resources-containers/#how-pods-with-resource-limits-are-run
Container can exceed them, and will be then evicted. Here is the problem. By not setting hard OS memory limits, the memory pressure will not materialize and not force Linux to clean fragmented memory properly. Thus we need to try to keep memory usage at bay manually, otherwise, our pods will get evicted by kubernetess.
Subscribe to my newsletter
Read articles from Piotr directly inside your inbox. Subscribe to the newsletter, and don't miss out.
Written by

Piotr
Piotr
I have a background in Aerospace Engineering. My professional experience spans from shooting hypersonic rockets as a member of Student's Space associacion, through designing 3d models of parts for Aeroderived Gas Turbines and finally to working as an Space Surveillance Engineer. For past years I have been working as a Java developer and loved how powerful tool can it be.