New Relic: Monitoring and Observability Tool
 Bakul Warikoo
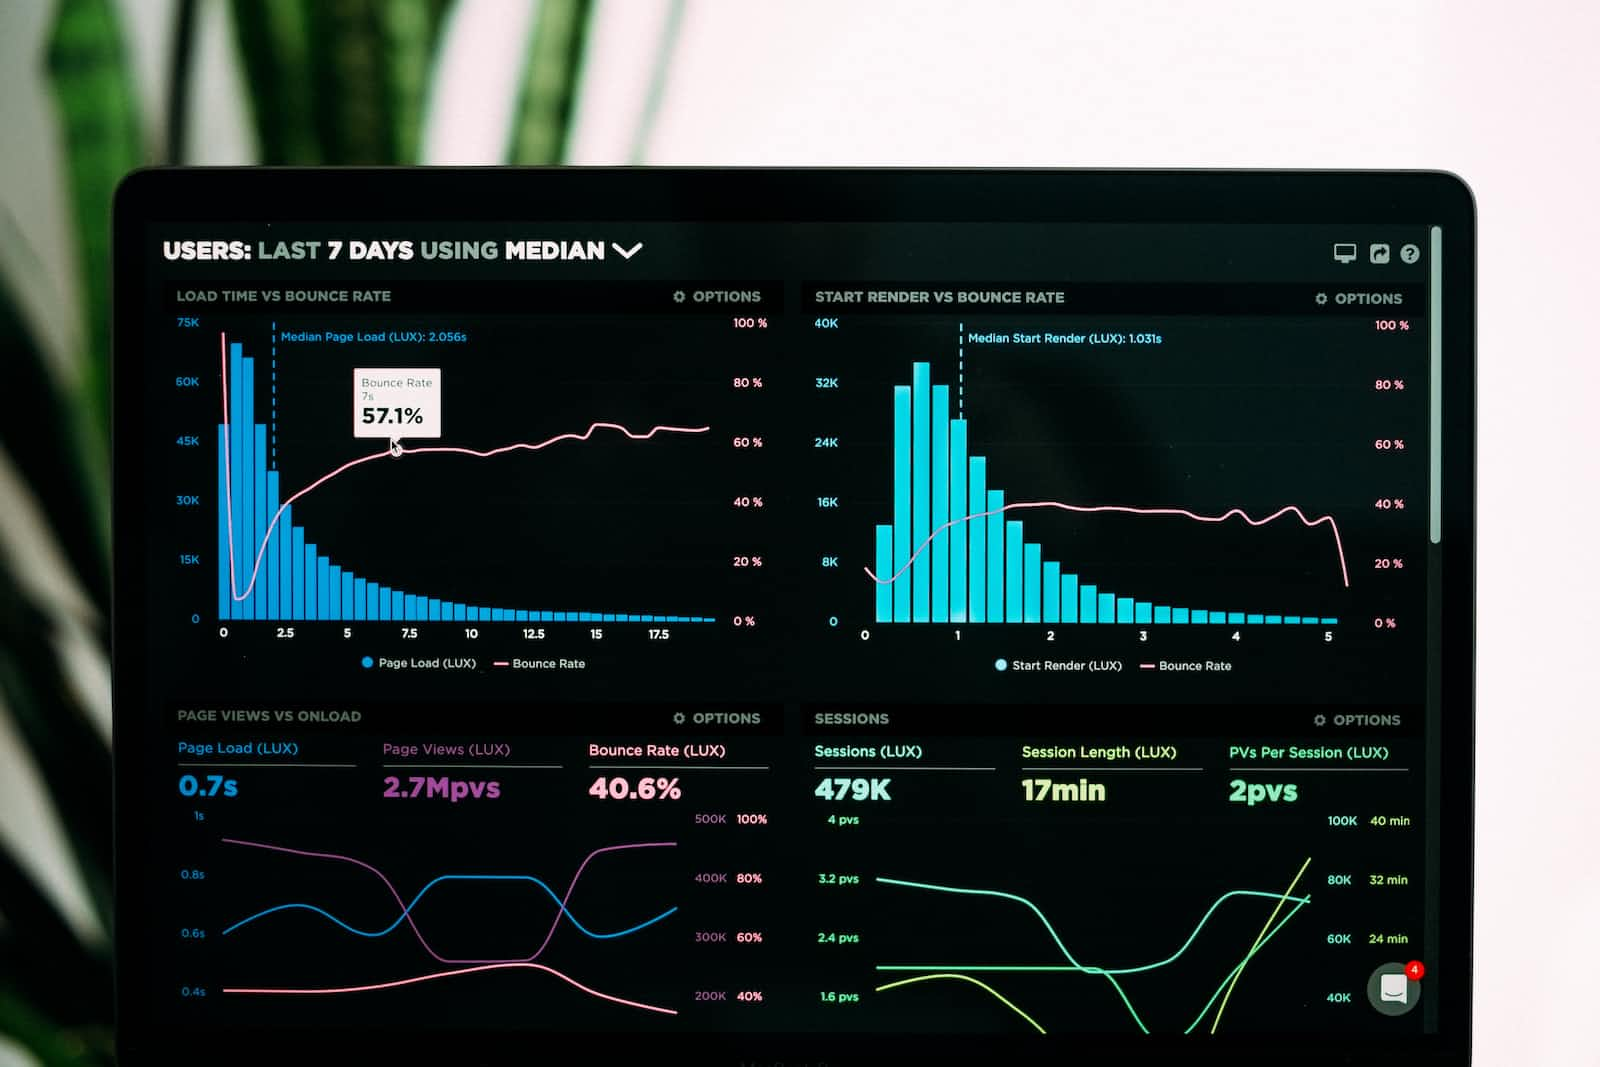
Hi everyone! I hope you're all doing great and taking steps toward your goals. Lately, I've been hearing from many young folks who often get asked about their experience with monitoring tools in interviews. This got me thinking, and I wanted to share some insights in today's blog.
Today, I want to share my experience with New Relic, an observability and monitoring tool. Let's get started!
What is New Relic?
Let's imagine you have a super-smart assistant named Alexa, who helps you with all your tasks around the house. Alexa keeps track of everything you do and lets you know if something needs attention. For instance, if there is a water leakage, Alexa notices it and tells you so you can get it fixed immediately.
Now, in the digital world, New Relic is like your virtual Alexa. It's a tool that helps people who build and manage websites and apps. Just like how Alexa keeps an eye on your home, New Relic keeps an eye on applications, and infrastructure to make sure they're working well at all times.
For example, let's say company A has a website. With New Relic, the company can see how fast their website loads for end users. If the website is slow, New Relic lets them know so they can make it faster. If there is a problem with the website loading/accessibility, New Relic alerts the company by sending them a notification so they can fix it and ensure the availability of the website.
To summarize, New Relic is like a helpful digital assistant that monitors websites and applications, making sure they're running smoothly at all times and telling the people in charge if something goes wrong and needs fixing. It is a Software as a Service platform that is implemented by many companies to monitor their systems.
From this, we understand what is New Relic and why is it important to have New Relic in place. We will now do some hands-on on New Relic to cover different use cases. Are you ready?
Setting up your account under Free Plan
New Relic offers both, free and paid plans, which allow users to do hands-on monitoring of their applications and infrastructure. Today, I will be using the Free Plan.
Go to https://newrelic.com/ and select "Get Started Free". You will be redirected to the following page. Provide your name and email address to get started.
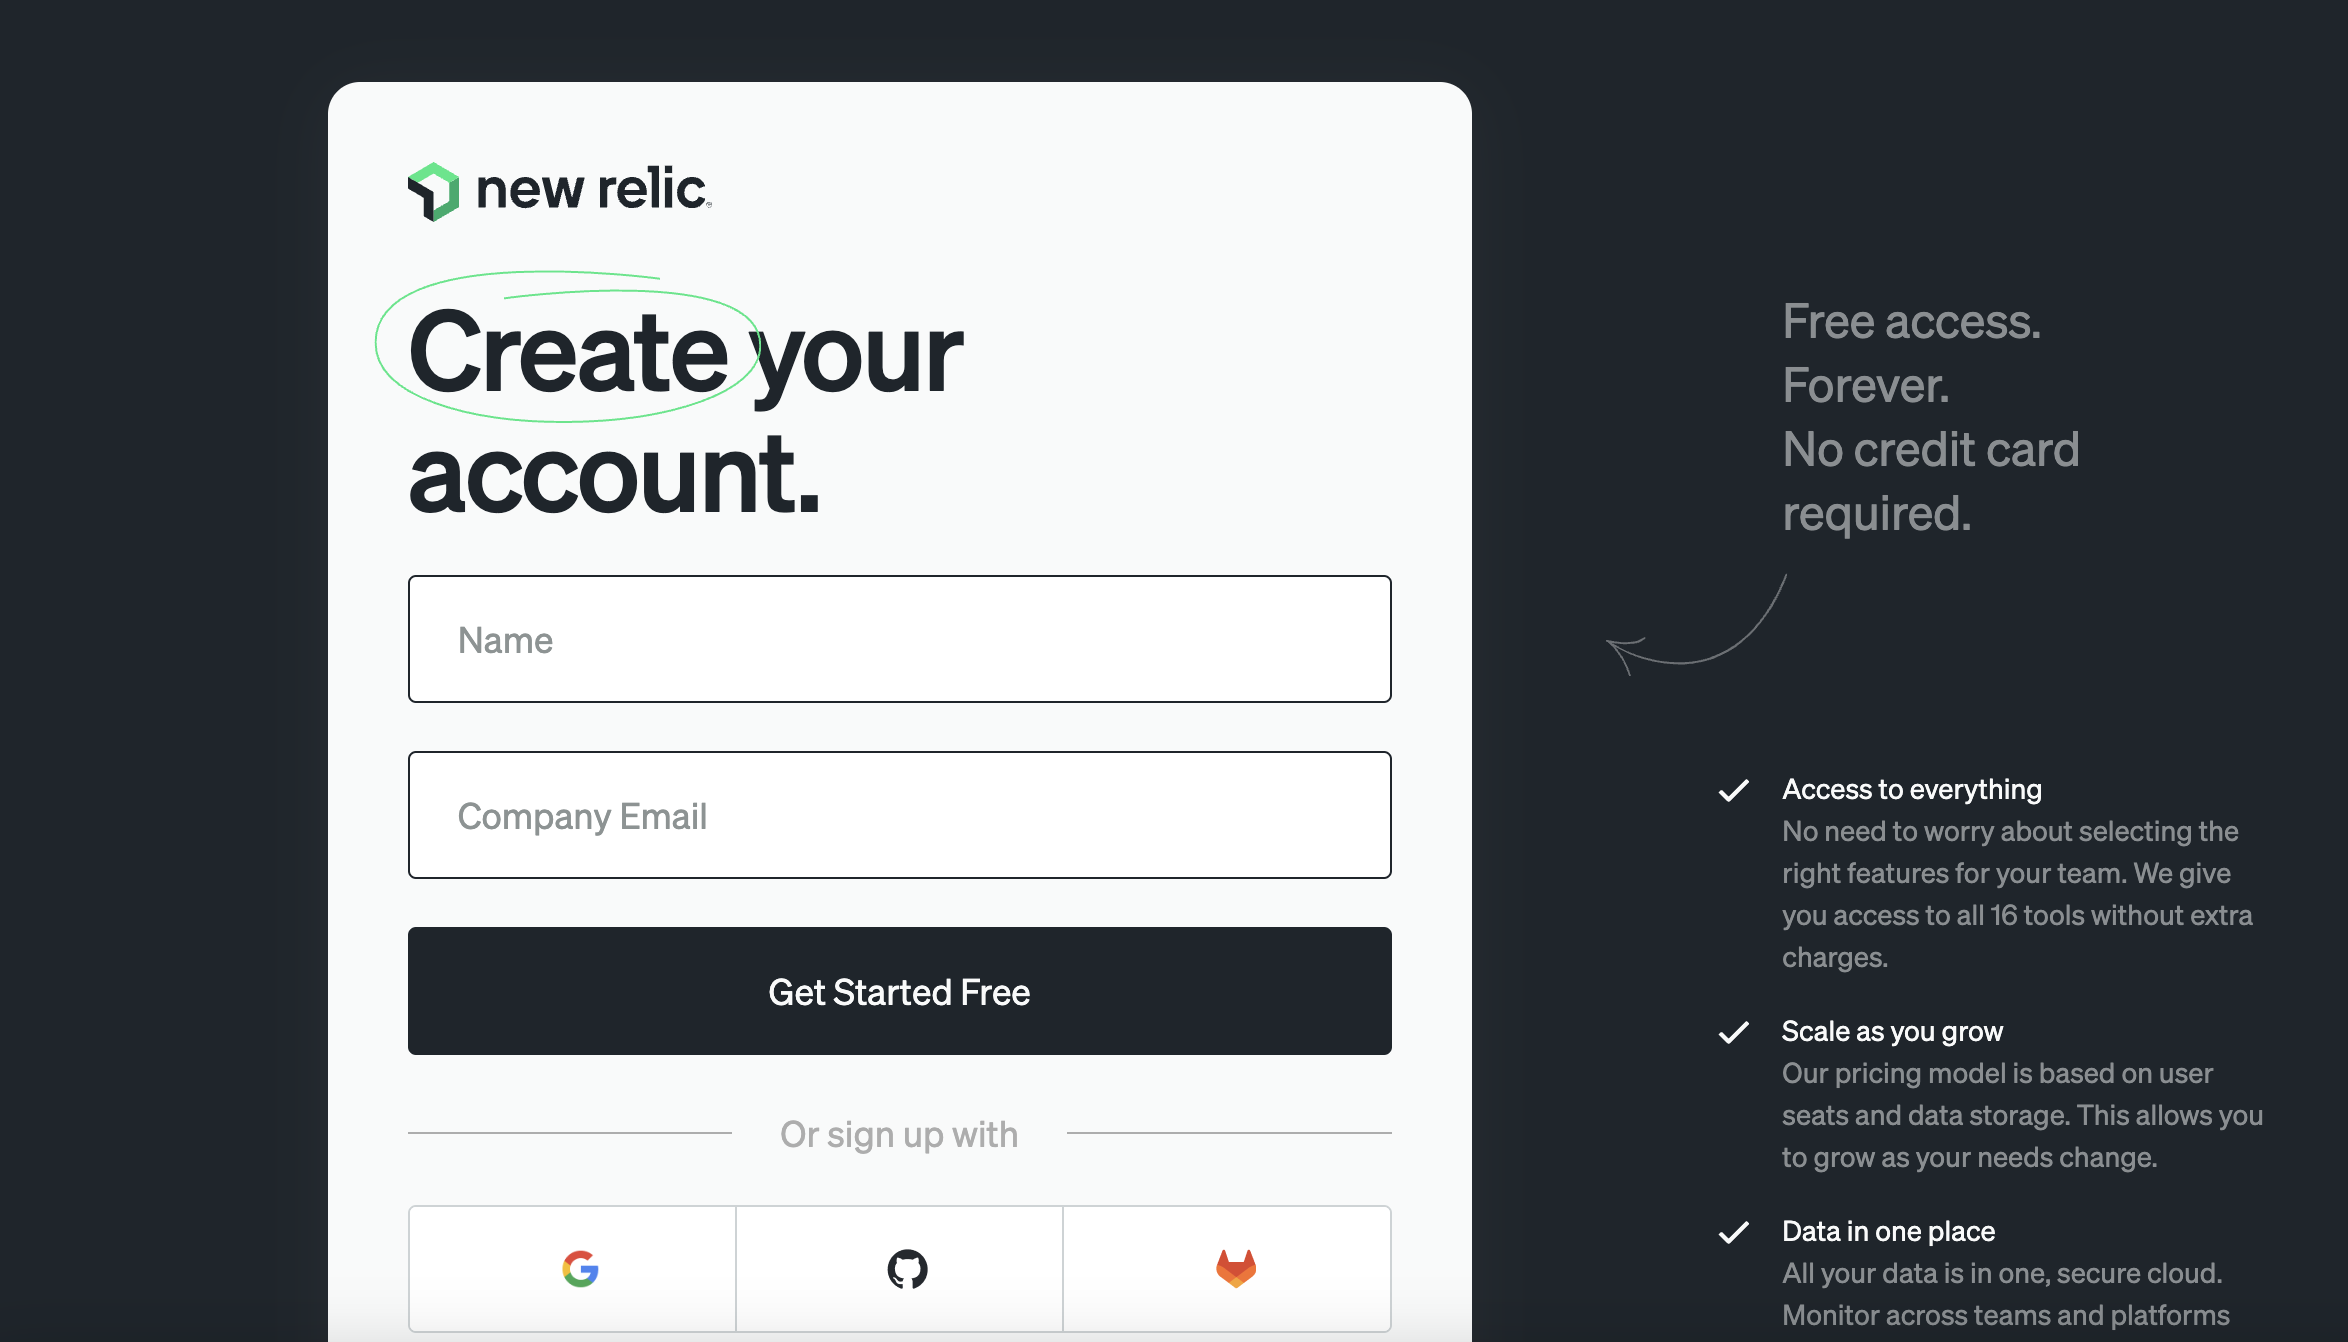
You will receive an email to verify your email and it will ask you to set your password.

On the next screen, it will ask you where to store your data. Select any region and save.

You will land on the home page of New Relic. Congratulations on making it this far!

Hands-on: Monitoring a website
In this hands-on use case, we are going to see how we can configure New Relic to monitor a website for this availability.
There are several features/functionalities that New Relic provides. For this use case, we are going to utilize "Synthetic Monitoring".
From the New Relic home page, select "Synthetic Monitoring" from the left side panel.
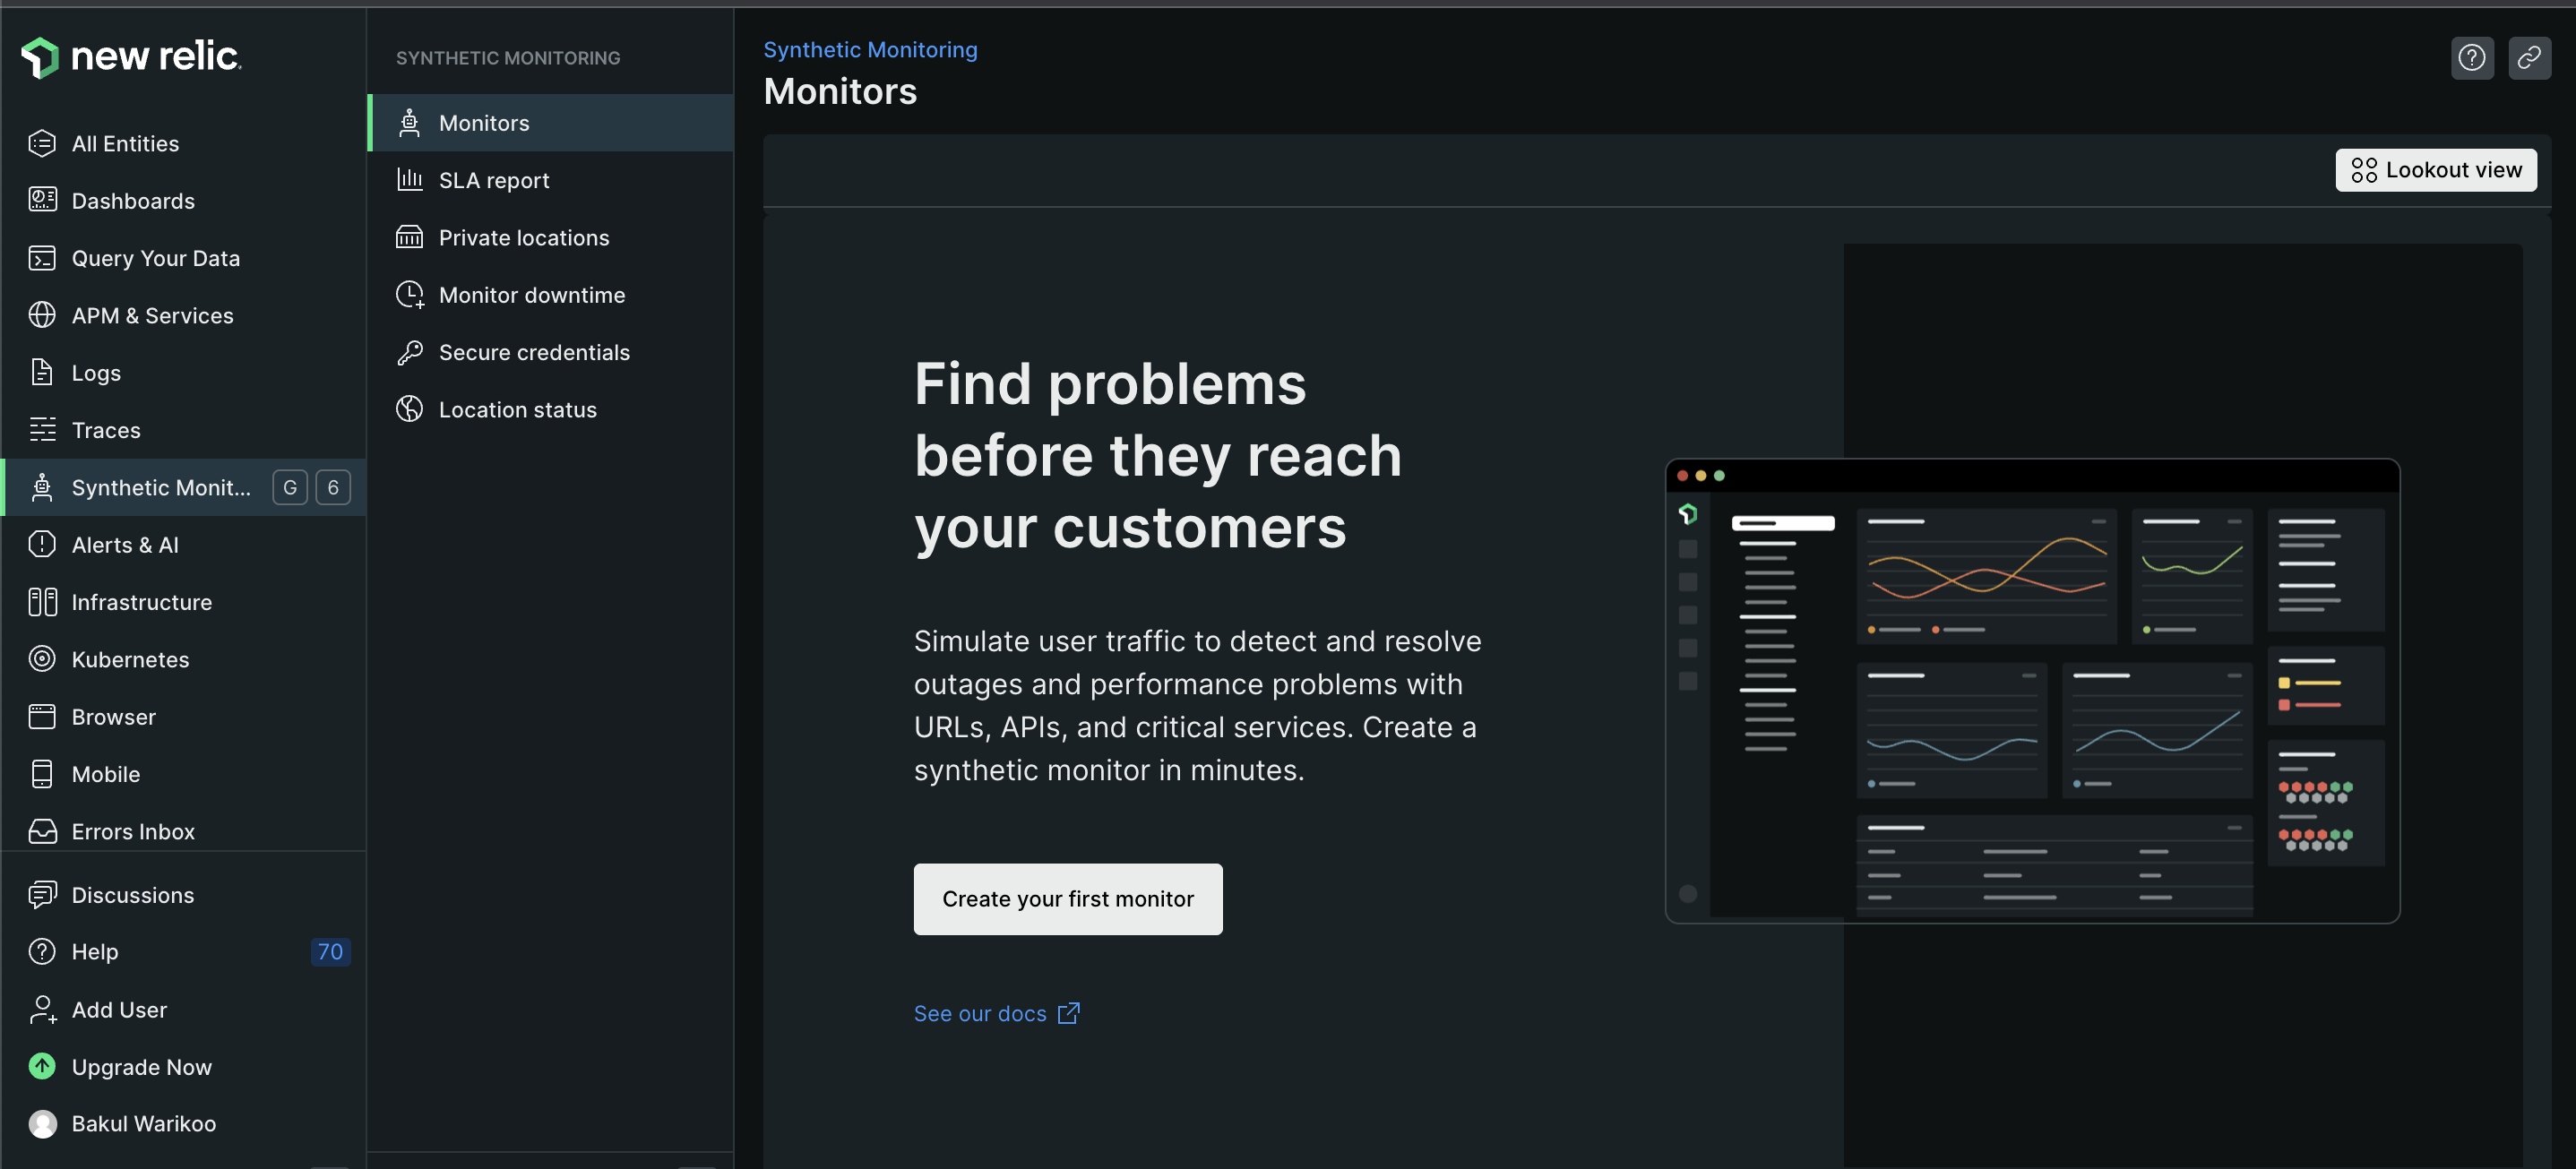
Click on "Create your first monitor" and select monitor type as "Availability". In the next tab, it will ask you to "Configure monitor", and provide the below information as per your choice.
Name: <name for the monitor, it can be of your choice>
URL: <website URL that you want to monitor>
Period: <time interval between two checks done by New Relic>
Under Advanced Options, you can configure the monitor to check for a certain text to be present on the website. For example, if you want to check text "Hello" is present on the landing page of the website. If it is not present, it should alert.

In the next tab "Select location", select at least 3 locations from where New Relic will try to ping the website. You might ask why at least 3 locations - there can be chances that the website might have some issues in one location so to avoid false positives, it is recommended.
After selecting locations, click on Save monitor.

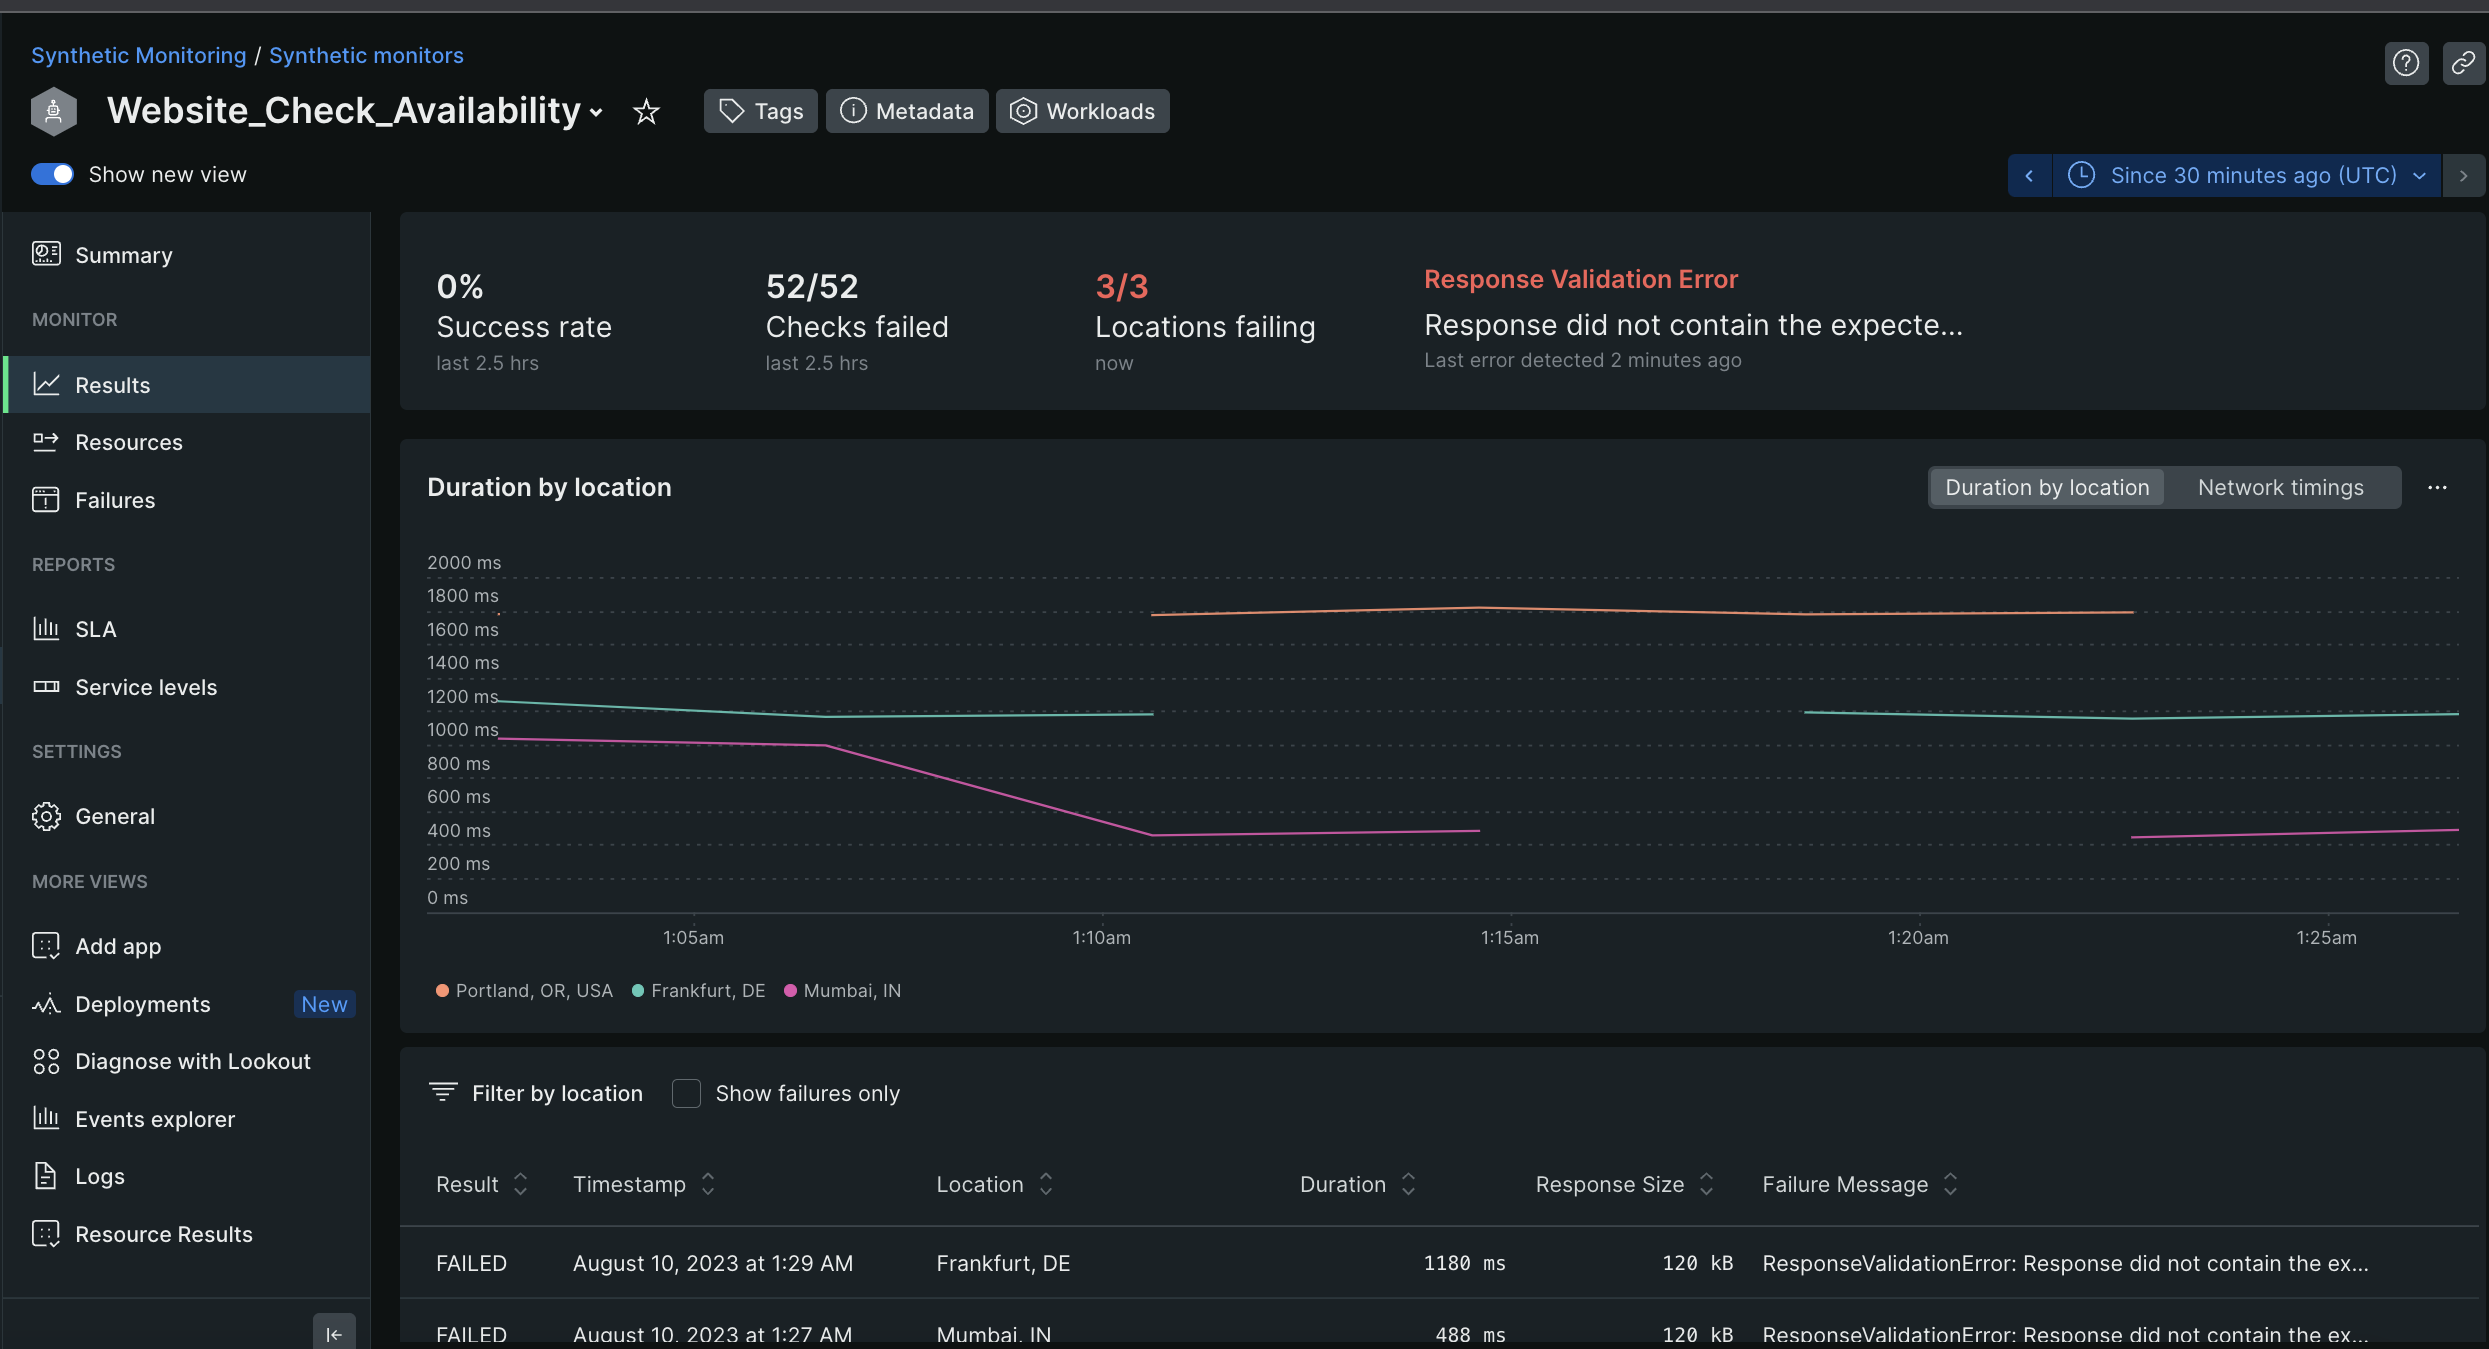
After saving the monitor, you will see the below page. Please wait for a few minutes for it to load with data. If you see the above screenshots, I added Text validation for the word "hello" and I know that the website provided by me does not have "hello" mentioned on their landing page hence, it should fail. We will see that after a few minutes.

Reload the page after a couple of minutes to check the data and status of the monitoring.

As you can see in the above image, it has reported failure in each of the locations. If you want to check the failure message, click on Failures on the left side panel. It will be something like this:
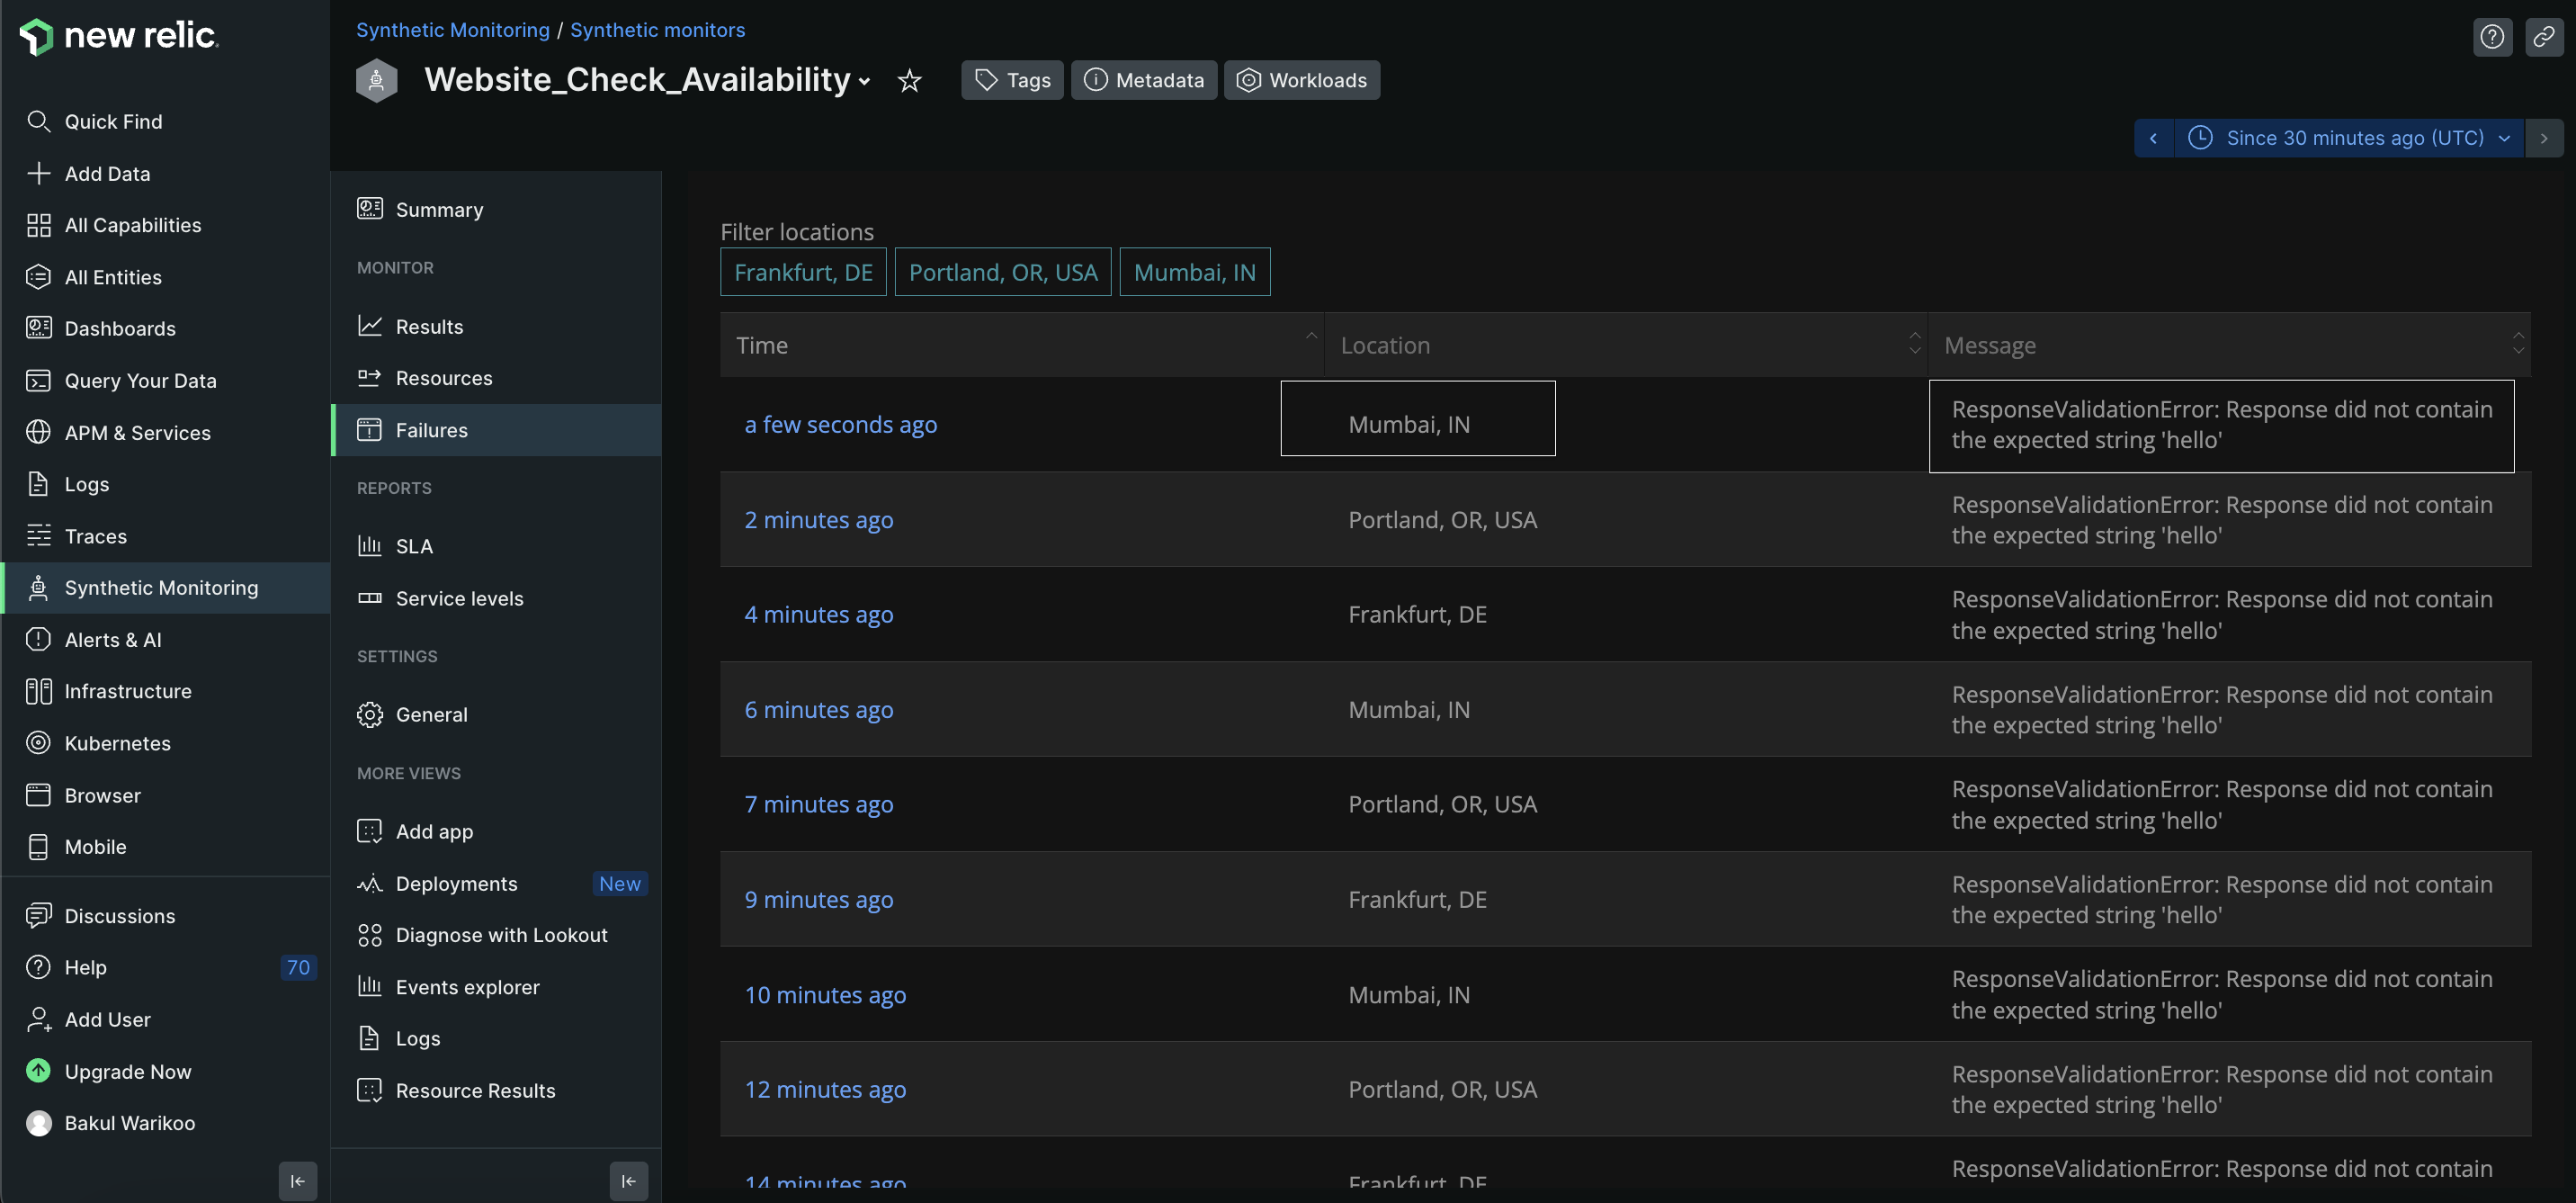
You can also view the results of the monitor by selecting Results instead of Failures as shown below:
Uptil now, we saw how to create a monitor for a website. How will we setup some kind of alert that basically notifies the respective team in case of a failure? We will now set up an alert for this monitor and see how we can notify someone. Shall we proceed?
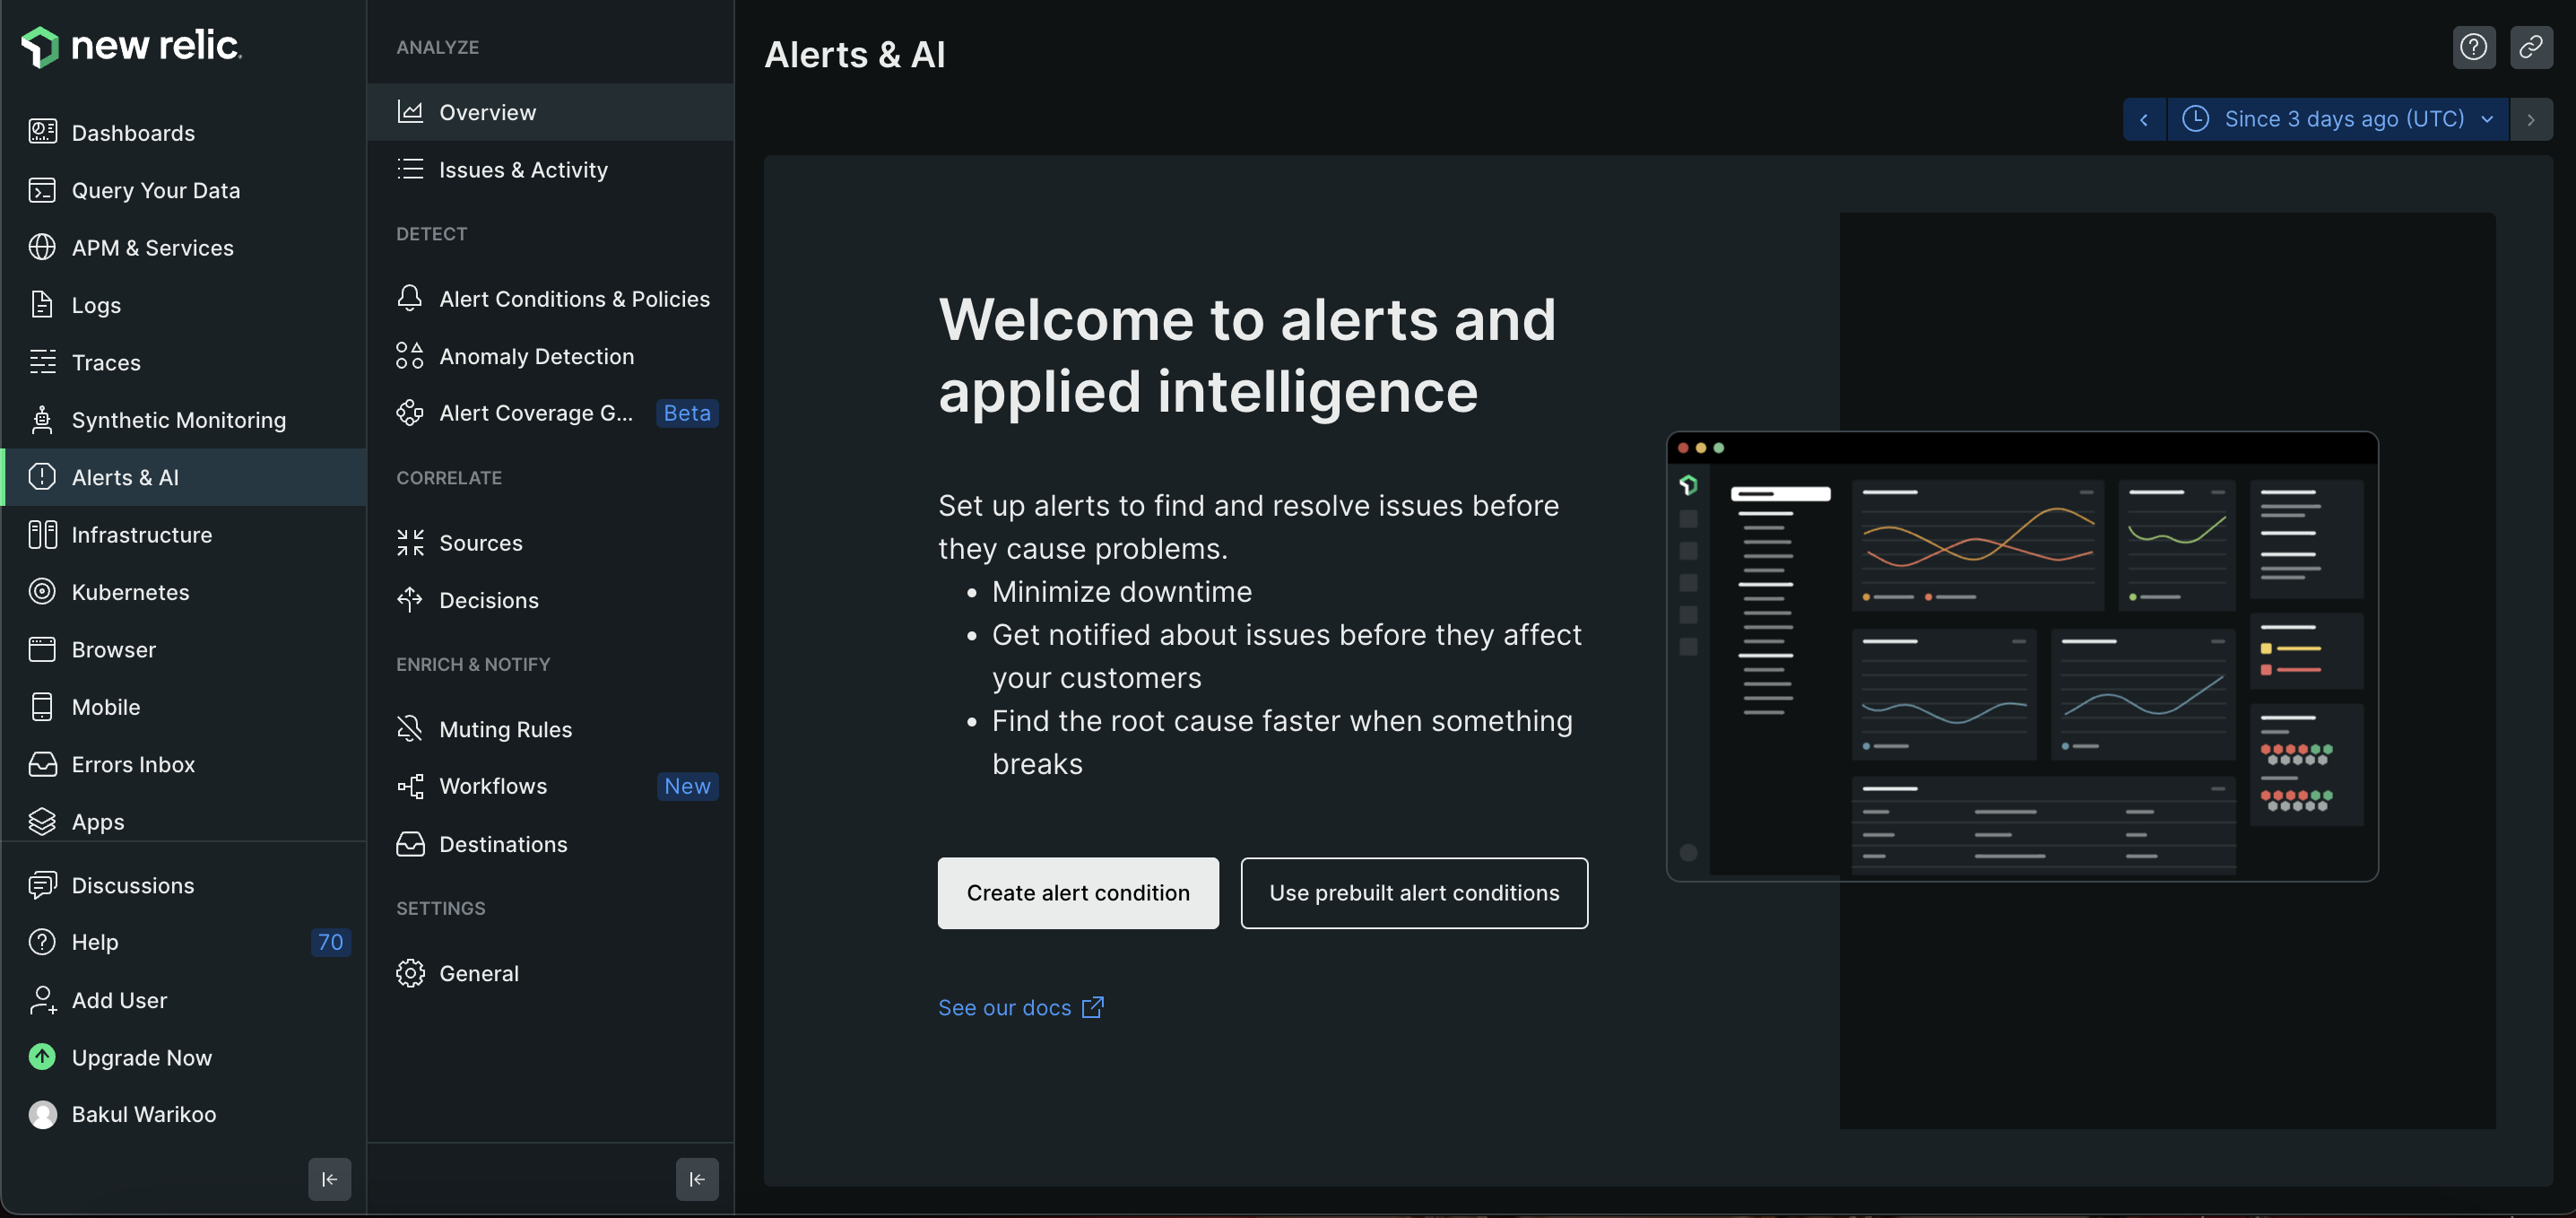
To set up an alert, we are going to utilize "Alerts & AI" capability of New Relic. On the extreme left side panel, you will see this option. Click on that; you will land up on the page asking if you want to create an alert condition. Select Create alert condition as seen in the below image.
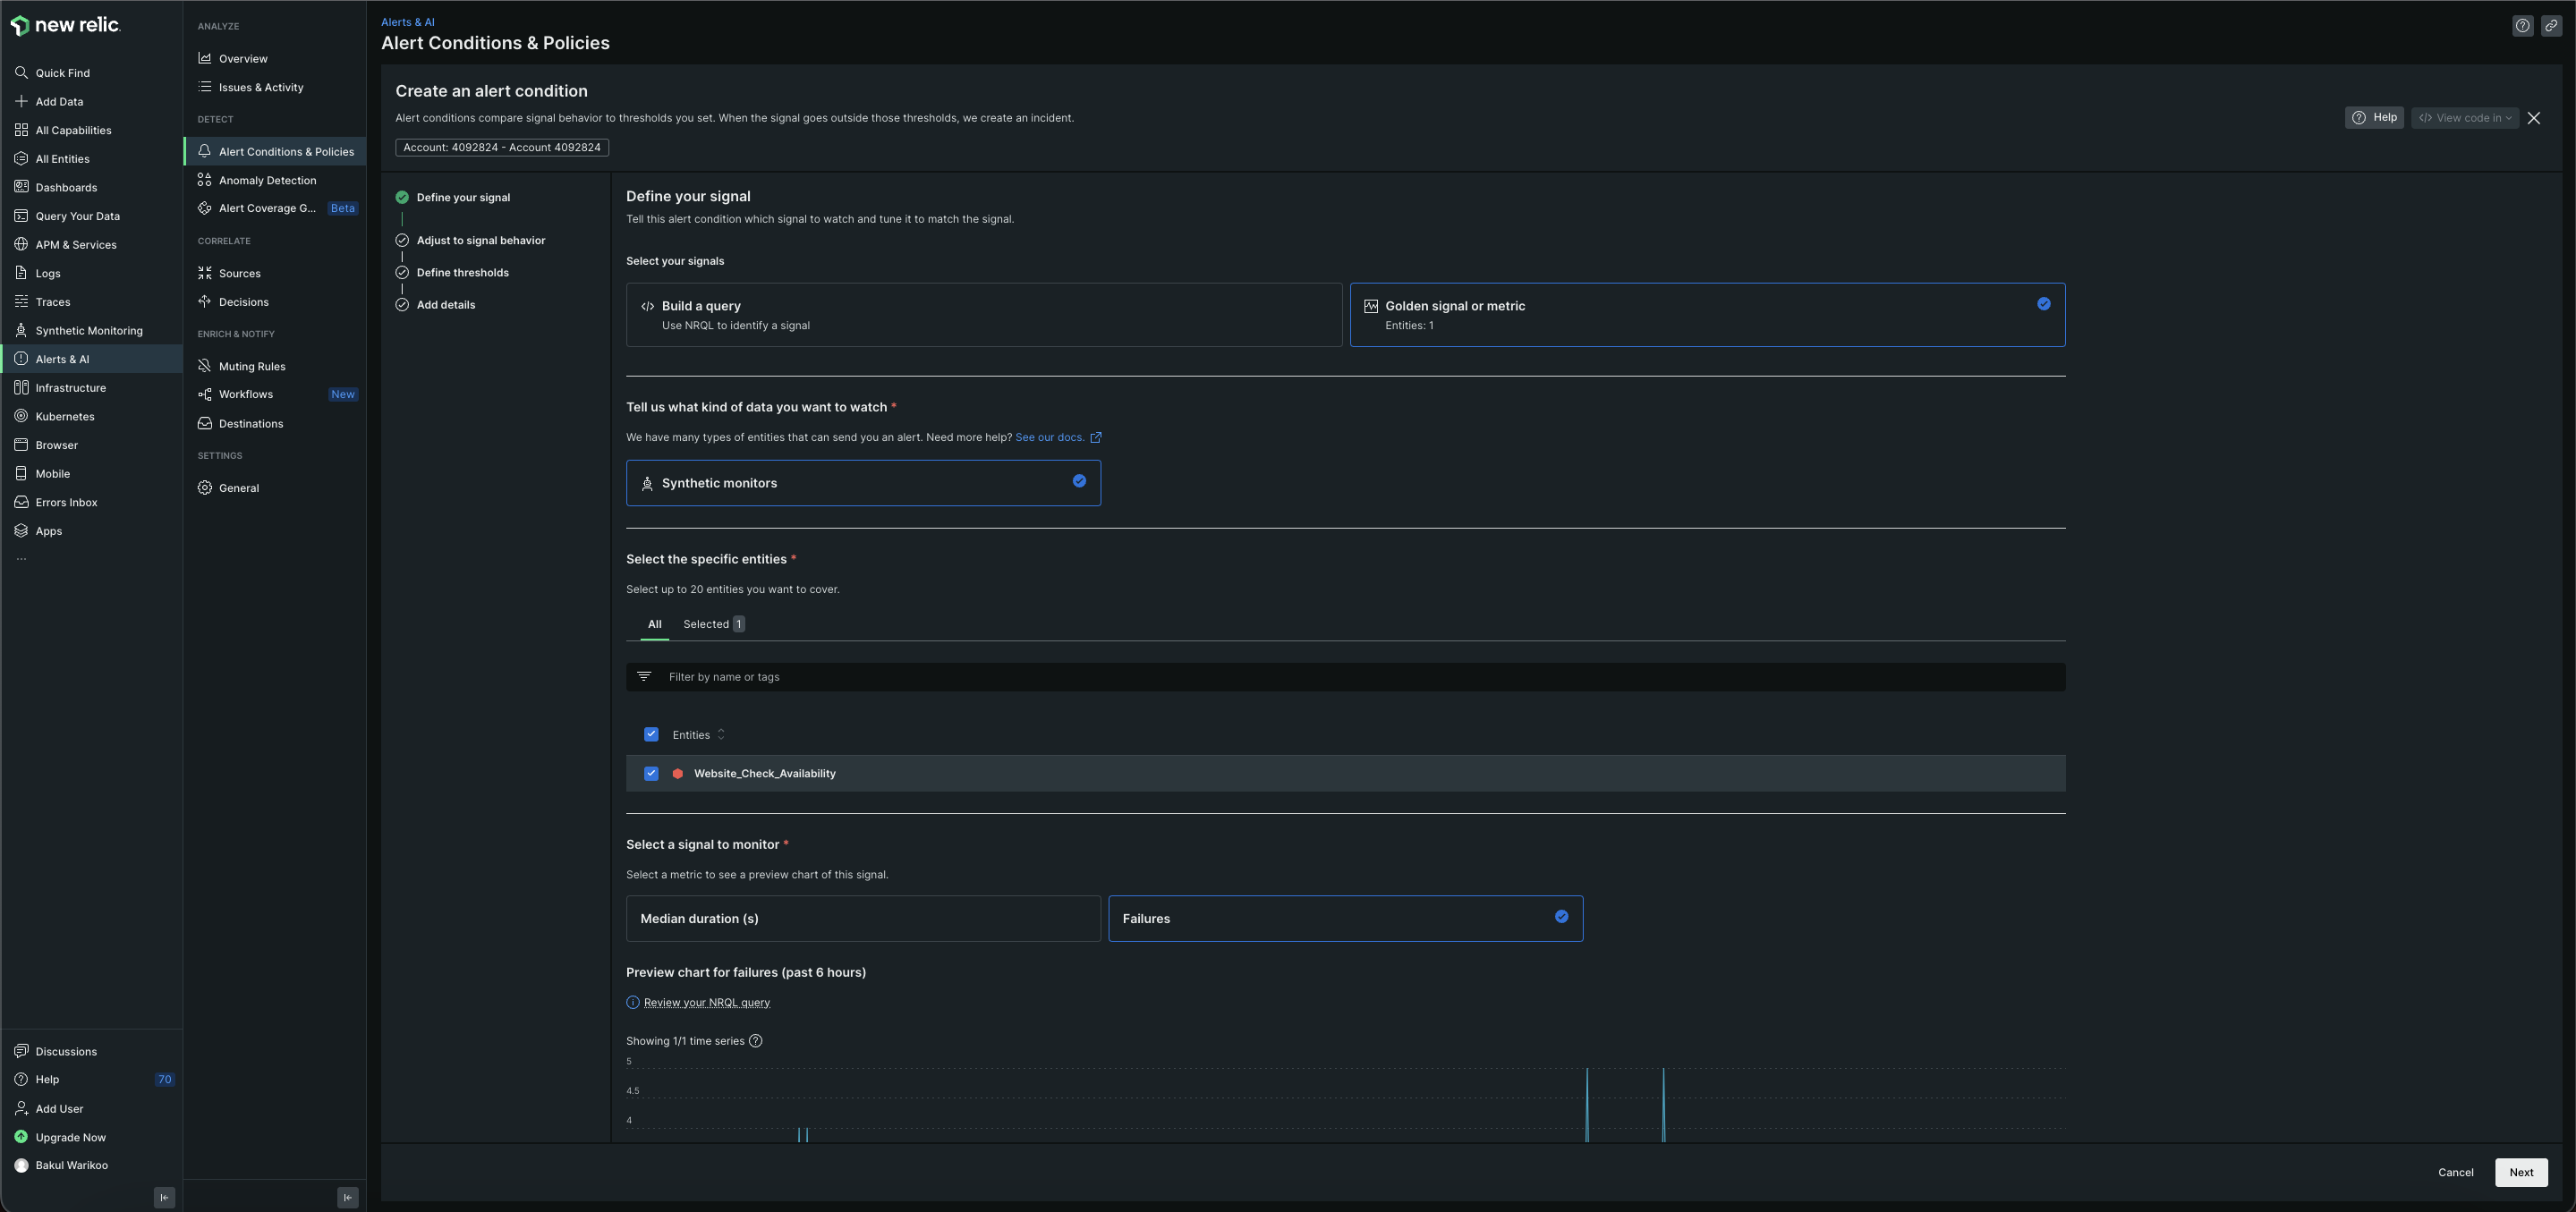
On the next page, it will ask for you to Define your signal. Select Golden Signal or metric; in that you select Synthetic Monitors. It will list down the available synthetic monitors available, select the one you created. After that, select the signal to monitor - this basically means what metric needs to be monitored for an alert to generate; here, I am selecting Failures as the signal to monitor. It can be configured as per the use case. Click on Next.
In the next screen, you can fine tune how data is group into time intervals. This depends on the use cases so you can skip this section. For my use case, I have made a change to the option Window duration - changed it to 5 mins. Click on Next.

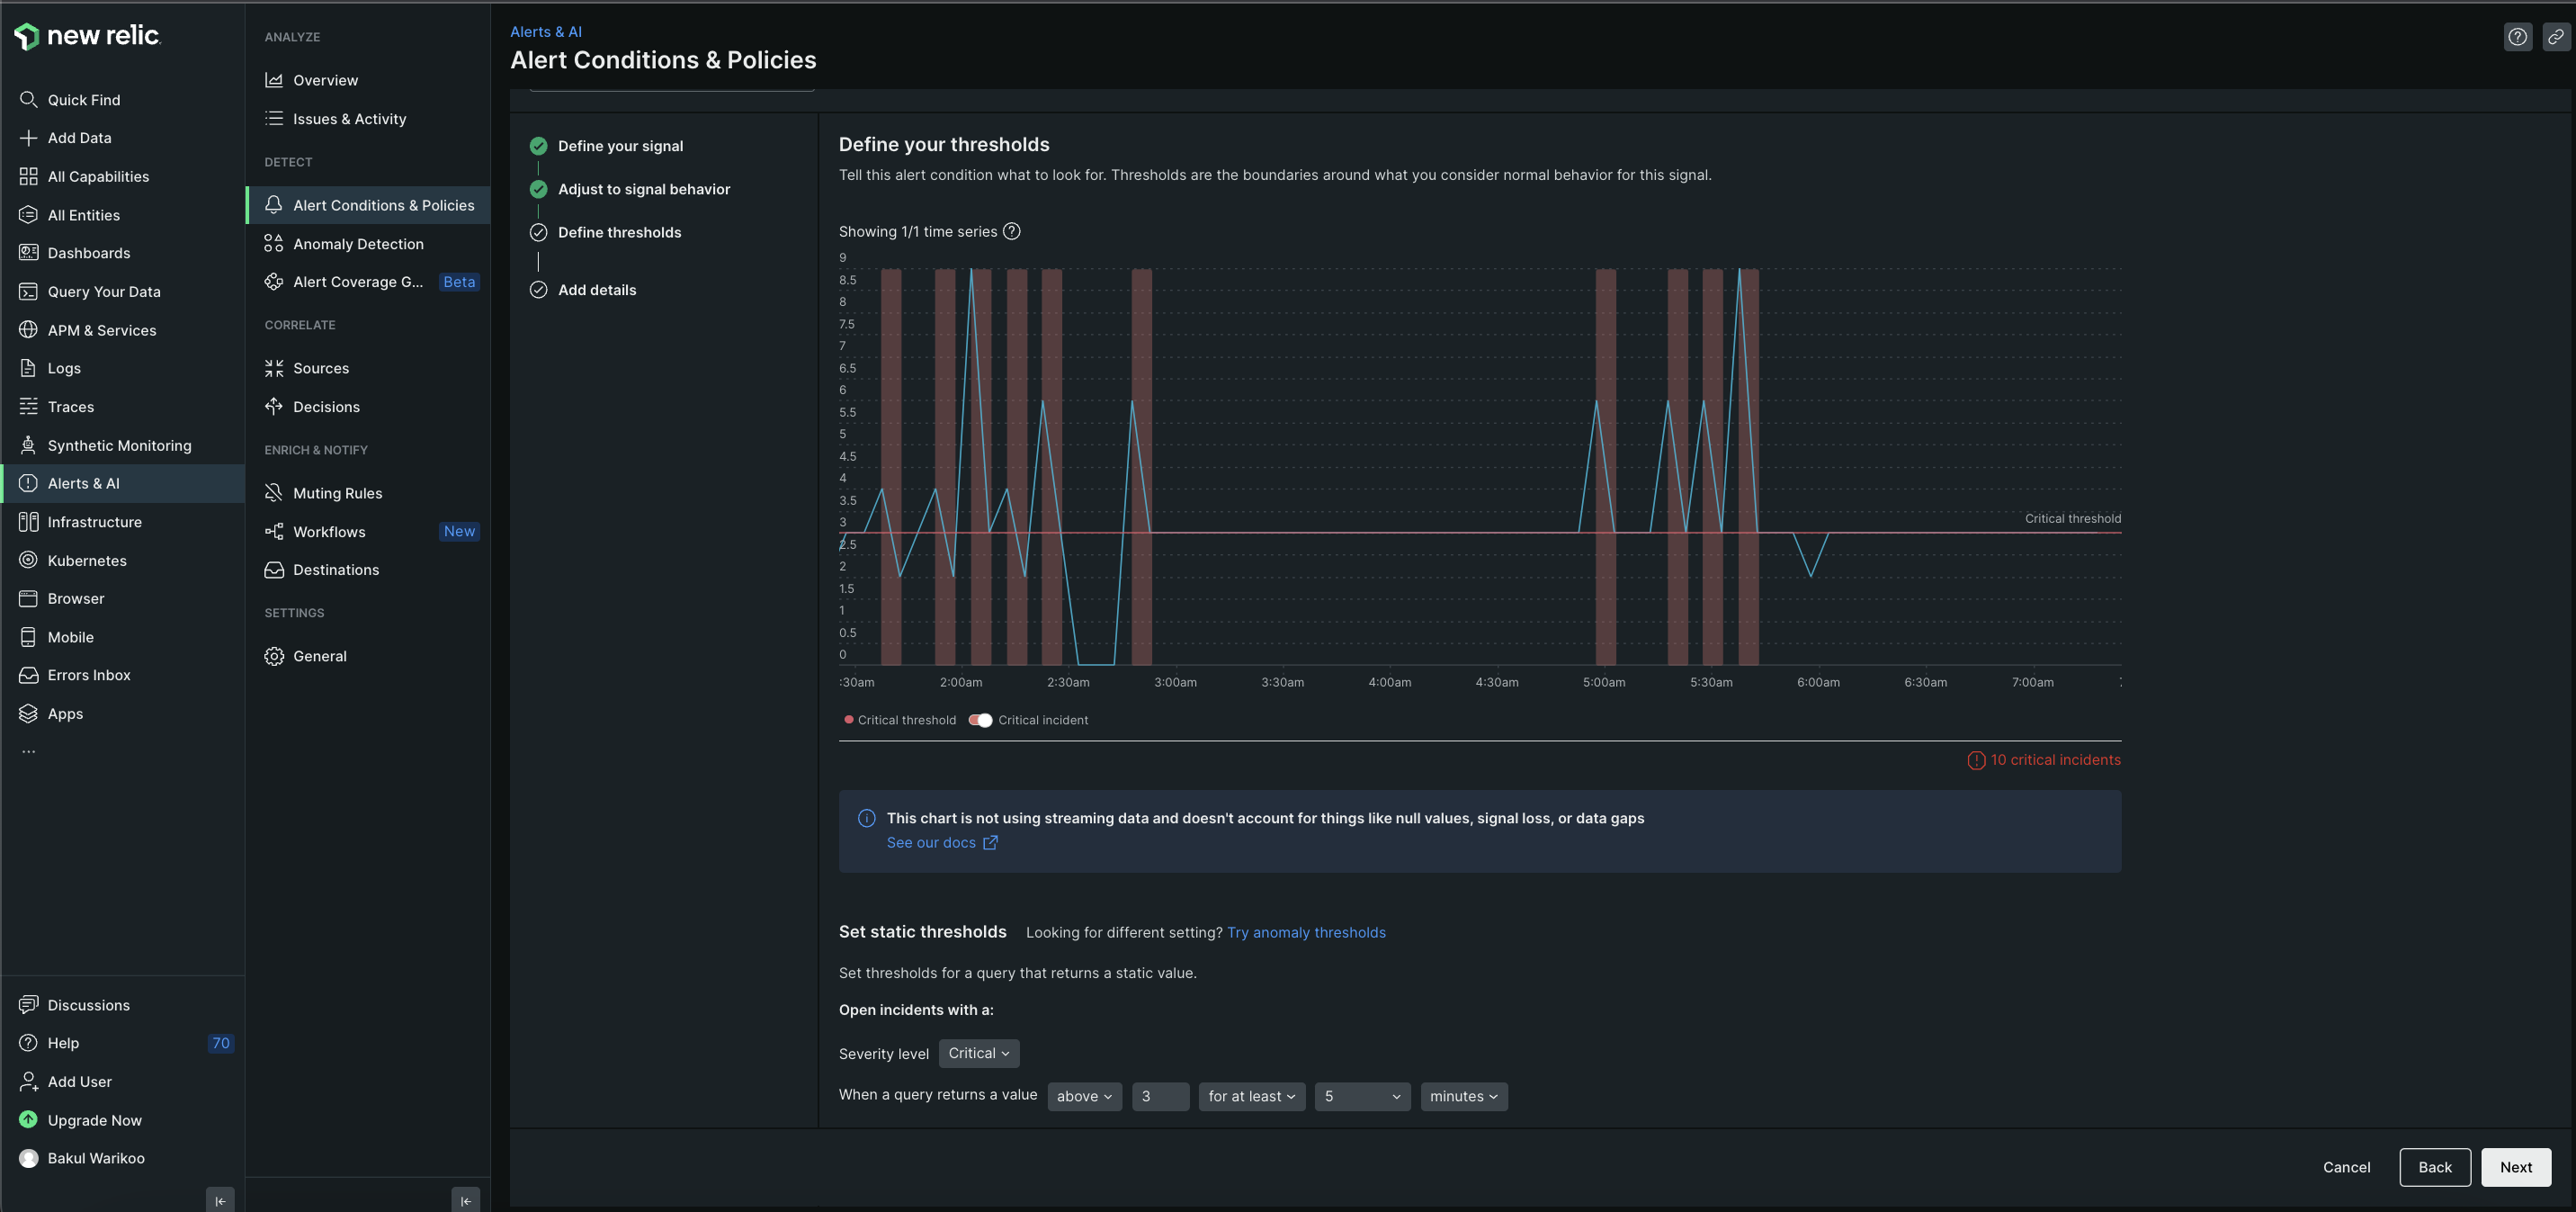
On the next screen, you need to Define the threshold i.e., tell this alert condition what to look for. Thresholds are the boundaries around what you consider normal behavior for this signal. Since I have kept 3 locations while creating the monitor, I will define it in a way that if there are more than 3 failures, open incident and send notification. Click on next.
In the next screen, specify the name for the alert, policy and select enable on save. Click on save & set up notification.

Select the type of notification you want - email/slack etc.. I am selecting Email notification.

And, with this you are done! The alert will check the results of the monitor and in cases where it reaches the threshold, the alert will send notification via email. Email notification looks like:
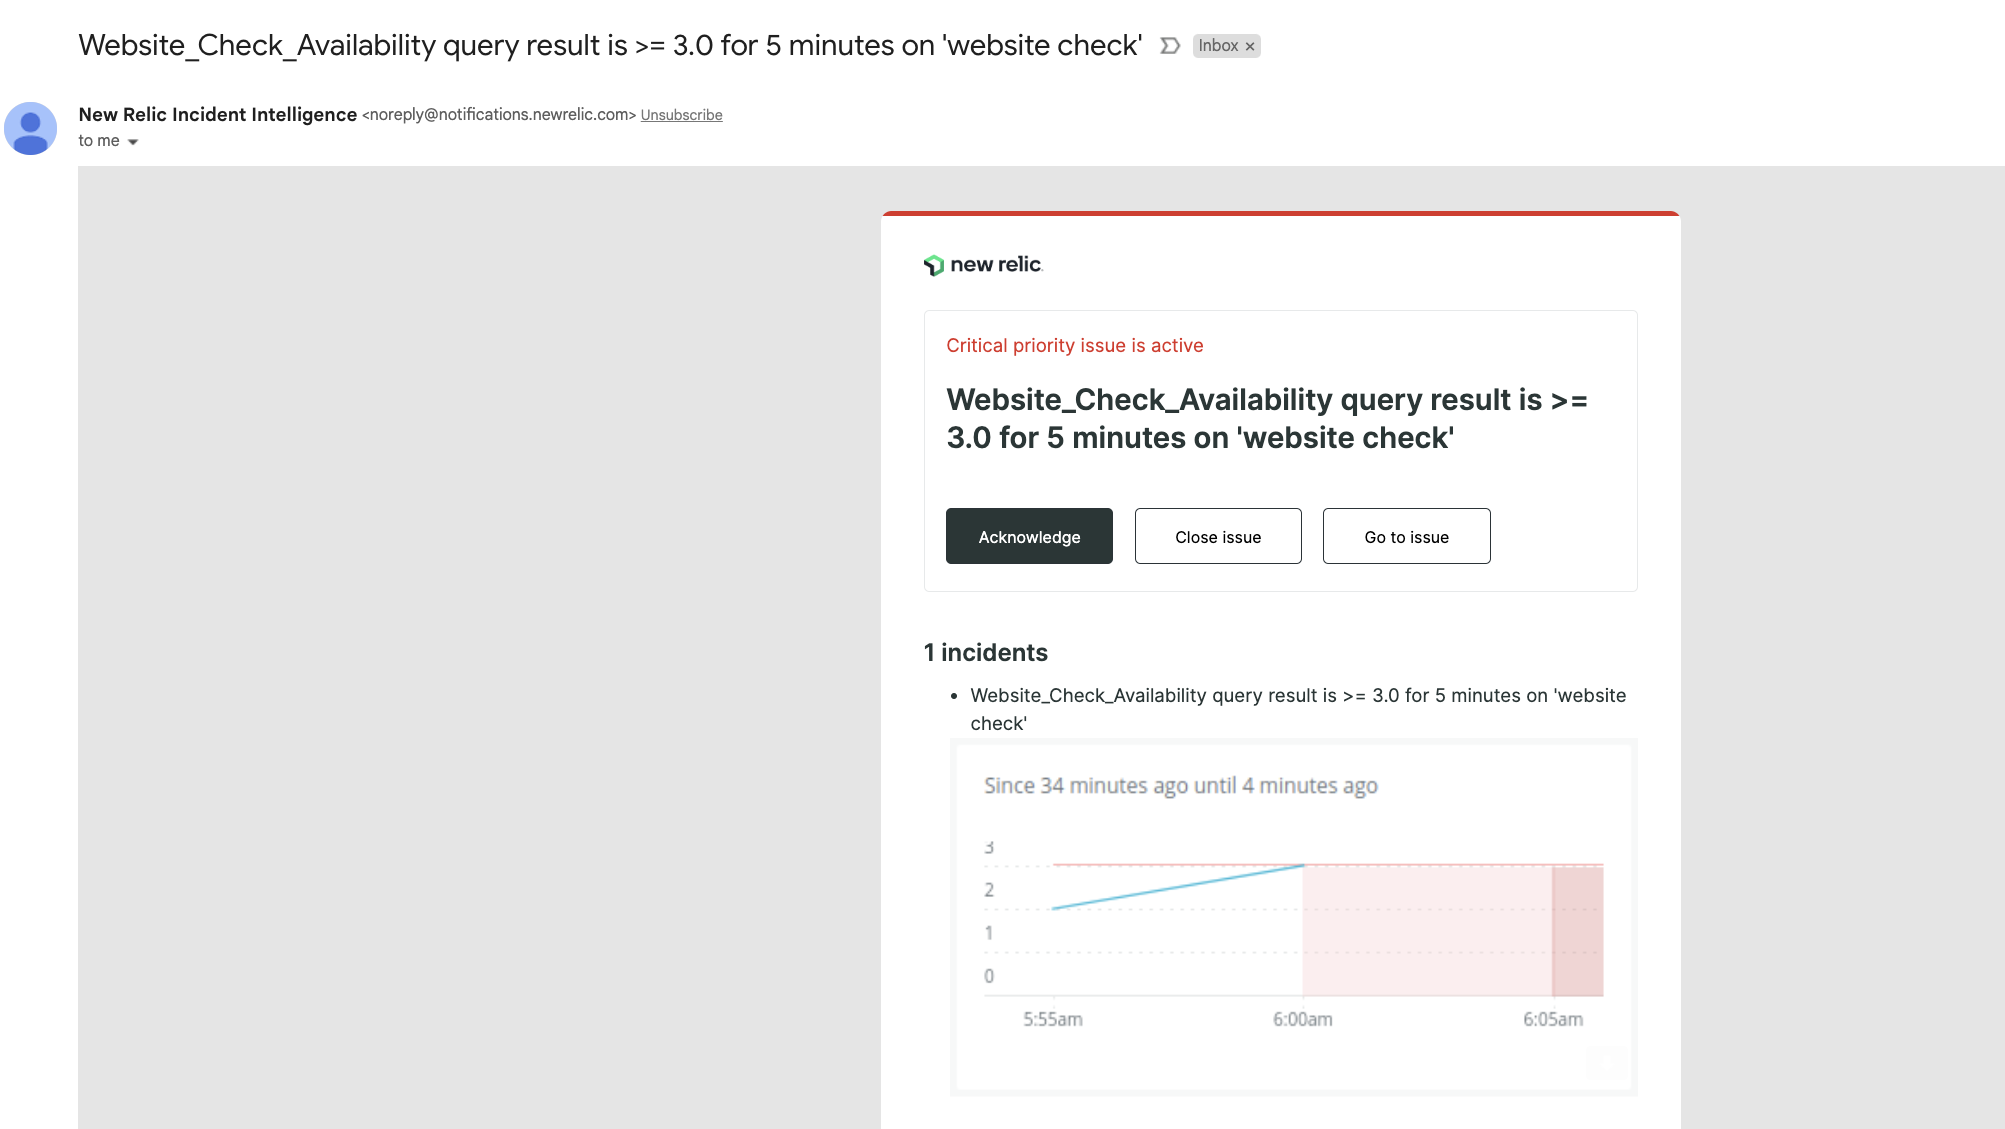
The New Relic dashboard will show the incidents that have been created and closed after fixing.

Conclusion
Today, we covered what monitoring is and why we need it in the digital world. We also explored New Relic tool and did hands-on on one of the scenarios. There is much more to it - you can find resources on internet to go through them. In case you want me to cover more, do let me know!
Once you are clear with the concept and need for monitoring, there are additional tools that companies use for monitoring, observability, and analysis, such as Grafana. Be sure to explore these options too.
Your feedback is highly valuable, so please do share your thoughts and ideas with me. Happy Learning!
Subscribe to my newsletter
Read articles from Bakul Warikoo directly inside your inbox. Subscribe to the newsletter, and don't miss out.
Written by

Bakul Warikoo
Bakul Warikoo
Women in Tech | DevOps Engineer | AWS Certified Cloud Practitioner | Promote the idea of Lifelong Learning