Comprehensive Guide to Monitoring Infrastructure, Database(s), Django App metrics with Grafana and Prometheus
 Jayanth Kumar
Table of contents
- Introduction
- Understanding Grafana and Prometheus
- What is Prometheus?
- Requirements, Assumptions, and Limitations
- Installing Grafana and Prometheus on an EC2 Instance
- Monitoring Infrastructure Metrics
- Setting Up a Grafana Dashboard to Visualize Infrastructure Metrics from Prometheus
- Monitoring RDS Databases
- Monitoring Django Application
- Log Monitoring with Loki
- Conclusion

Introduction
In today's fast-paced digital landscape, where applications and infrastructure form the backbone of businesses and services, maintaining their health and performance is of paramount importance. The ability to identify and address issues promptly can make the difference between smooth operations and costly downtime. This is where monitoring comes into play – a practice that involves continuous tracking, measurement, and analysis of various aspects of your systems.
The Importance of Monitoring: Ensuring System Resilience
Monitoring serves as a proactive safeguard, allowing organizations to detect anomalies, bottlenecks, and potential failures before they impact user experience or disrupt services. By collecting and analyzing data about key performance indicators (KPIs), resource utilization, and other metrics, monitoring provides insights that help optimize system performance, plan for capacity expansion, and ensure that user expectations are met.
Introducing Grafana and Prometheus
In the realm of monitoring and observability, Grafana and Prometheus stand out as robust and versatile tools that empower organizations to gain deep insights into their systems. Both Grafana and Prometheus are open-source solutions that complement each other, providing a comprehensive monitoring ecosystem.
Grafana, a powerful visualization and analytics platform, enables users to create interactive and customizable dashboards. It allows for real-time data visualization, supporting a wide array of data sources and offering a rich library of panels and plugins. Grafana's intuitive interface makes it easy to visualize trends, patterns, and anomalies, aiding in quick decision-making.
Prometheus, on the other hand, is an open-source monitoring system built for time-series data. It excels at collecting and storing metrics, making them queryable and facilitating the creation of alerts based on defined rules. Prometheus is designed to handle dynamic, high-dimensional data while being highly efficient and scalable.
Key Objectives of the Article
This comprehensive guide aims to equip you with the knowledge and skills required to harness the power of Grafana and Prometheus for monitoring and visualizing various aspects of your applications and infrastructure. By the end of this guide, you will be able to:
Understand the foundational concepts and significance of monitoring for maintaining the health and performance of your systems.
Navigate the functionalities and capabilities of Grafana and Prometheus, appreciating how they synergize to provide a holistic monitoring solution.
Learn how to set up and configure Grafana and Prometheus on an Amazon EC2 instance, preparing your environment for effective monitoring.
Gain insights into the process of monitoring infrastructure metrics, including CPU, RAM, and disk usage of your EC2 instances.
Explore strategies for monitoring Amazon RDS databases, ensuring the optimal functioning of your data storage.
Dive into the specifics of monitoring a Django application, including tracking average response times for HTTP requests.
Extend your monitoring scope to cover resource utilization patterns of Airbyte using Prometheus.
Uncover the capabilities of Loki, and learn how to integrate it into your Django and FastAPI applications for efficient log monitoring.
With this comprehensive guide, you'll be equipped to establish a robust monitoring environment using Grafana and Prometheus, enabling you to make informed decisions, troubleshoot effectively, and ultimately enhance the performance and reliability of your applications and infrastructure.
Understanding Grafana and Prometheus
What is Grafana?
Grafana stands as a premier open-source platform designed to cater to the complex needs of monitoring and observability in modern software systems. With its user-friendly interface and extensive capabilities, Grafana has established itself as a critical tool for organizations seeking to gain insights into the performance, health, and behaviour of their applications and infrastructure.
At its core, Grafana excels in transforming raw data into meaningful visualizations, enabling users to grasp complex trends, anomalies, and patterns quickly. Whether you are overseeing a small web application or managing a sprawling microservices architecture, Grafana's versatility empowers you to make informed decisions and ensure seamless operations.
Key Features of Grafana:
Flexible Data Visualization: Grafana provides a rich variety of visualization options, including graphs, charts, tables, and heatmaps. These visualizations help you transform raw metrics and data into intuitive representations that are easy to interpret.
Real-time Monitoring: Real-time monitoring is one of Grafana's hallmarks. It allows you to view live data streams, monitor events as they happen, and respond promptly to any issues or anomalies.
Alerting and Notifications: Grafana allows you to set up custom alerts based on specified thresholds, enabling proactive responses to critical events. You can configure various alerting channels such as email, Slack, or other collaboration tools.
Extensibility and Integration: Grafana's ecosystem is bolstered by its extensibility, enabling integration with a wide range of data sources and services. It supports various data storage solutions, including Prometheus, InfluxDB, Elasticsearch, and more.
Dashboard Templating: Dashboards in Grafana can be customized and templated, making it easier to manage and visualize different environments or instances.
User Access and Permissions: Grafana offers robust user authentication and access control mechanisms. You can define granular permissions for different users and teams, ensuring data security and control.
Community and Plugins: The Grafana community is vibrant and active, contributing to the growth of numerous plugins and integrations. This enables users to extend the platform's capabilities beyond its core features.
What is Prometheus?
Prometheus is an open-source monitoring and alerting toolkit that has gained significant popularity in the DevOps and SRE (Site Reliability Engineering) communities. Developed by SoundCloud, Prometheus is designed to monitor and gather data from various sources within your infrastructure, providing insights into the health and performance of your systems. It excels in handling time-series data, making it ideal for tracking metrics that change over time.
Core Features of Prometheus:
Time-Series Data Collection: Prometheus collects time-series data by periodically polling configured targets using HTTP or other protocols. This data is stored in a highly efficient and compact format optimized for querying and analysis.
Querying and Visualization: Prometheus provides a flexible querying language called PromQL, which allows you to perform ad-hoc queries on the collected data. It also has a basic web-based interface for visualizing metrics.
Alerting Rules: Prometheus supports creating alerting rules that trigger notifications when certain conditions are met. These rules can be based on thresholds or complex expressions involving multiple metrics.
Exporters: Prometheus exporters are specialized components that expose various types of metrics from third-party systems, databases, or applications. These exporters make it possible to monitor a wide range of technologies using Prometheus.
Data Retention and Rollups: Prometheus stores data in a fixed-size local database. Older data is automatically removed to maintain a predefined retention period. It also supports data rollups to reduce storage requirements for longer retention periods.
Requirements, Assumptions, and Limitations
Requirements:
Hardware: Prometheus is lightweight and can run on modest hardware. A typical setup includes a single server or cluster of servers to manage data collection and querying.
Software: Prometheus can be run on various operating systems, including Linux, Windows, and macOS. It requires the installation of a compatible runtime environment like Go.
Network: Prometheus needs network connectivity to scrape metrics from targets. The network should have appropriate security measures in place to ensure data integrity.
Assumptions:
Metric Exposition: Prometheus assumes that metrics are exposed by applications or systems in a consistent format, typically using an HTTP endpoint.
Pull Model: Prometheus uses a pull-based model, where it scrapes metrics from targets at regular intervals. This assumes that the targets can handle the incoming requests and have the necessary endpoints configured.
Limitations:
Scalability: Prometheus operates well in small to medium-sized environments but might face challenges in extremely large deployments due to its architecture's limitations.
Long-Term Storage: While Prometheus provides efficient storage for short-term data, long-term data retention can become an issue due to storage constraints.
Global-View: By default, Prometheus does not offer a centralized global view across multiple instances. This can be addressed using additional tools or integrations.
Installing Grafana and Prometheus on an EC2 Instance
Setting Up an EC2 Instance
In this section, we will walk you through the process of creating an Amazon EC2 instance using the AWS Management Console. This instance will be the foundation for installing and configuring both Grafana and Prometheus.
Access the AWS Management Console
Log in to your AWS account.
Navigate to the AWS Management Console.
Launch an EC2 Instance
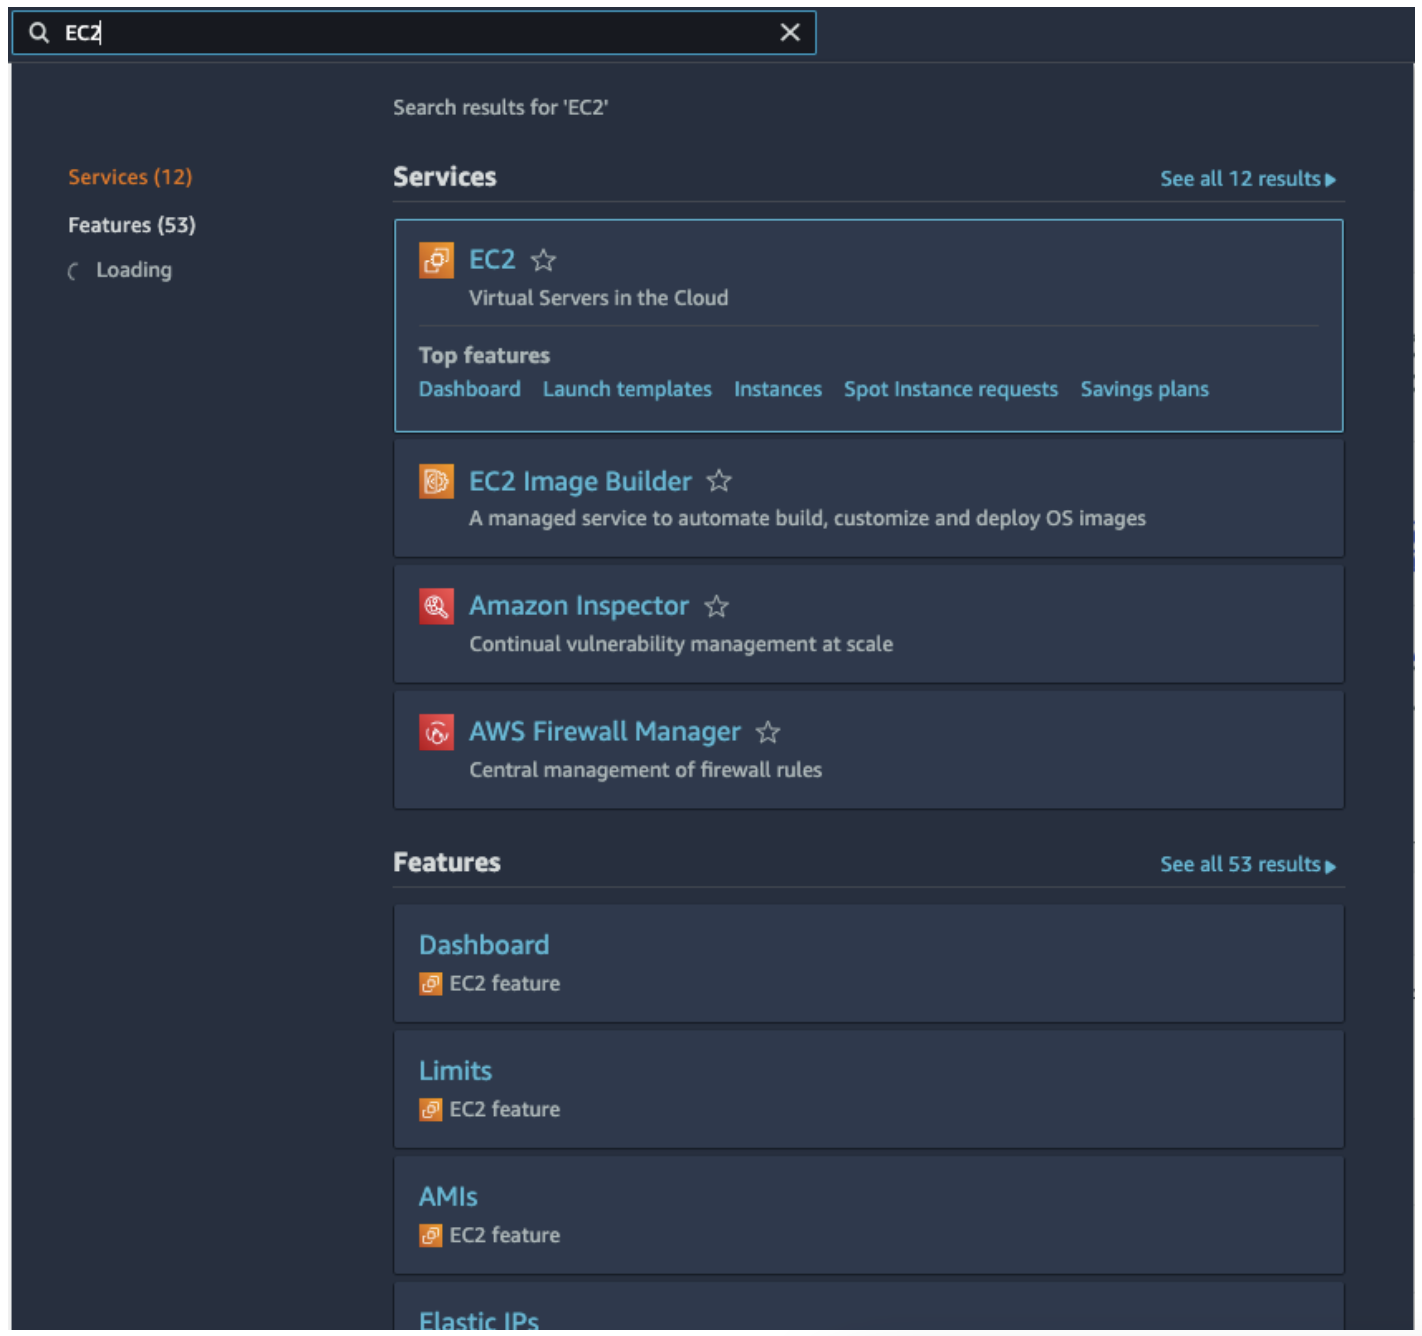
- From the AWS Management Console dashboard, locate and click on the "EC2" service.
Choose an Ubuntu 20 Instance
Click on the "Instances" section in the EC2 dashboard.
Click the "Launch Instance" button.
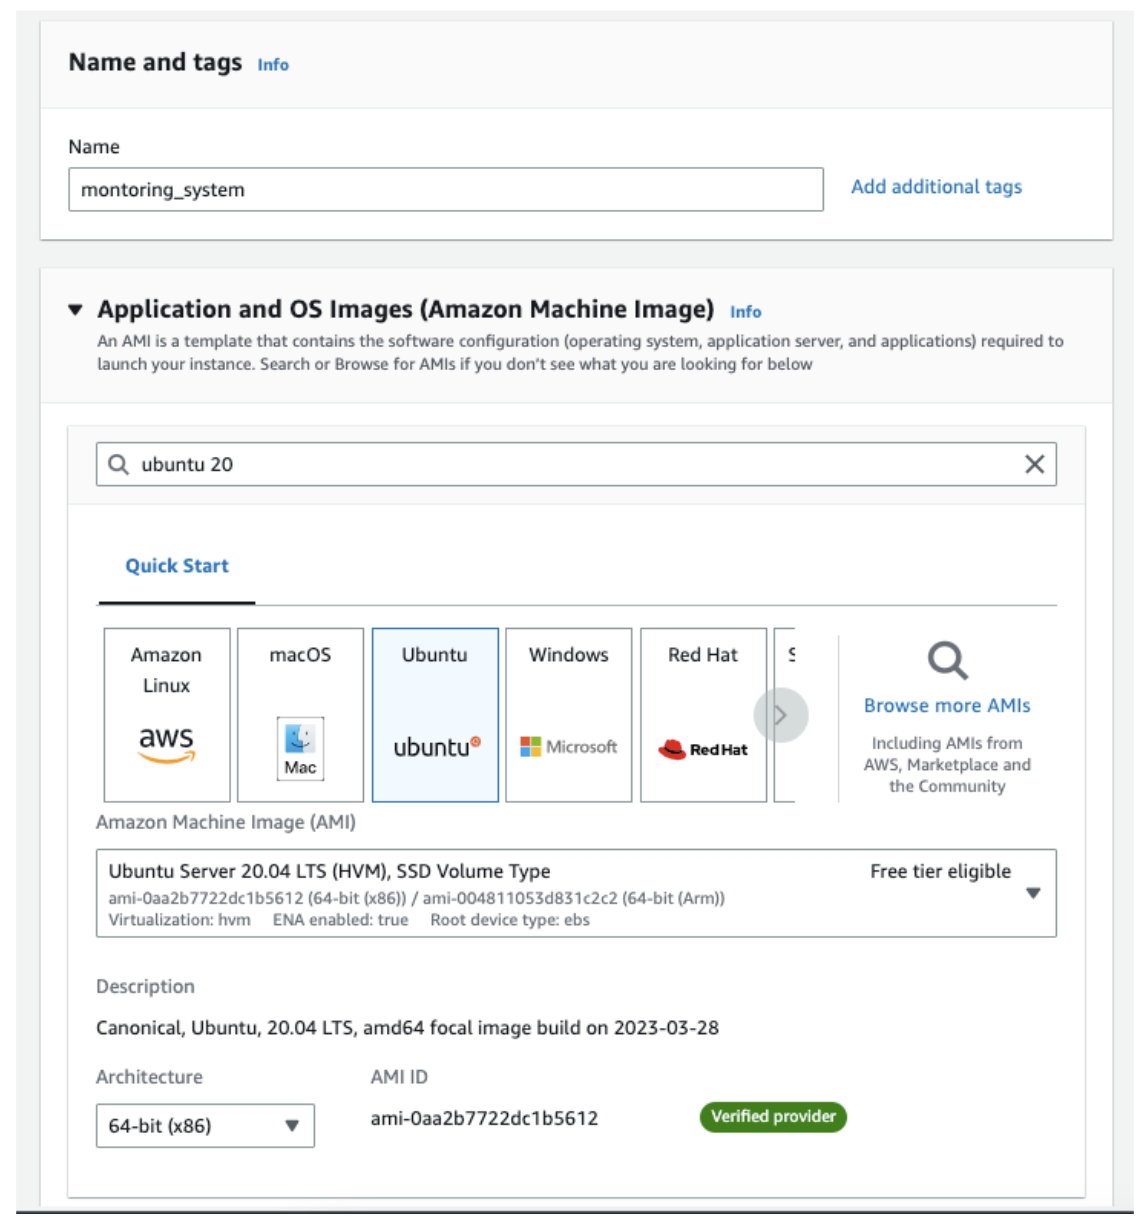
Choose an Ubuntu 20/22. For monitoring purposes, you can choose a standard Linux distribution like Amazon Linux 2.
Choose an Instance Type
Select the appropriate instance type based on the resources you require for Grafana and Prometheus. A good starting point might be a t2.micro or t3.micro instance.
Click "Next: Configure Instance Details."
Configure Instance Details
Configure the instance details, including the number of instances, VPC settings, subnet, etc.
Optionally, you can configure advanced options like instance monitoring, IAM roles, and user data scripts.
Click "Next: Add Storage."
Add Storage
Set the desired size for the root volume of the instance.
You can also add additional EBS volumes if you plan to store data separately.
Click "Next: Add Tags."
Add Tags
Optionally, add tags to your instance to help with organization and management.
Click "Next: Configure Security Group."
Configure Security Group
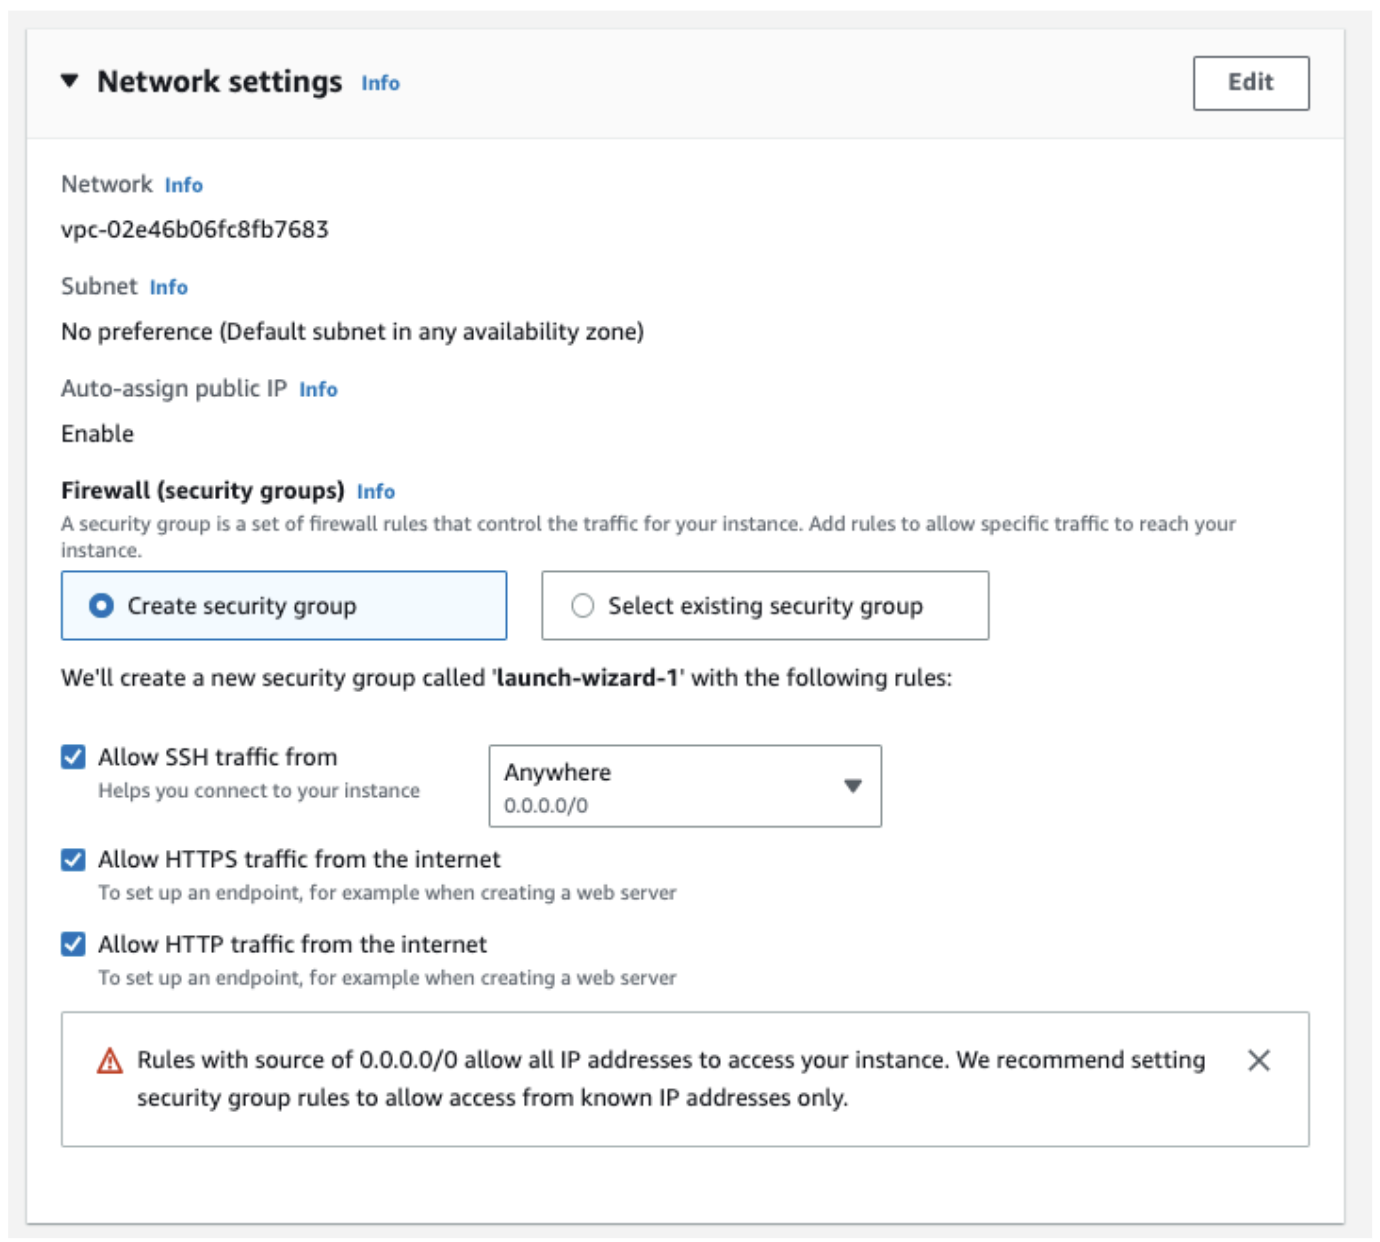
Create or select an existing security group for your instance.
Configure inbound rules to allow necessary traffic. For Grafana and Prometheus, you might need to allow HTTP (port 80), HTTPS (port 443), and Prometheus (port 9090) traffic, depending on your setup.
Click "Review and Launch."
Review and Launch
Review the configuration settings of your instance.
Click "Launch" to initiate the instance launch process.

Select an Existing Key Pair or Create a New Key Pair
Choose an existing key pair or create a new one to access your instance securely.
Click "Launch Instances."

Monitor the Launch Status
You will be taken to the Instances dashboard, where you can see the status of your instance launch.
Once the instance is running, note down the public IP address or DNS name, as you'll need it to access the instance.
Installing Grafana
Update System Packages
SSH into your EC2 instance and ensure your system packages are up-to-date
sudo apt update
sudo apt upgrade
Install Grafana
Install Dependencies
sudo apt install -y wget curl gnupg2 apt-transport-https software-properties-common

Add Grafana Key and Repo to the sources
wget-q -O - https://packages.grafana.com/gpg.key | sudo apt-key add -
sudo add-apt-repository "deb https://packages.grafana.com/oss/deb stable main" | sudo tee -a /etc/apt/sources.list.d/grafana.list


Update the system
sudo apt-get update -y

Install Grafana
sudo apt-get install grafana -y

Verify Grafana installation
grafana-server -v

Start and Enable Grafana
sudo systemctl start grafana-server
sudo systemctl enable grafana-server

Verify Grafana Service Service status

Disconnect and Connect with SSH with Port Forwarding
By default, Grafana listens on port 3000. Disconnect from the EC2 Instance and connect with port forwarding
ssh -L 3000:localhost:3000 ubuntu@<your_aws_ec2_instance_ip_adrr>
Access Grafana Web Interface
Open your browser and navigate to http://localhost:3000. You'll be prompted to set a new admin password.

Installing Prometheus
Create a new Linux user `prometheus`
To begin, establish a dedicated user for Prometheus and set up essential directories.
sudo useradd --no-create-home prometheus
sudo mkdir /etc/prometheus
sudo mkdir /var/lib/prometheus
Download and Extract Prometheus
Access your EC2 instance via SSH and download the latest Prometheus release.
wget  https://github.com/prometheus/prometheus/releases/download/v2.44.0/prometheus-2.44.0.linux-amd64.tar.gz
tar -xvf prometheus-2.44.0.linux-amd64.tar.gz
sudo cp prometheus-2.44.0.linux-amd64/prometheus /usr/local/bin
sudo cp prometheus-2.44.0.linux-amd64/promtool /usr/local/bin
sudo cp -r prometheus-2.44.0.linux-amd64/consoles /etc/prometheus/
sudo cp -r prometheus-2.44.0.linux-amd64/console_libraries /etc/prometheus
sudo cp prometheus-2.44.0.linux-amd64/promtool /usr/local/bin/
rm -rf prometheus-2.44.0.linux-amd64.tar.gz prometheus-2.19.0.linux-amd64
Configure Prometheus
Craft the prometheus.yml file in the /etc/prometheus/ directory to enable monitoring of Prometheus itself.
global:
  scrape_interval: 15s

scrape_configs:
  - job_name: 'prometheus'
    static_configs:
      - targets: ['localhost:9090']
Create Prometheus Service
Generate the prometheus.service file in /etc/systemd/system/ for managing Prometheus as a service.
[Unit]
Description=Prometheus
Wants=network-online.target
After=network-online.target

[Service]
User=prometheus
Group=prometheus
Type=simple
ExecStart=/usr/local/bin/prometheus \
    --config.file /etc/prometheus/prometheus.yml \
    --storage.tsdb.path /var/lib/prometheus/ \
    --web.console.templates=/etc/prometheus/consoles \
    --web.console.libraries=/etc/prometheus/console_libraries

[Install]
WantedBy=multi-user.target
Assign Permissions to the prometheus User
Allocate proper ownership permissions to the necessary directories and files.
sudo chown prometheus:prometheus /etc/prometheus
sudo chown prometheus:prometheus /usr/local/bin/prometheus
sudo chown prometheus:prometheus /usr/local/bin/promtool
sudo chown -R prometheus:prometheus /etc/prometheus/consoles
sudo chown -R prometheus:prometheus /etc/prometheus/console_libraries
sudo chown -R prometheus:prometheus /var/lib/prometheus
Start the Prometheus Service
Enable the Prometheus service to start on boot and initiate it.
sudo systemctl daemon-reload
sudo systemctl enable prometheus
sudo systemctl start prometheus
sudo systemctl status prometheus
Disconnect and Connect with SSH with Port Forwarding
Prometheus operates on port 9090 by default. Disconnect from the EC2 instance and reconnect with port forwarding to access the Prometheus web interface.
ssh -L 3000:localhost:3000 -L 9090:localhost:9090 ubuntu@<your_aws_ec2_instance_ip_adrr>
Access Prometheus Web Interface
Open your browser and navigate to http://localhost:9090 to access the Prometheus web interface.
Monitoring Infrastructure Metrics
Configuring Node Exporter
Explanation of Node Exporter
Node Exporter is a Prometheus exporter that collects a wide variety of system-level metrics from the target host's operating system and exposes them in a Prometheus-compatible format. These metrics include CPU usage, memory utilization, disk I/O, network statistics, and more. Node Exporter plays a crucial role in monitoring the health and performance of your EC2 instances and other infrastructure.
Setting up Node Exporter on Another EC2 Instance (Server-1)
Create a New EC2 Instance:
Start by creating a new Ubuntu 20 EC2 instance. Ensure that you add an inbound security rule to allow TCP connections on port 9100, which is the port used by Node Exporter.
Install Node Exporter:
Open a terminal on the newly created EC2 instance and execute the following commands:
# Create a user for Node Exporter
sudo useradd --no-create-home node_exporter

# Download and extract Node Exporter
wget https://github.com/prometheus/node_exporter/releases/download/v1.0.1/node_exporter-1.0.1.linux-amd64.tar.gz
tar xzf node_exporter-1.0.1.linux-amd64.tar.gz

# Move Node Exporter binary to the bin directory
sudo cp node_exporter-1.0.1.linux-amd64/node_exporter /usr/local/bin/node_exporter

# Clean up extracted files
rm -rf node_exporter-1.0.1.linux-amd64.tar.gz node_exporter-1.0.1.linux-amd64

# Copy the Node Exporter service file
sudo cp node-exporter.service /etc/systemd/system/node-exporter.service

# Reload systemd
sudo systemctl daemon-reload

# Enable and start the Node Exporter service
sudo systemctl enable node-exporter
sudo systemctl start node-exporter

# Check the status of Node Exporter
sudo systemctl status node-exporter
Access Raw Metrics:
Once Node Exporter is up and running, you can access the raw metrics it collects by visiting http://Server-1-PublicIP:9100/metrics in your web browser. This URL provides a comprehensive list of metrics retrieved by Node Exporter, giving you an overview of the system's performance.
Integrating Prometheus with Node Exporter
To monitor critical infrastructure metrics like CPU, RAM, and disk usage, Prometheus can be integrated with Node Exporter. Node Exporter is a Prometheus exporter that collects system-level metrics and exposes them for scraping.
Configure Prometheus to Scrape Node Exporter
Open the
prometheus.ymlfile in the/etc/prometheus/directory for editing.Add a new scrape configuration for Node Exporter:
 scrape_configs:
   - job_name: 'node'
     static_configs:
       - targets: ['<Server-1-PublicIP>:9100']
Replace <NODE_EXPORTER_IP> with the IP address of your EC2 instance where Node Exporter is running.
Save the configuration file and restart Prometheus to apply the changes.
systemctl restart prometheus
Verify Node Exporter Metrics
Open Prometheus' web interface by navigating to
http://localhost:9090in your web browser.In the query box, enter a metric name from Node Exporter, such as
node_cpu_seconds_totalornode_memory_MemTotal_bytes, and click "Execute."You should see a graph displaying the selected metric's data over time. This confirms that Prometheus is successfully scraping metrics from Node Exporter.
You can visualize the collected metrics directly in the Prometheus UI by using the "Graph" tab. Select the desired metric, configure the graph, and observe the metric trends over time.

Setting Up a Grafana Dashboard to Visualize Infrastructure Metrics from Prometheus
Once you have Prometheus collecting infrastructure metrics, the next step is to visualize this data using Grafana. Grafana provides a user-friendly interface to create dashboards that display the collected metrics in a meaningful way. Additionally, Grafana Labs offers a variety of open-source dashboards that you can import and customize to monitor your infrastructure effectively.
Prerequisites
Grafana and Prometheus should already be installed and configured as described in previous sections.
Prometheus should be scraping node-exporter metrics and storing them in its time-series database.
Access Grafana Web Interface
Open a web browser and enter the URL of your Grafana instance (usually http://localhost:3000 if you are port forwarding).
Log in using your Grafana credentials.
Add Prometheus Data Source
Once logged in, click on the gear icon (⚙️) on the left sidebar to access the Configuration menu.
Under Configuration, select "Data Sources."
Click on the "Add data source" button.
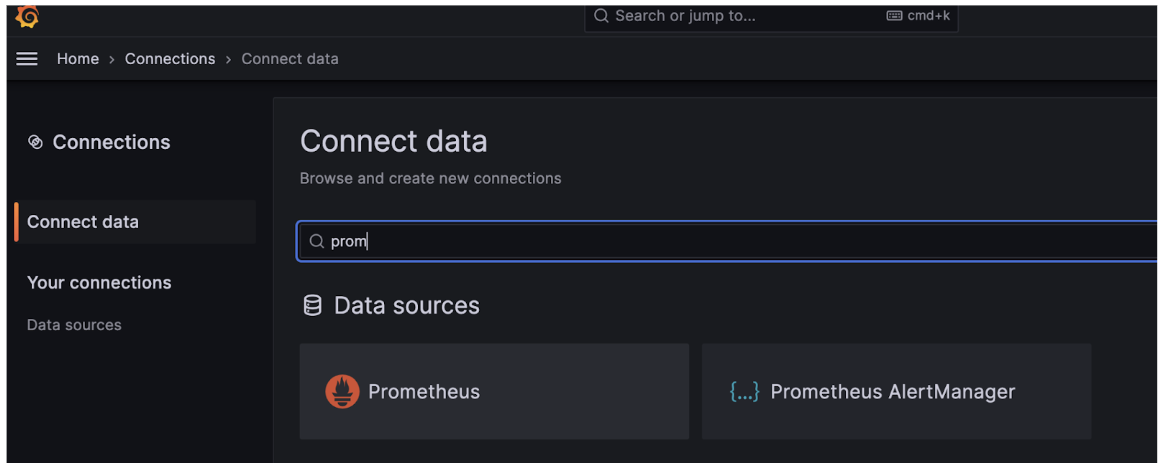
Choose "Prometheus" from the list of available data sources.
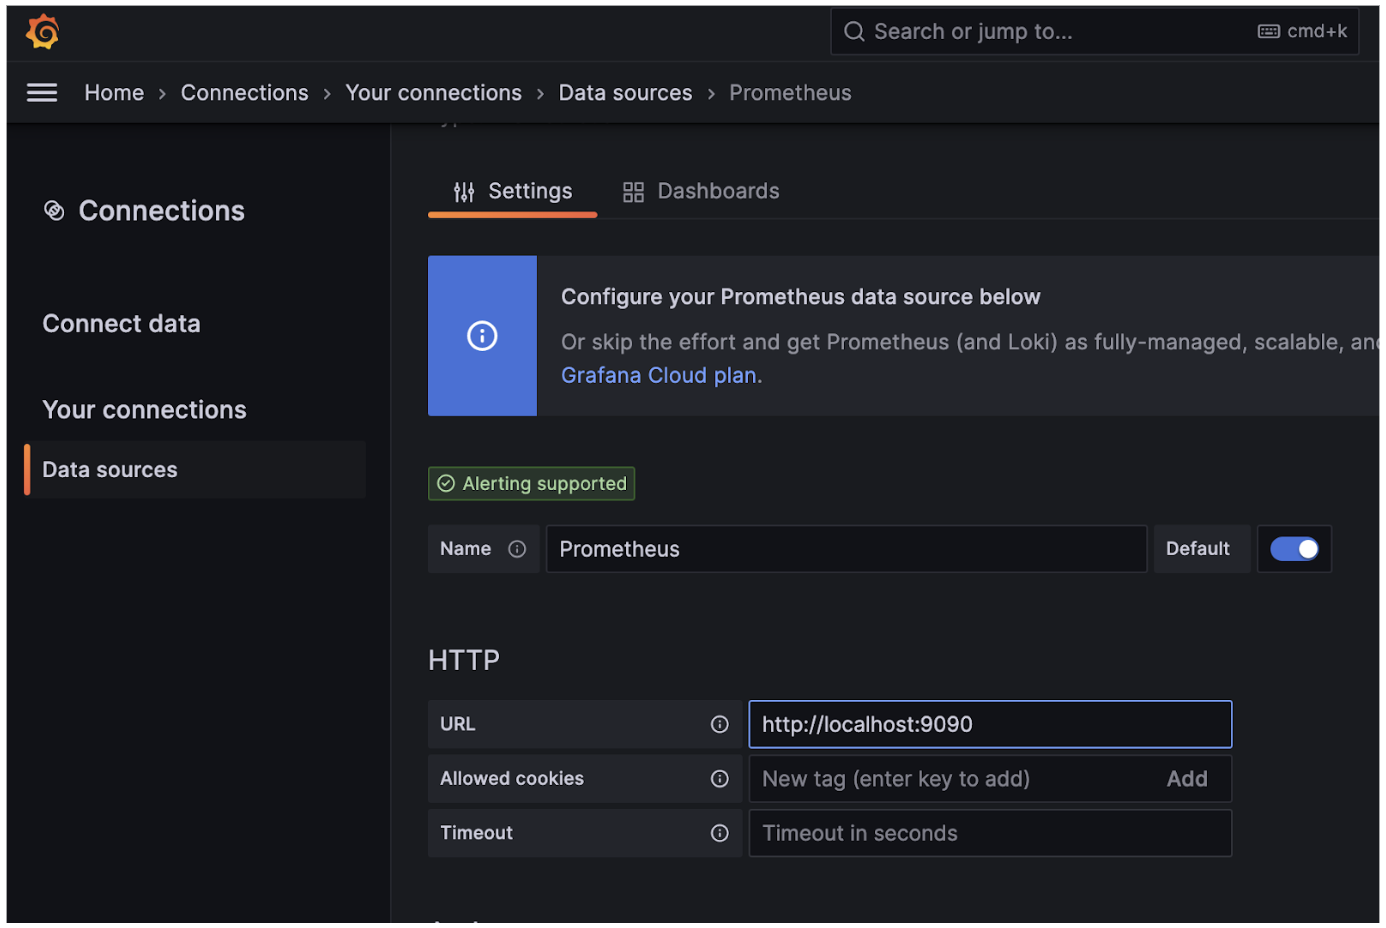
Configure the Prometheus data source:
Name: Give it a descriptive name (e.g., "Prometheus").
HTTP: Enter the URL of your Prometheus instance (usually http://localhost:9090).
Access: Choose "Server" (this lets Grafana's backend retrieve data directly from Prometheus).
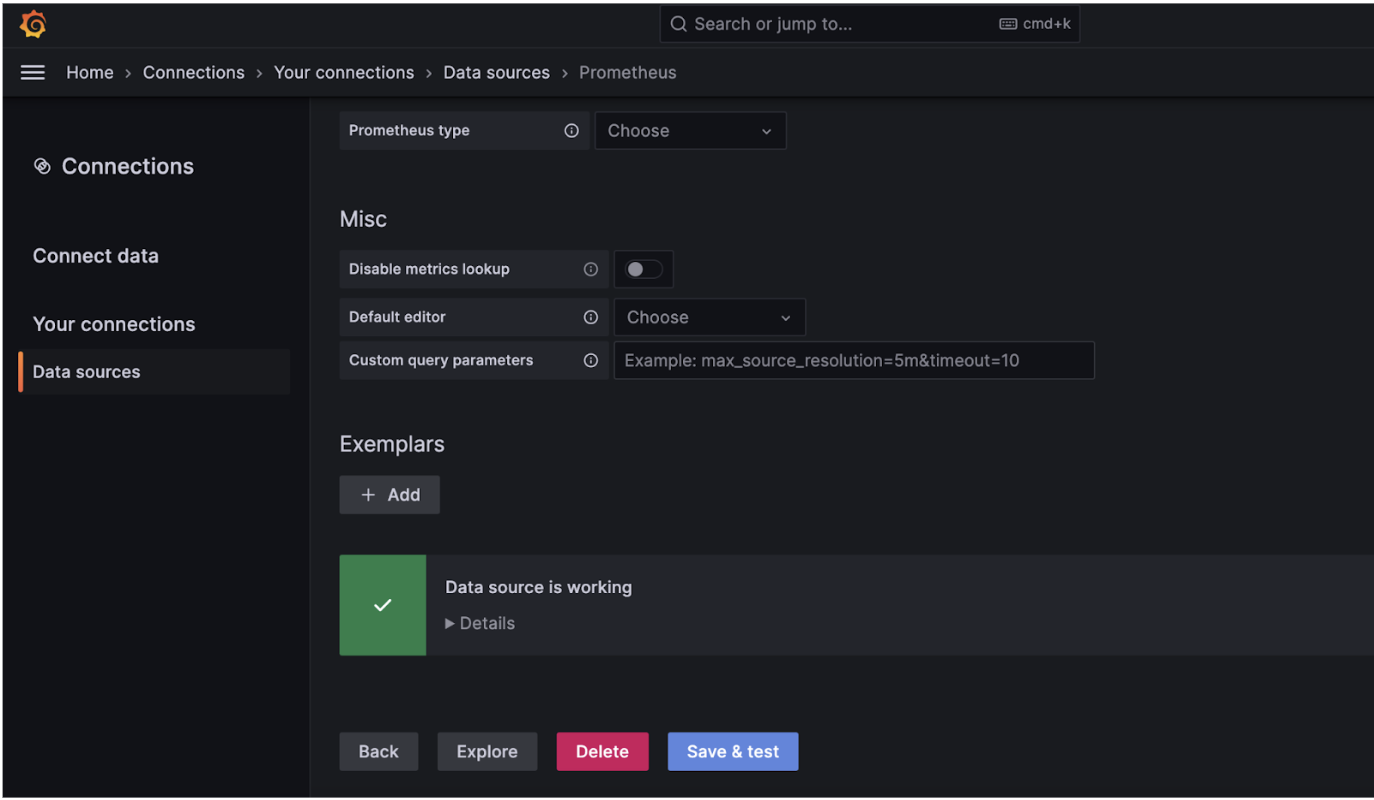
Click on the "Save & Test" button to ensure the connection to Prometheus is working.

Importing Grafana Labs Dashboards
In the Grafana dashboard, click on the plus icon (+) on the left sidebar to create a new dashboard.
Choose "Import" to import a pre-existing dashboard.
Grafana Labs offers a collection of dashboards for various use cases. You can visit Grafana Labs' Dashboard Library to search for dashboards related to infrastructure monitoring. To visualise all metrics being exported from Node Exporter, you can consider using this excellent node-exporter-full-dashboard.
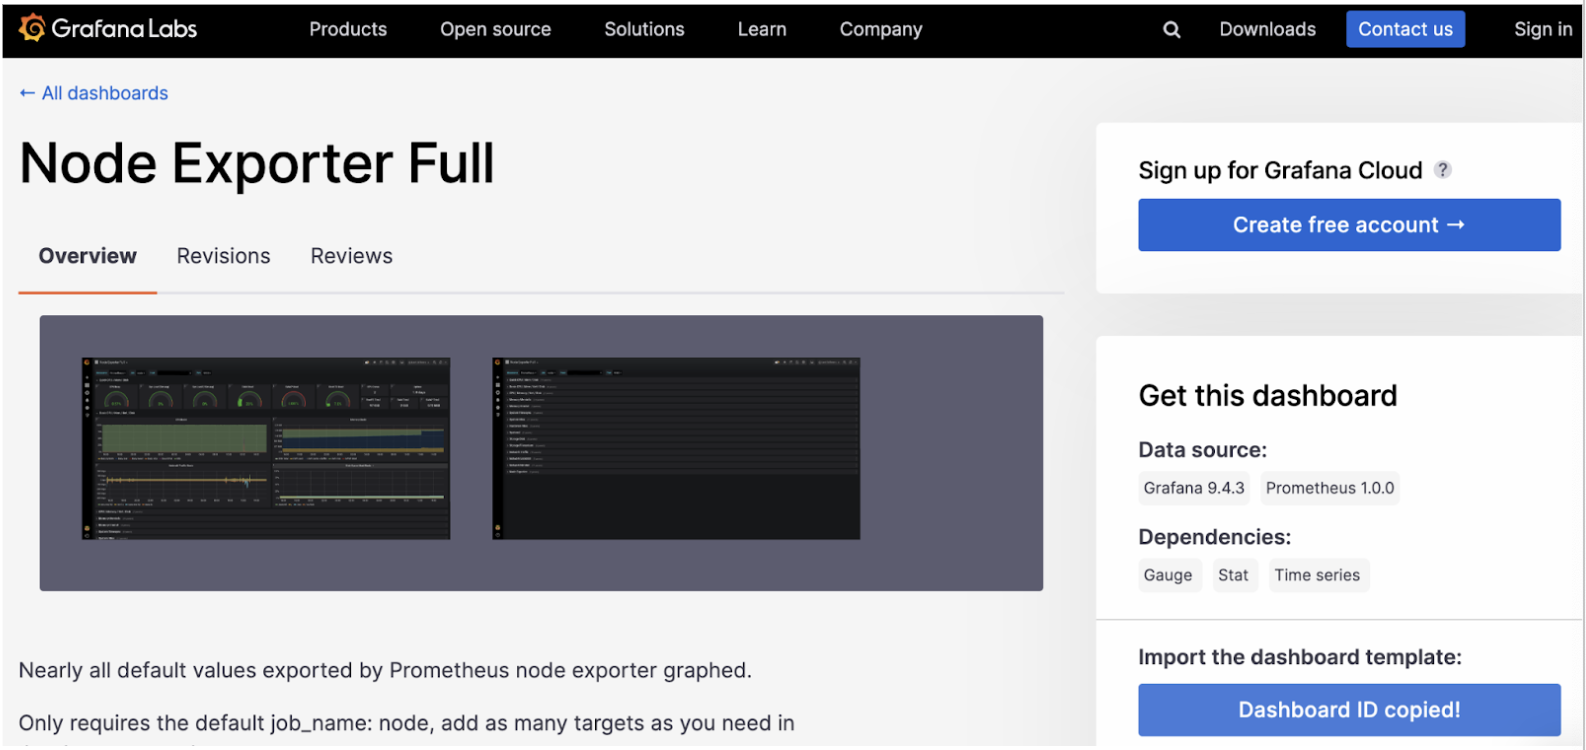
Once you find a suitable dashboard, note its ID and return to the Grafana dashboard import page.

Enter the dashboard ID and click "Load" to preview the dashboard.
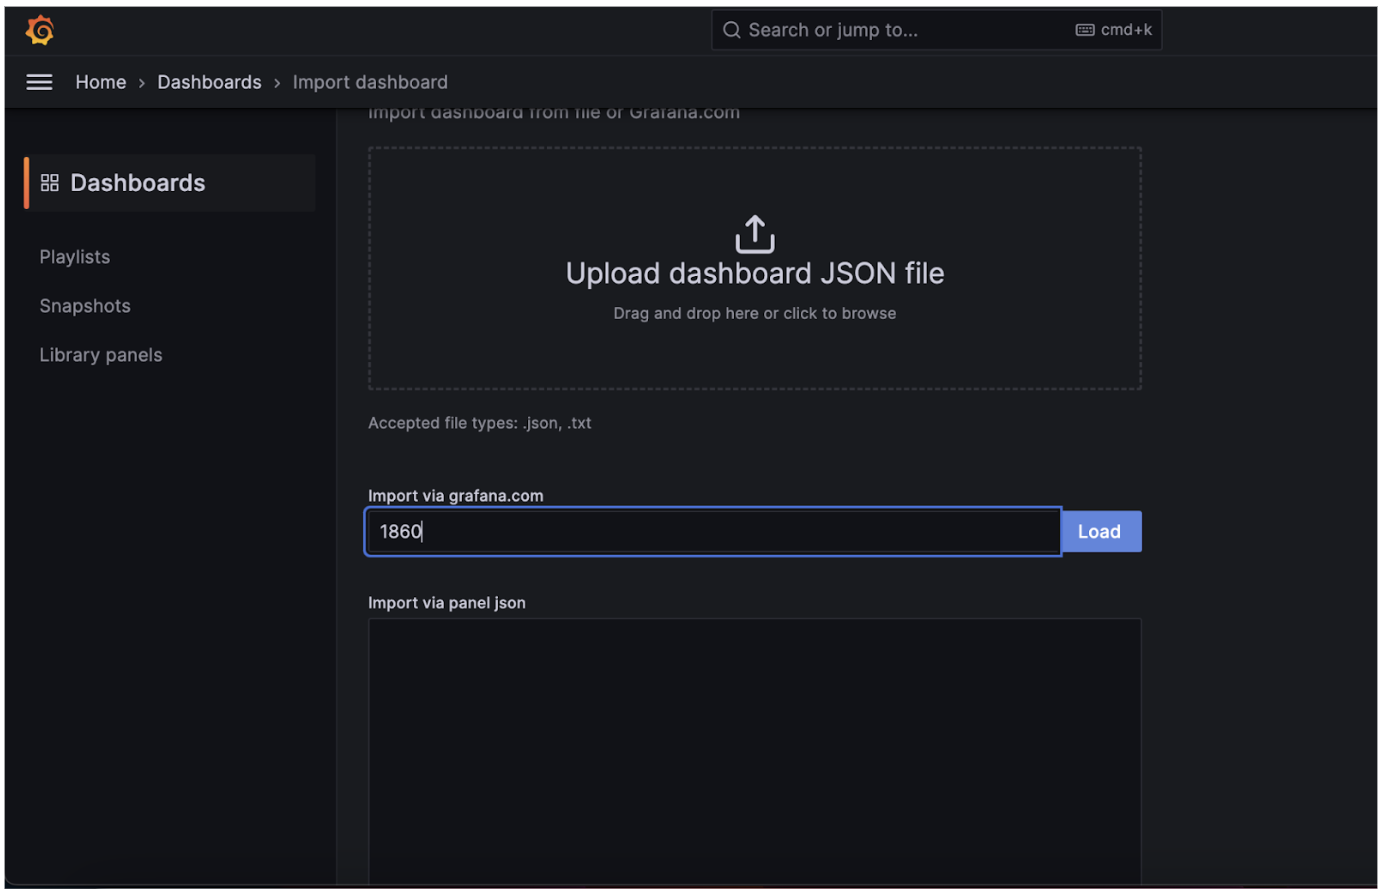
Customize the settings as needed, including the data source (select the Prometheus data source you added earlier).
Click "Import" to add the dashboard to your Grafana instance.
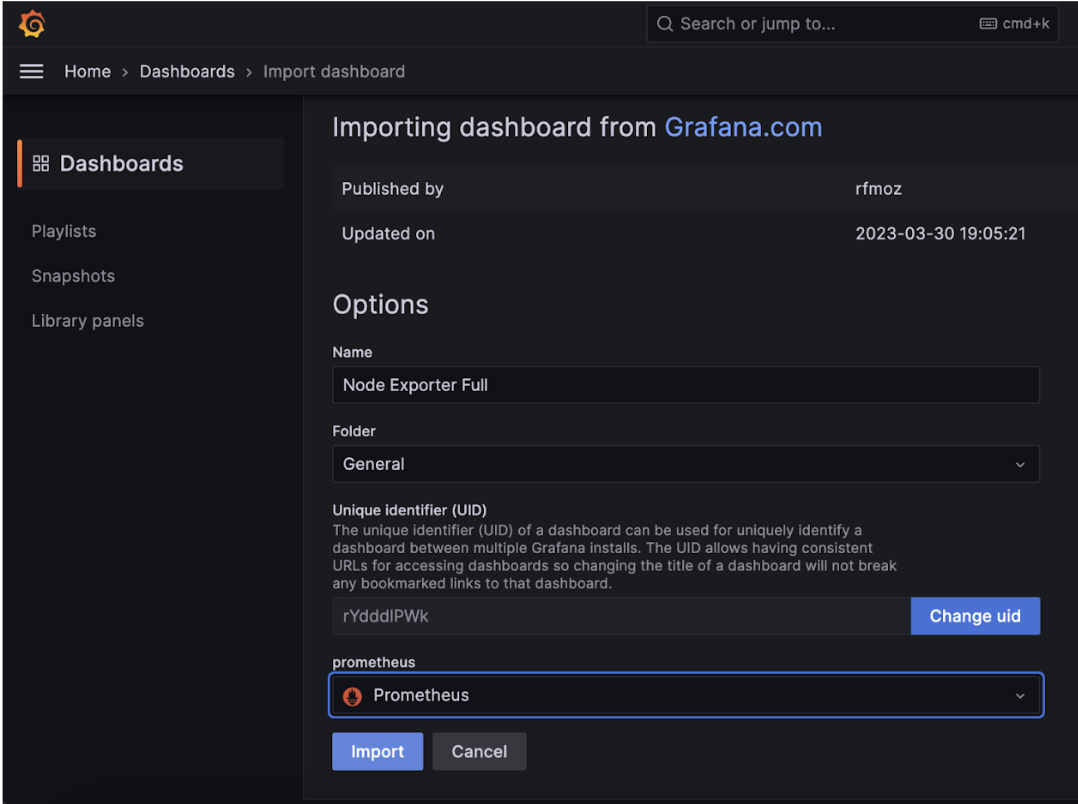
Dashboard Preview
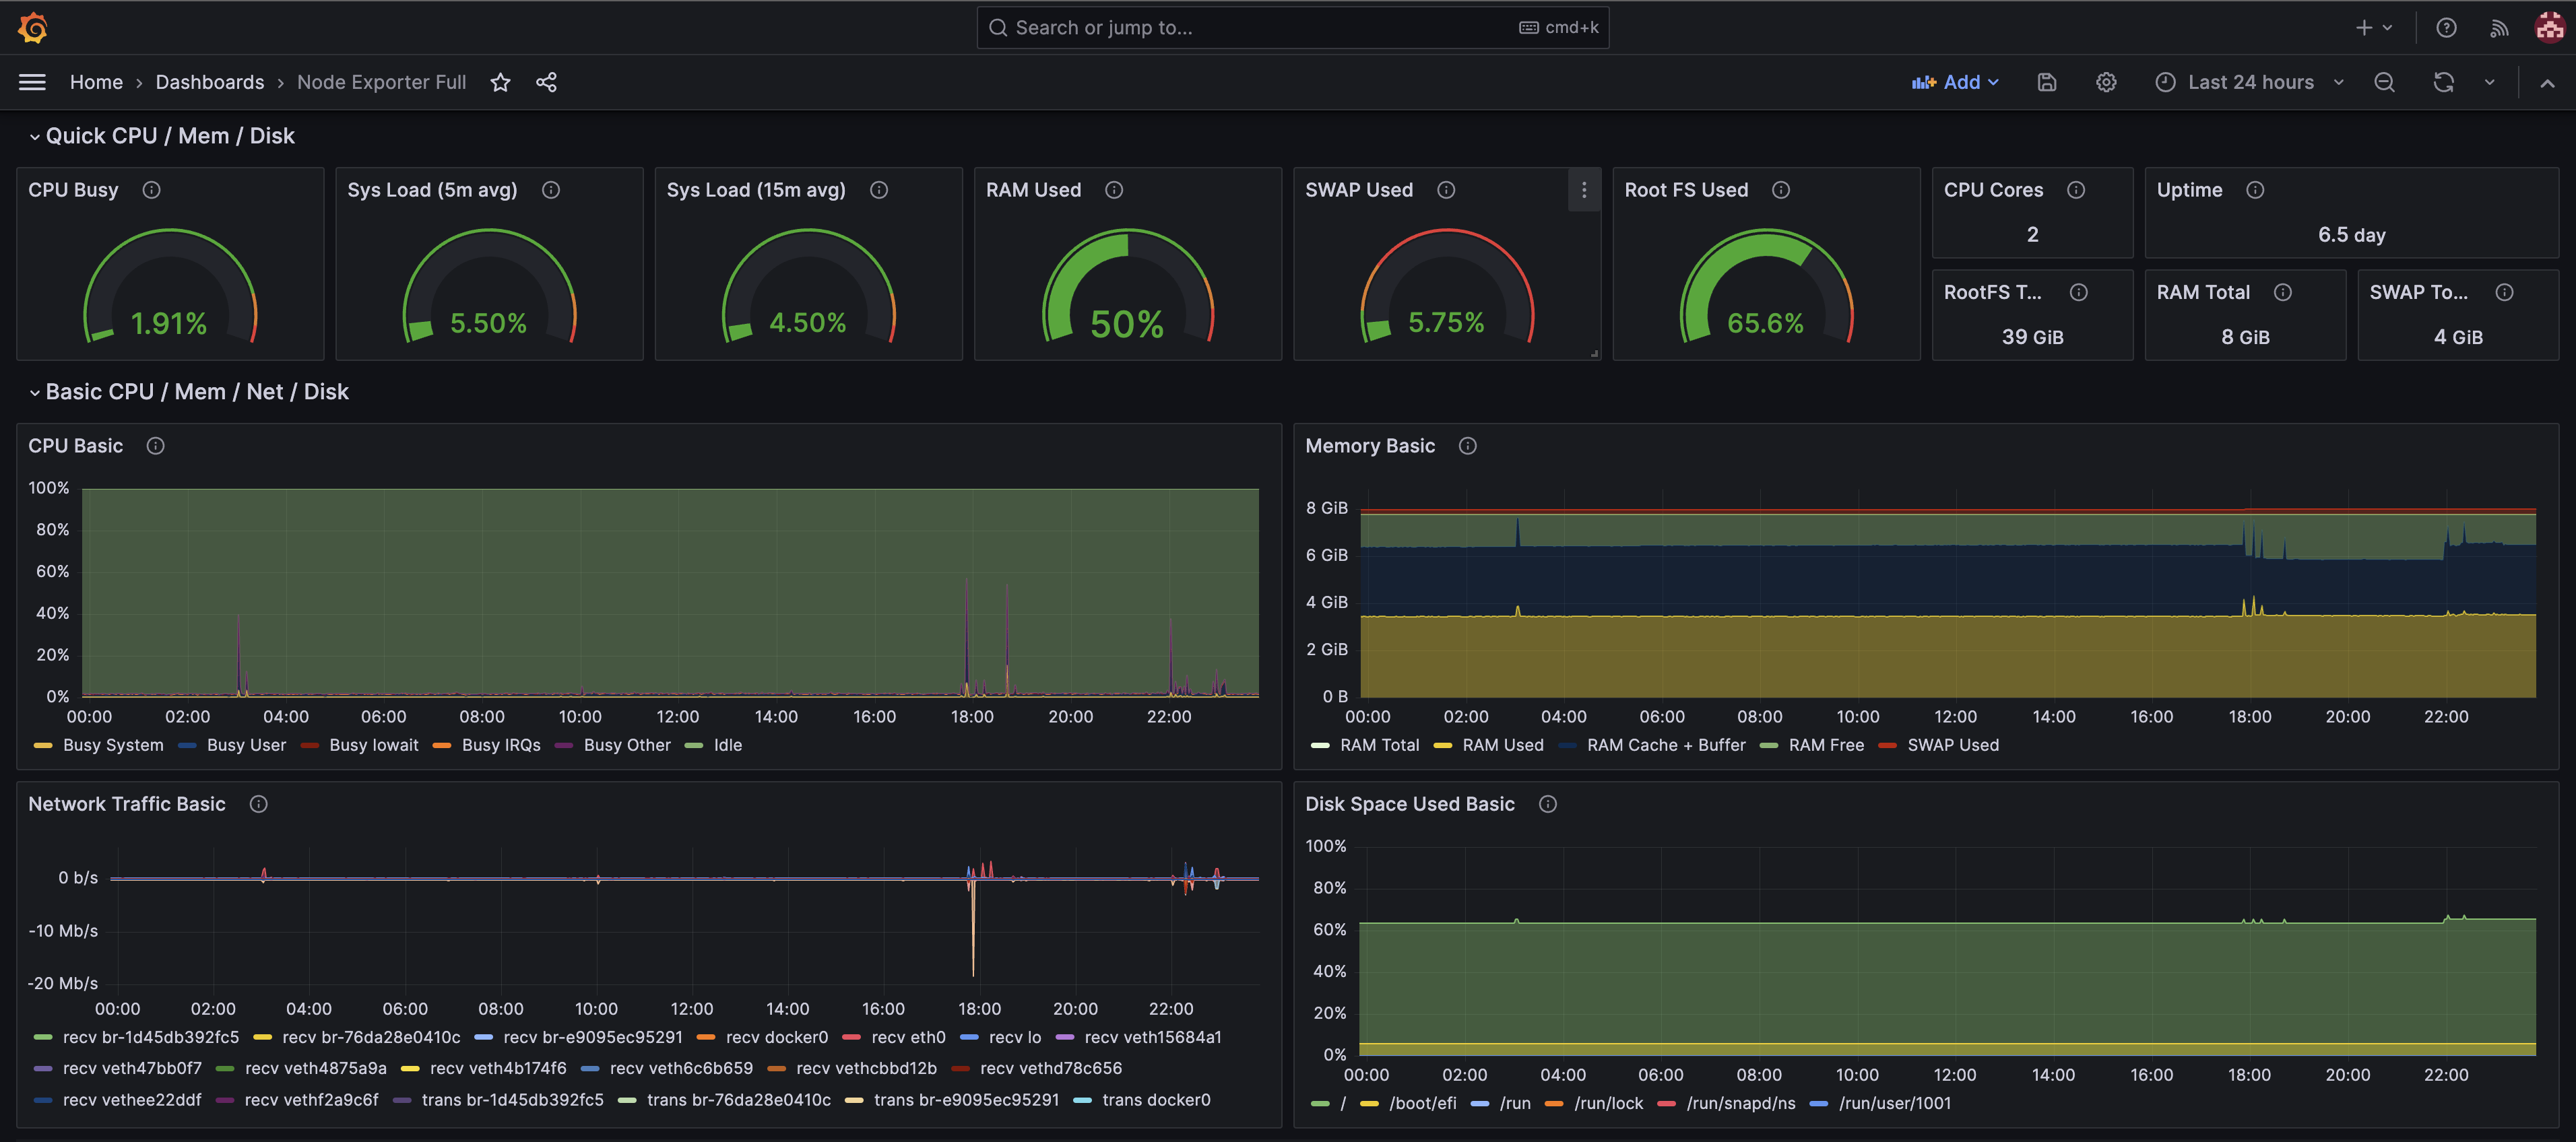
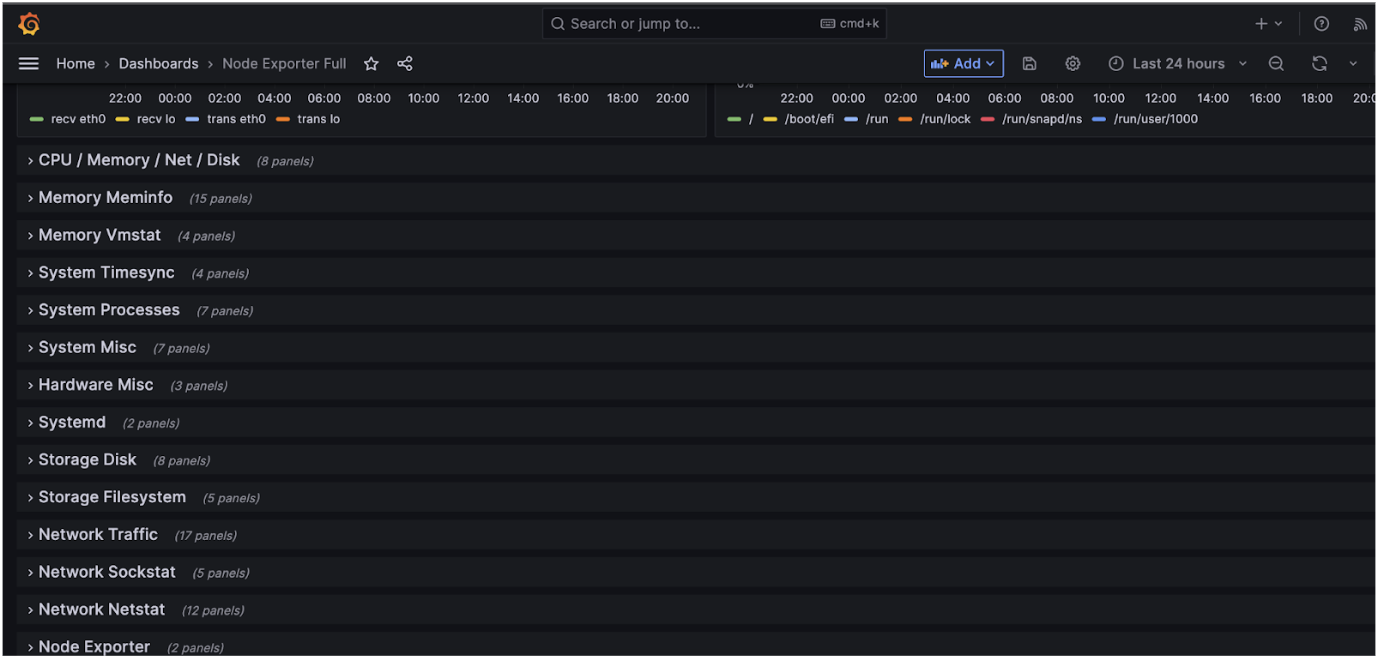
Customizing the Dashboard
After importing the dashboard, you can customize it to display the metrics specific to your infrastructure.
Modify panels: Click on individual panels to edit their settings. You can adjust the queries, time ranges, and visualization options.
Add panels: If the imported dashboard doesn't cover all the metrics you need, you can add new panels. Choose the type of visualization (graph, gauge, table, etc.) and configure the queries accordingly.
Organize the layout: Use the drag-and-drop interface to arrange panels and make the dashboard visually appealing.
Setting Up Alerts
Alerts in Grafana allow you to receive notifications when specific conditions are met.
For each panel, you can define alert rules based on thresholds or conditions. Configure alerting channels such as email, Slack, or other integrations.
Ensure you set up meaningful alerts to be notified promptly about any anomalies in your infrastructure metrics.
Monitoring RDS Databases
Prometheus Exporters for RDS
Monitoring Amazon RDS (Relational Database Service) databases is crucial for ensuring the performance, availability, and health of your database instances. Prometheus exporters tailored for RDS enable you to collect and visualize important database metrics, helping you make informed decisions and troubleshoot issues proactively.
Overview of Prometheus Exporters for RDS
Prometheus exporters are specialized components that collect and expose various metrics from different services and applications in a format that Prometheus can understand. For Amazon RDS, there are specific exporters designed to gather database metrics and make them available for Prometheus to scrape.
Prometheus RDS Exporter: The official Prometheus RDS Exporter is a tool that connects to your RDS instances and retrieves metrics related to database performance, connection statistics, disk usage, and more. It translates these metrics into Prometheus-compatible format so that you can monitor them using Grafana dashboards.
Percona Monitoring and Management (PMM): While not a direct Prometheus exporter, PMM is a comprehensive monitoring solution that includes Prometheus and Grafana, along with a variety of exporters. PMM provides specialized dashboards and queries for RDS databases, making it an excellent choice if you're looking for a more integrated solution.
Benefits of Using RDS Exporters
Granular Insights: RDS exporters allow you to access detailed metrics related to query performance, connections, storage, and more. This granularity is essential for identifying bottlenecks and optimizing database performance.
Custom Metrics: Exporters can be configured to gather custom metrics specific to your application's requirements. This enables you to monitor application-specific aspects of your database.
Alerting and Visualization: By integrating RDS exporters with Prometheus and Grafana, you can set up alerts based on thresholds and visualize the collected metrics using interactive dashboards.
Proactive Issue Detection: With real-time metrics at your disposal, you can identify performance degradation or anomalies early, allowing you to take action before they impact your application's performance.
Setting Up an Amazon RDS PostgreSQL Database
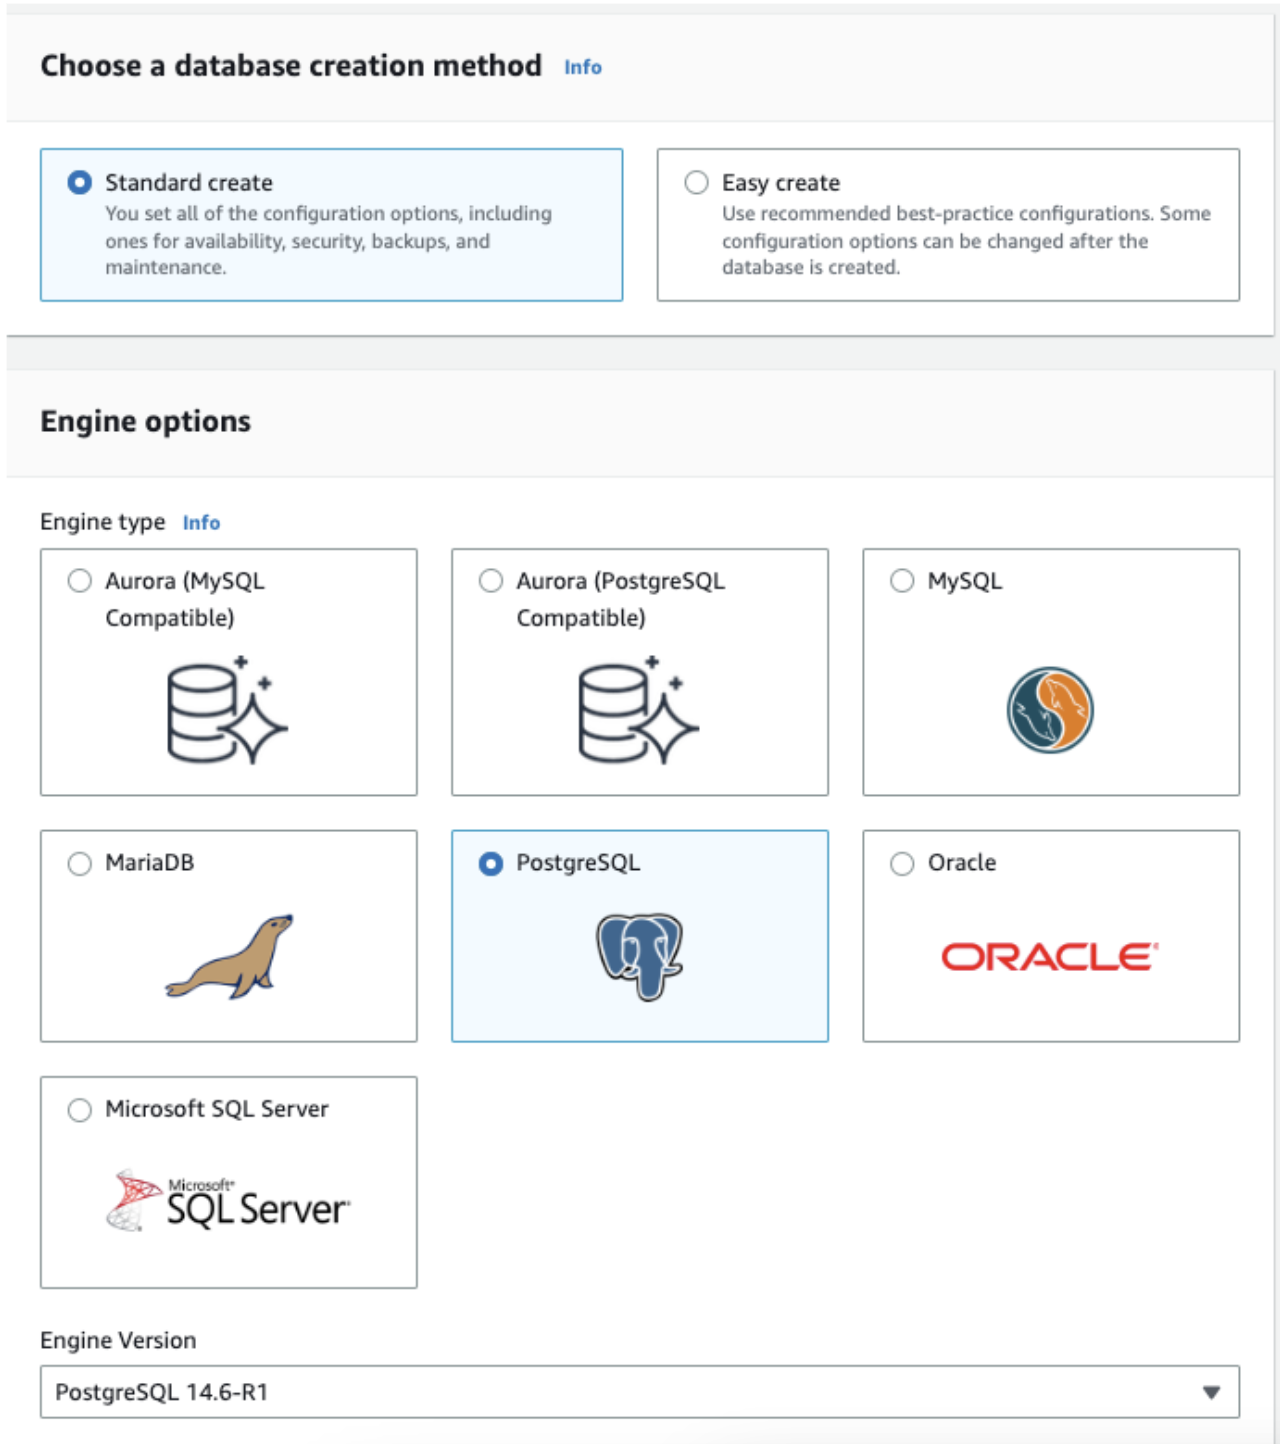
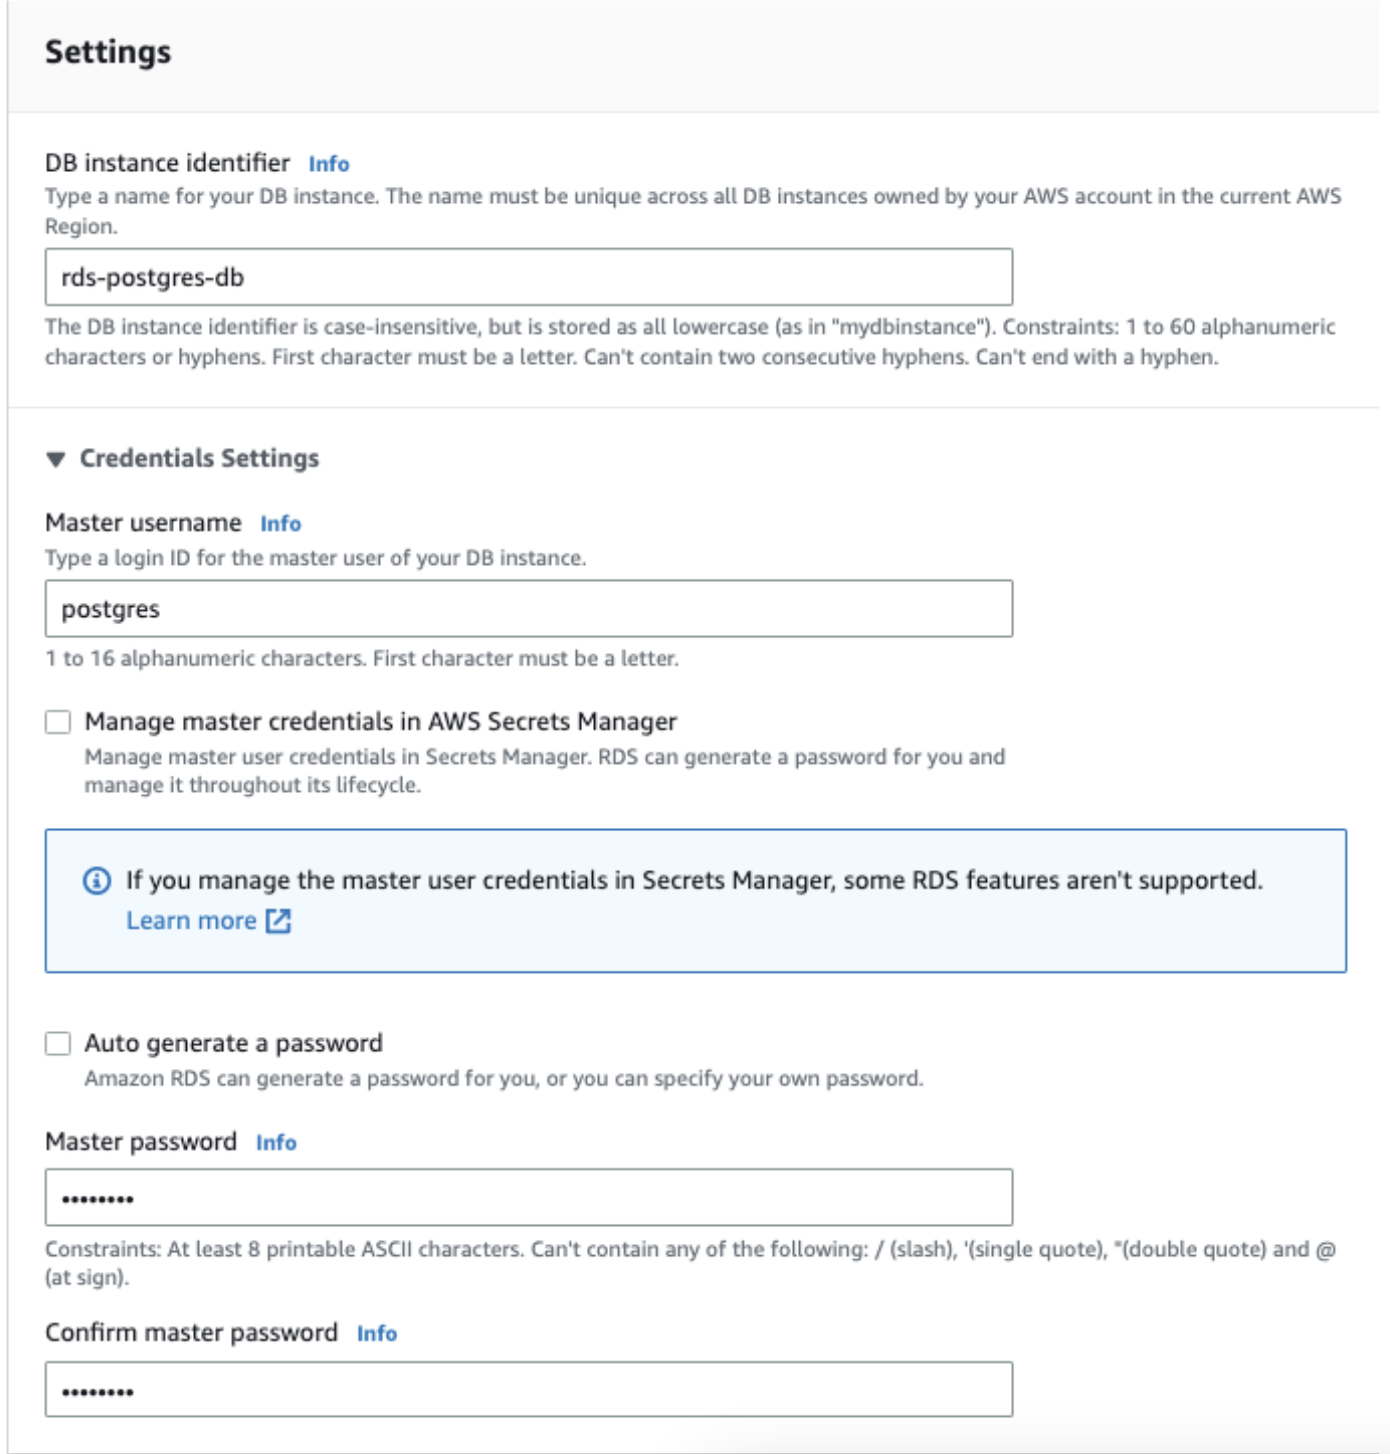
Create an Amazon RDS PostgreSQL Instance:
Log in to your AWS Management Console.
Navigate to Amazon RDS and choose "Create database."
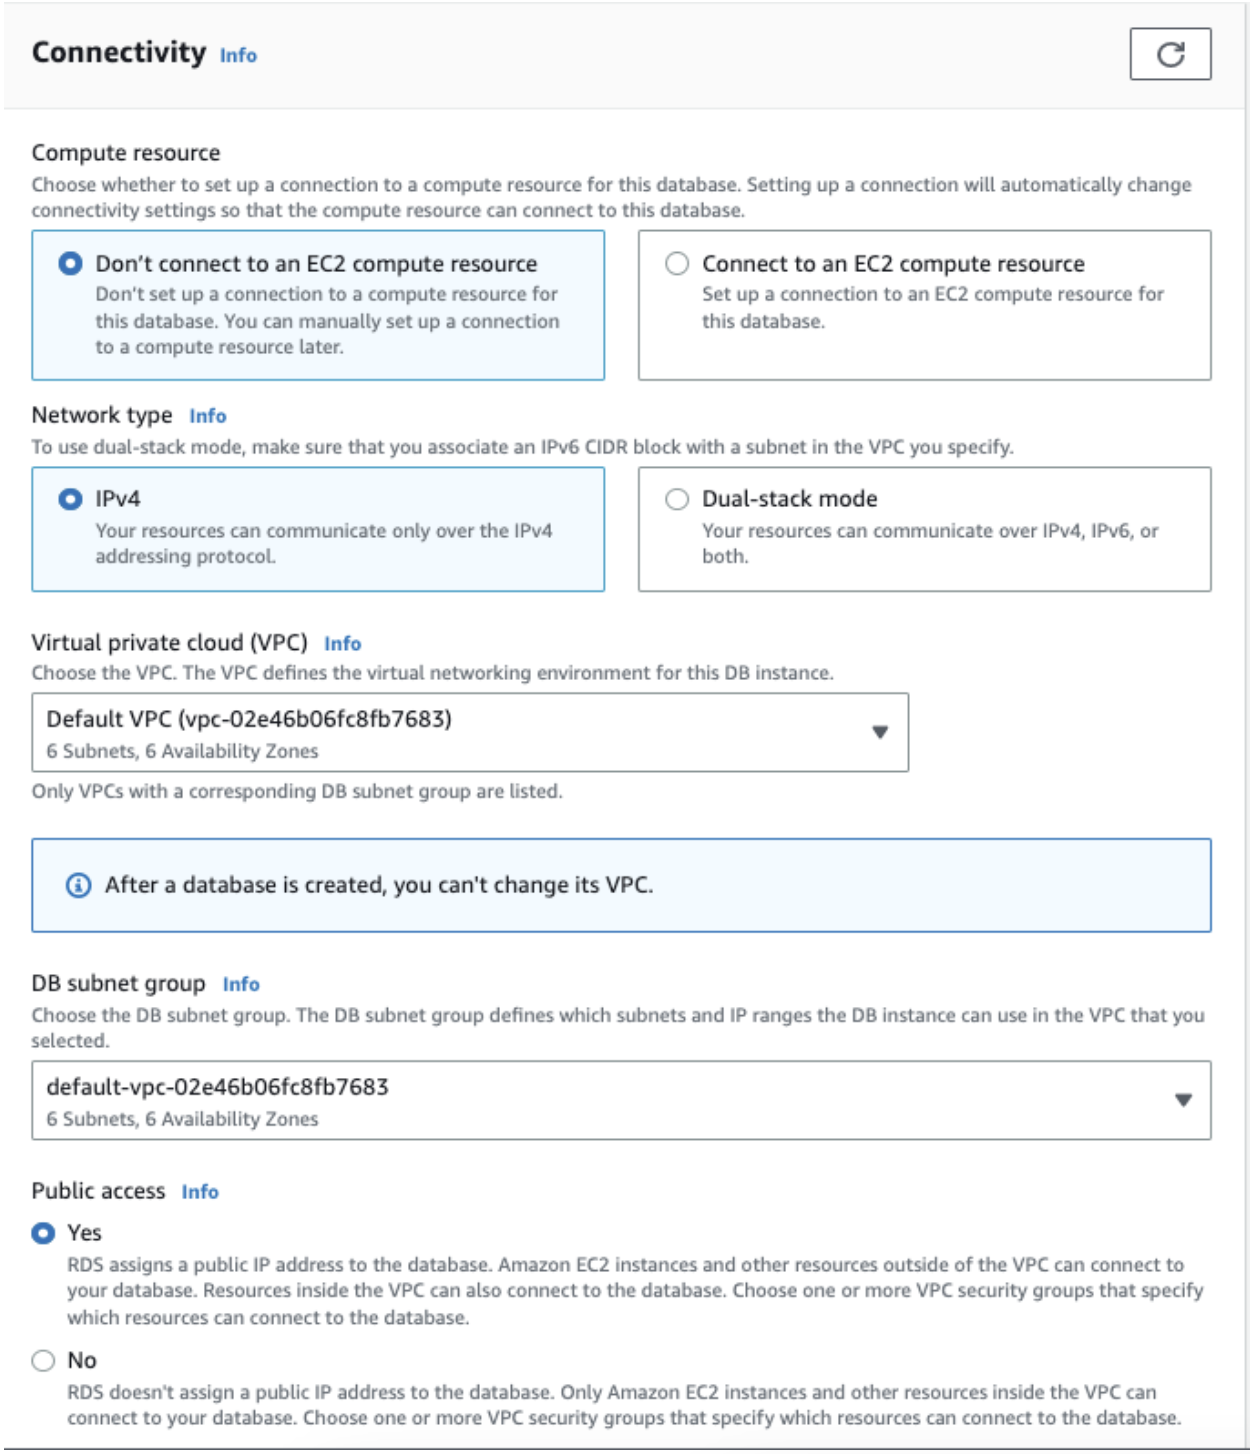
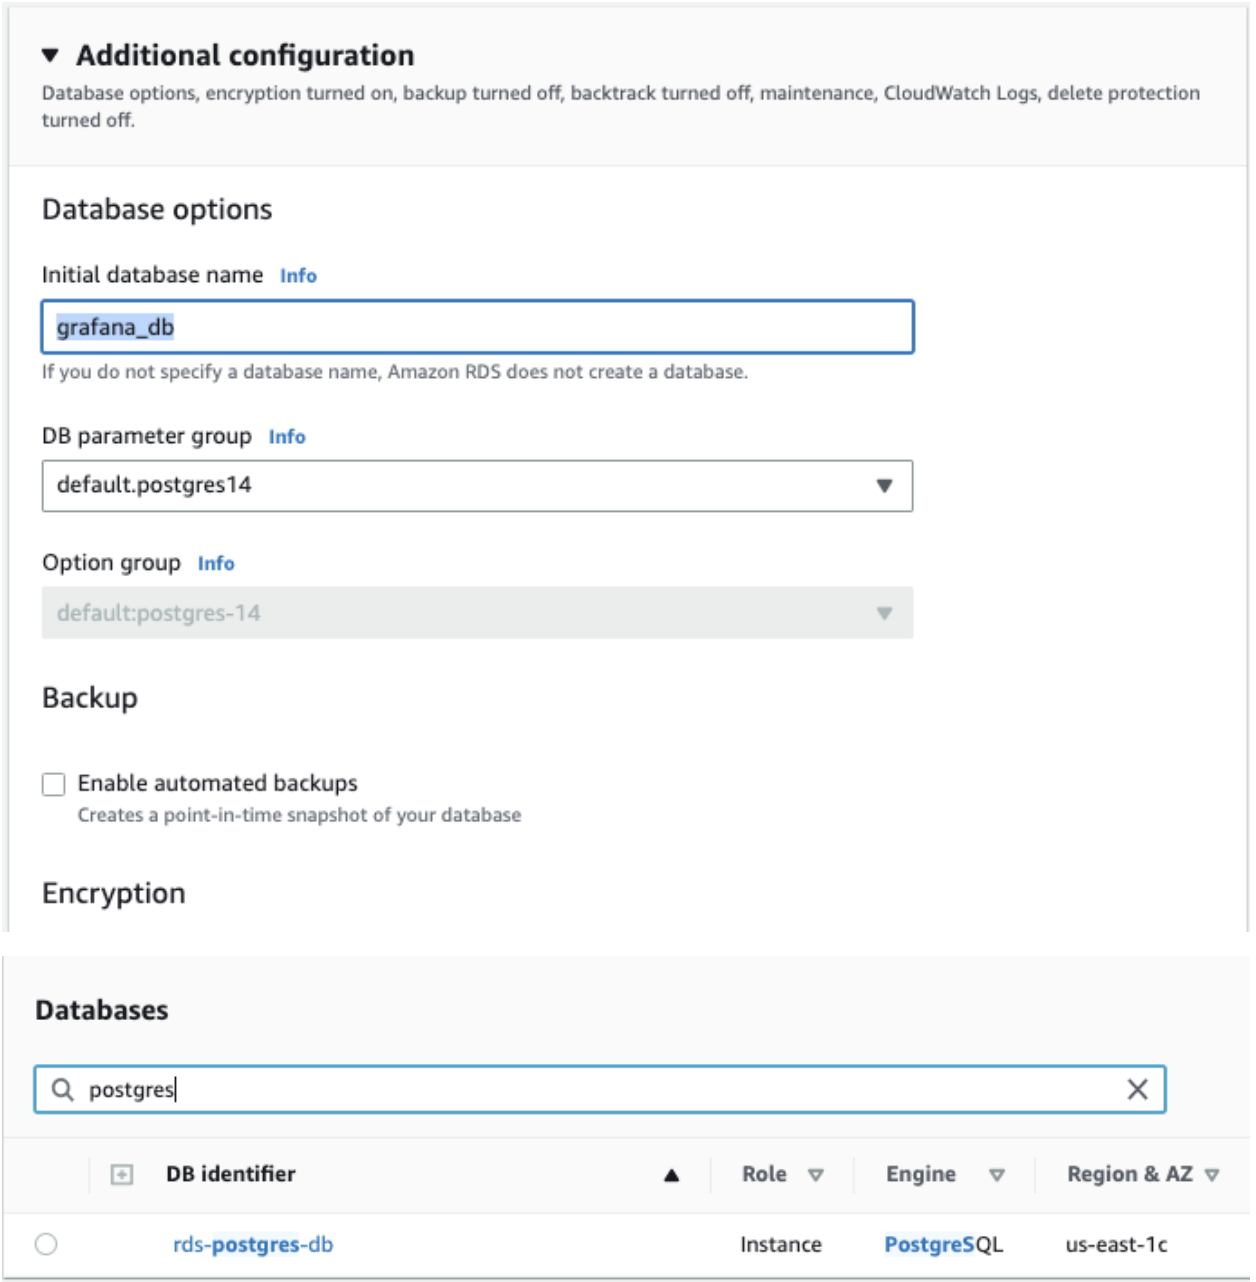
Select PostgreSQL as the database engine and follow the wizard to configure your instance details, including instance size, storage, and security settings.
Make sure to note down the database endpoint, port, database name, and master username for later use.
Configure Inbound Security Group Rules:
- In your RDS instance's security group settings, add an inbound rule to allow TCP connections on the PostgreSQL port (usually 5432) from the IP address of your monitoring server.

Setup PostgreSQL Exporter on the Monitoring Server
Step 1: Download and Install PostgreSQL Exporter
Download the PostgreSQL Exporter binary onto your monitoring server. Extract the downloaded archive and copy the exporter binary to a system directory.
 wget https://github.com/wrouesnel/postgres_exporter/releases/download/v0.12.0/postgres_exporter-0.12.0.linux-amd64.tar.gz
 tar xvfz postgres_exporter-0.12.0.linux-amd64.tar.gz
Navigate to the extracted directory:
cd postgres_exporter-0.12.0.linux-amd64Copy the exporter binary to a system directory:
sudo cp postgres_exporter /usr/local/bin
Create a Dedicated User for PostgreSQL Exporter
To securely access the PostgreSQL metrics for monitoring, it's a good practice to create a dedicated user with the necessary permissions for the PostgreSQL Exporter. This user will be used by the exporter to gather metrics from the PostgreSQL database.
Create a system user without login privileges:
Before creating a user in PostgreSQL, you can consider creating a system user on the server where PostgreSQL is installed. This system user won't have login privileges and will be used to enhance security.
sudo useradd --no-create-home --shell /bin/false postgres_exporterSwitch to the PostgreSQL user:
sudo su - postgresAccess the PostgreSQL command-line interface:
 # Ex: psql -h my-database-instance.c1abcdefg123.us-west-2.rds.amazonaws.com -p 5432 -d mydatabase -U myuser
 psql -h your-database-endpoint -p your-port -d your-database-name -U your-username
Create a user for the exporter and grant necessary privileges:
Now, while in the PostgreSQL command-line interface, create a new user specifically for the PostgreSQL Exporter. You can also assign a predefined role like
pg_monitorto ensure the user has the required privileges for monitoring.-- Create a user with a predefined monitoring role CREATE USER postgres_exporter WITH PASSWORD '<password>' NOCREATEROLE NOSUPERUSER NOCREATEDB; -- Assign the pg_monitor role to the user GRANT pg_monitor TO postgres_exporter; -- Make sure the user has permission to access tables in the public schema GRANT USAGE ON SCHEMA public TO postgres_exporter; -- Grant SELECT permissions on all tables in the public schema GRANT SELECT ON ALL TABLES IN SCHEMA public TO postgres_exporter; -- Set the search path for the user to public ALTER USER postgres_exporter SET search_path TO public; -- Exit the PostgreSQL command-line interface \qExit the PostgreSQL user session:
exit
Configure PostgreSQL Exporter
Create and edit the exporter configuration file:
sudo nano /etc/postgres_exporter.yamlAdd the following content to the file, replacing
<password>and the connection details with your RDS database information:connection_string: "postgresql://postgres_exporter:<password>@<AWS_RDS_HOST_URL>:5432/<DB_NAME>?sslmode=require" log_level: infoSave and close the configuration file.
Create a Systemd Service for PostgreSQL Exporter
Create and edit a systemd service unit file:
sudo nano /etc/systemd/system/postgres_exporter.serviceAdd the following content to the file:
 [Unit]
 Description=PostgreSQL Exporter
 After=network.target

 [Service]
 User=postgres_exporter
 ExecStart=/usr/local/bin/postgres_exporter --web.listen-address=:9187 --extend.query-path=/etc/postgres_exporter.yaml

 [Install]
 WantedBy=multi-user.target
Save and close the unit file.
Start and Enable PostgreSQL Exporter
Start the PostgreSQL Exporter service:
sudo systemctl start postgres_exporterEnable the service to start on system boot:
sudo systemctl enable postgres_exporter
Integration with Prometheus
Prometheus, when coupled with the PostgreSQL Exporter, offers a powerful solution for collecting and visualizing PostgreSQL database metrics.
Prometheus Configuration
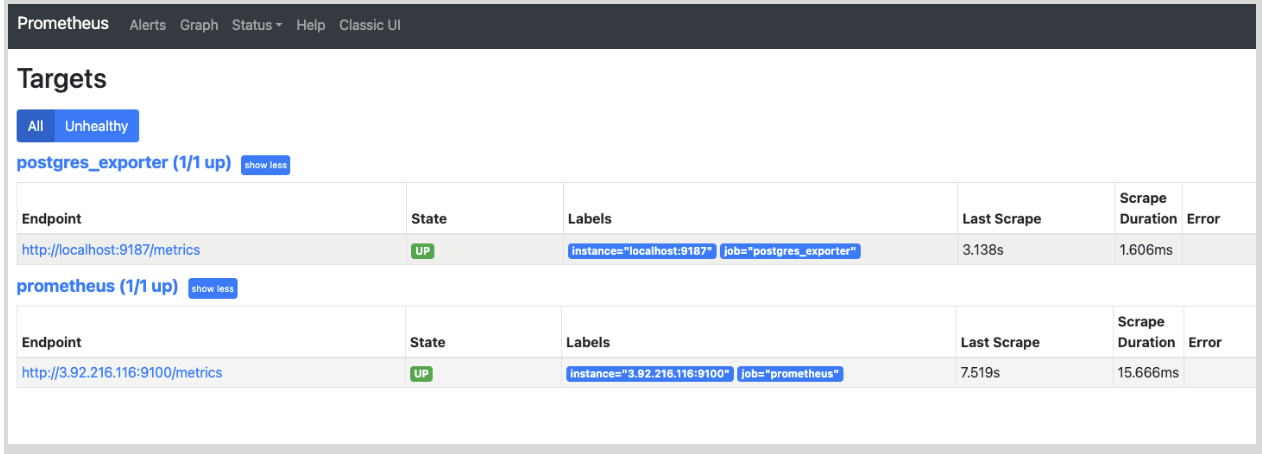
Once the PostgreSQL Exporter is properly configured, you need to update your Prometheus configuration to start scraping metrics from the exporter. Postgres exporter's default port is 9187.
scrape_configs:
  - job_name: 'postgresql'
    static_configs:
      - targets: ['localhost:9187']
Visualizing PostgreSQL Exporter Metrics on Grafana
Once you have Prometheus collecting metrics from the PostgreSQL Exporter, you can leverage Grafana's powerful visualization capabilities to create informative and customizable dashboards.
Importing Dashboards
Log in to Grafana: Open your web browser and navigate to your Grafana instance. Log in with your credentials.
Access Dashboards: Once you're logged in, locate the "Dashboards" section in the left-hand menu and click on it.
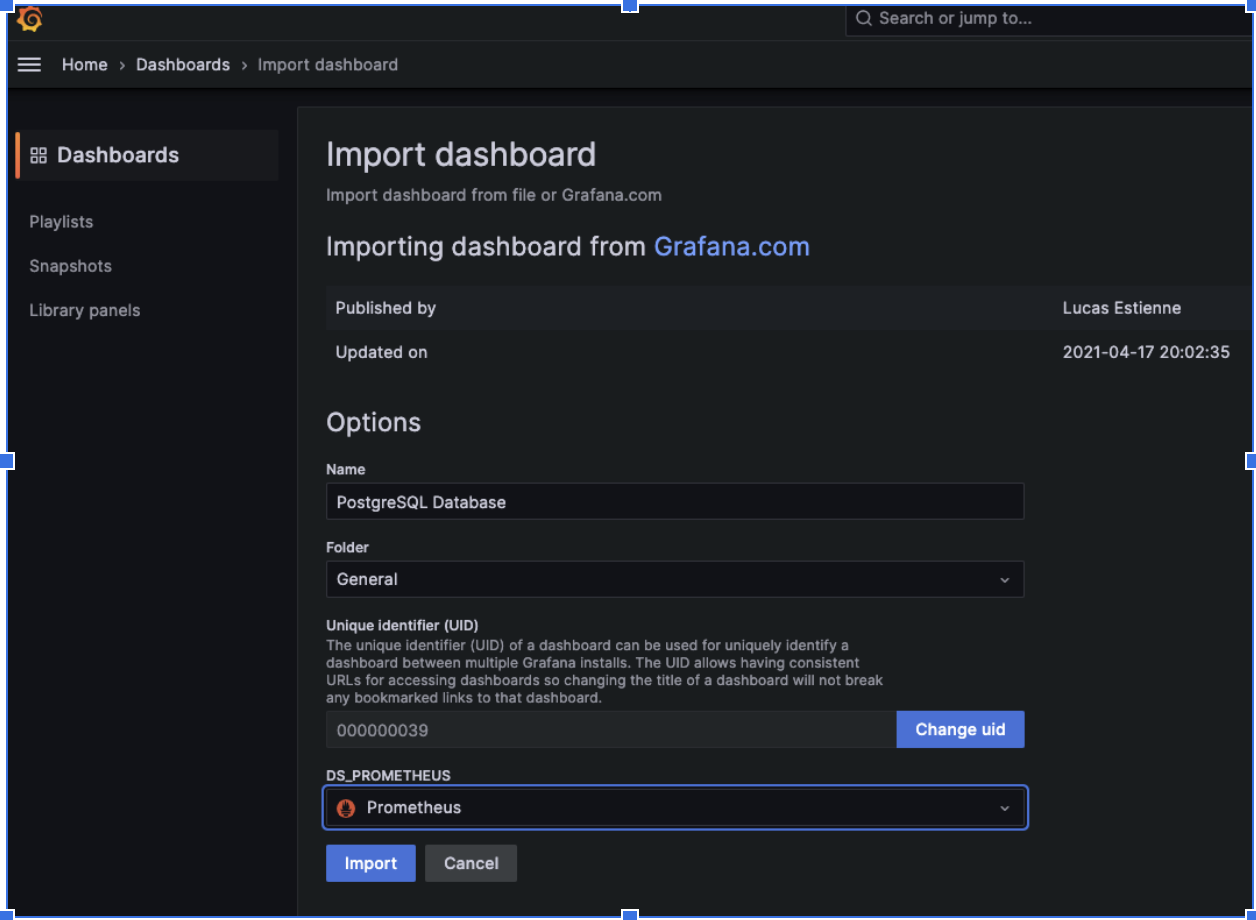
Import Dashboard: In the Dashboards section, click on the "Manage" submenu, and then select "Import."
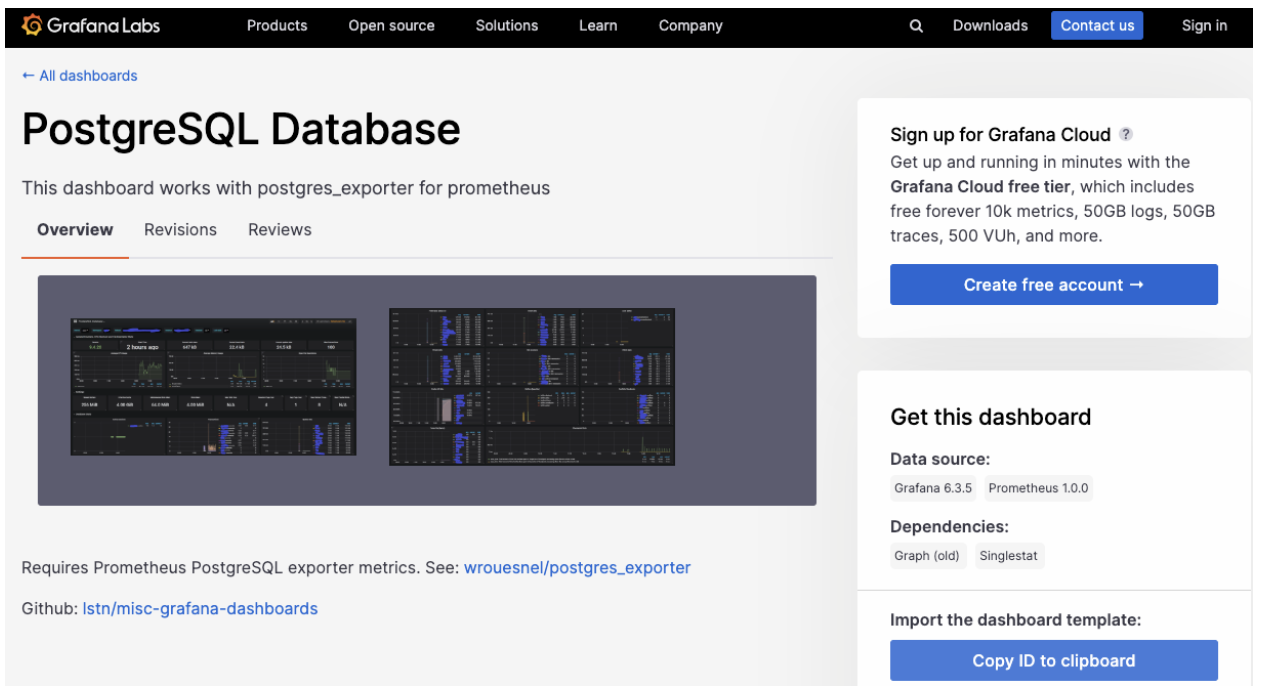
Import PostgreSQL Database Dashboard:
In the "Import via grafana.com" section, enter the dashboard ID: 11132.
Click on the "Load" button.
Customize the name and folder if desired.
Click on the "Import" button to complete the import.
Import PostgreSQL Statistics Dashboard:
- Repeat the same steps as above, using dashboard ID: 9628.
Import Postgres Overview Dashboard:
- Repeat the same steps as above, using dashboard ID: 10462.
Understanding the Dashboards
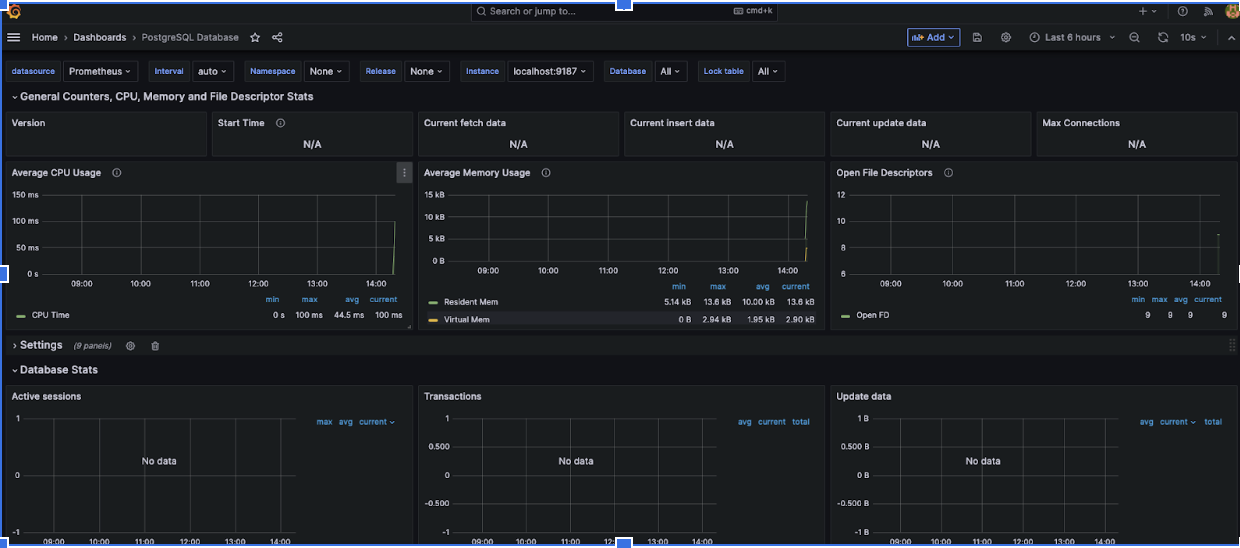
PostgreSQL Database Dashboard:
This dashboard provides an overview of the PostgreSQL database's performance and health. It includes panels that display key metrics such as query response time, connection activity, and cache hit rate. The dashboard offers insights into the overall database workload and helps you identify potential performance bottlenecks.
PostgreSQL Statistics Dashboard:
This dashboard focuses on visualizing detailed statistics from the PostgreSQL database. Panels on this dashboard display metrics related to table activity, indexing, and locks. These visualizations help you monitor database operations and identify any unusual behaviour that might require attention.
Postgres Overview Dashboard:
The Postgres Overview dashboard offers a comprehensive view of your PostgreSQL instance's health and performance. It presents key metrics in a concise format, including CPU usage, memory utilization, disk activity, and query performance. This dashboard is designed to provide a quick snapshot of your PostgreSQL environment.
Visualising Dashboards
Monitoring Django Application
Monitoring your Django application is crucial for maintaining its performance and diagnosing potential issues. By implementing application monitoring with custom metrics, you gain insights into how your application is behaving under different conditions. This helps you identify bottlenecks, optimize performance, and ensure a seamless user experience.
Why Django App Monitoring is Required
Django application monitoring provides several benefits:
Performance Optimization: Monitoring allows you to identify performance bottlenecks and optimize your codebase to deliver faster responses.
Issue Detection: Monitoring helps in early detection of errors, exceptions, and anomalies, enabling you to take timely corrective actions.
Resource Utilization: Track the resource utilization of your application, ensuring that it's not overloading the server.
User Experience: Monitoring helps maintain a consistent user experience by preventing slow responses and downtime.
Steps to Export Metrics from Django App
To monitor your Django application, you can leverage Prometheus client libraries, which allow you to define custom metrics that Prometheus can collect and store.
Install
django-prometheus:- Use pip to install the
django-prometheuspackage:
- Use pip to install the
pip install django-prometheus
Add Prometheus to
INSTALLED_APPS:- Open your Django project's settings (
settings.py) and add'django_prometheus'to theINSTALLED_APPSlist.
- Open your Django project's settings (
    INSTALLED_APPS = [
        # ...
        'django_prometheus',
        # ...
    ]
Add Prometheus Middlewares:
- Include Prometheus middlewares in your
MIDDLEWAREsettings. Add these lines to yoursettings.py:
- Include Prometheus middlewares in your
    MIDDLEWARE = [
        'django_prometheus.middleware.PrometheusBeforeMiddleware',
        # ...
        'django_prometheus.middleware.PrometheusAfterMiddleware',
    ]
Include Prometheus URLs:
- Make sure to include the Prometheus-related URLs in your project's
urls.py:
- Make sure to include the Prometheus-related URLs in your project's
    from django_prometheus import urls as prometheus_urls

    urlpatterns = [
        # ...
        path('prometheus/', include(prometheus_urls)),
        # ...
    ]
Integrating with Prometheus
Integrating Django application metrics with Prometheus empowers you to gather insights into your application's performance and behavior. Prometheus offers a flexible and powerful mechanism for collecting and storing these metrics, enabling you to monitor and analyze various aspects of your Django app.
How Prometheus Integration Works
Prometheus integration involves using the django-prometheus package, which provides client libraries to automatically expose metrics related to your Django application's behavior. These metrics encompass information about HTTP requests, database queries, cache usage, and more.
Here's how the integration works:
Instrumentation: The
django-prometheuspackage includes middleware and decorators that instrument your Django app to capture metrics.Automatic Exposition: Once instrumented, your app metrics are automatically exposed in a format that Prometheus can scrape and store.
Data Collection: Prometheus regularly scrapes the metrics endpoints exposed by your Django app to collect data.
Query and Visualization: You can use Prometheus's querying language (PromQL) to analyze and create visualizations of the collected metrics.
Updating Prometheus Configuration
To ensure that Prometheus collects metrics from your Django application, you need to update your Prometheus configuration file to include the appropriate target.
Edit
prometheus.yml:- Open your Prometheus configuration file (usually named
prometheus.yml) in a text editor.
- Open your Prometheus configuration file (usually named
Add a New
jobConfiguration:- Add a new
jobconfiguration to specify the target from which Prometheus should scrape metrics.
- Add a new
    scrape_configs:
      - job_name: 'django_app'
        static_configs:
          - targets: ['your_django_app_ip:port']
Replace 'your_django_app_ip:port' with the actual IP address or the deployed url and port where your Django application is running.
Restart Prometheus:
- After saving the configuration file, restart Prometheus to apply the changes.
Verify Metrics Collection:
- Access your Prometheus web interface and navigate to the "Targets" section. Verify that the status for the Django app target is "UP."
Visualising Django Application metrics
Once you've integrated Prometheus into your Django application and your custom metrics are being collected, it's time to visualize these metrics effectively using Grafana.
Importing the Django Prometheus Dashboard
Grafana Labs offers a curated collection of dashboards that cover various monitoring scenarios.
Accessing Grafana Dashboard Library
Open your web browser and navigate to your Grafana instance.
Log in to your Grafana account with the appropriate credentials.
Importing the Django Prometheus Dashboard
Once you're logged in, click on the "Create" button on the left-hand navigation menu.
From the drop-down menu, select "Import."
In the "Import via grafana.com" section, you'll find a field to enter the dashboard ID. For the Django Prometheus dashboard, use the ID 9528.
Click the "Load" button. Grafana will fetch the dashboard configuration from Grafana Labs.
The dashboard details will be displayed, including its title and a brief description. You can review this information to ensure that you're importing the correct dashboard.
Scroll down and find the "Import" button. Click it to finalize the import process.
Configuring Data Source
- After importing the dashboard, Grafana will prompt you to select a data source. Choose your Prometheus data source from the available options.
Exploring the Django Prometheus Dashboard
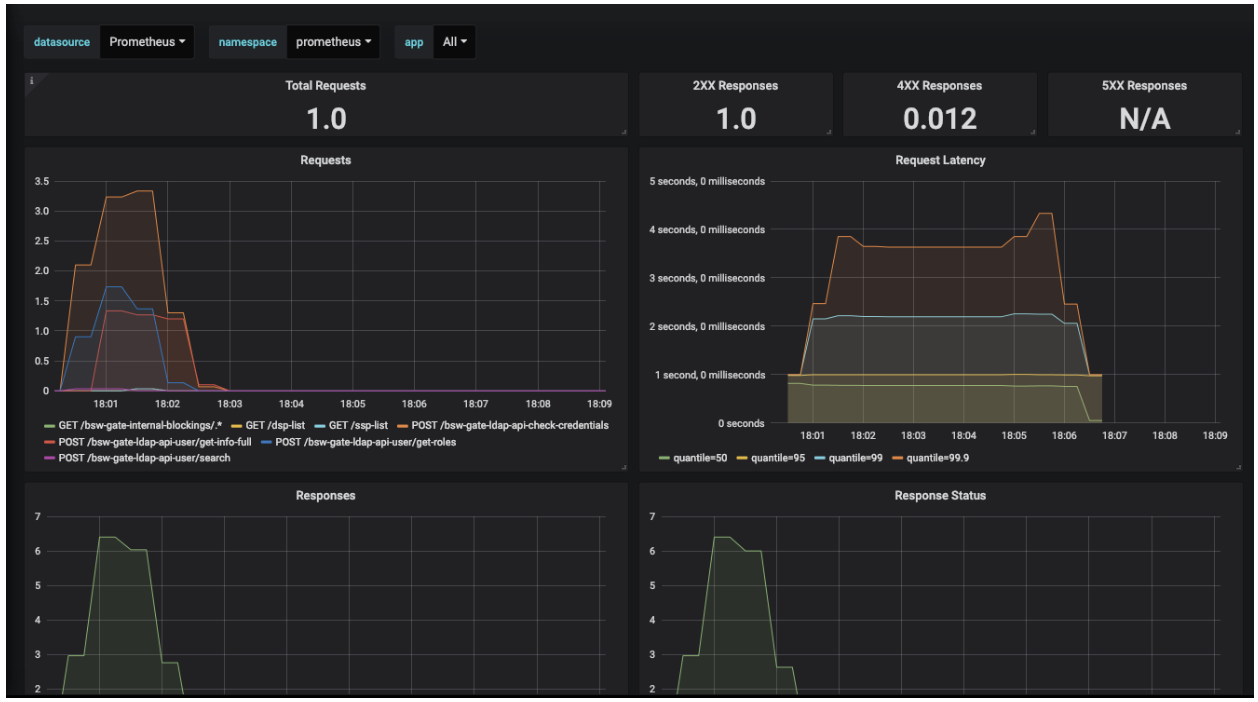
Once the data source is configured, you'll be directed to the imported dashboard.
The dashboard will consist of various panels that display different metrics collected from your Django application. These panels provide insights into request latencies, response times, database query durations, and more.
Customize the dashboard: You can customize the dashboard by adjusting time ranges, panel layouts, and visualizations to suit your specific monitoring needs.
Log Monitoring with Loki
In the world of modern software systems, logs play a pivotal role in providing insights into application behavior, diagnosing issues, and ensuring the overall health of your applications. Loki, a log aggregation system developed by Grafana Labs, along with Promtail and Grafana, forms a powerful trio that enables efficient log monitoring, collection, and visualization.
Loki: Loki is an open-source, horizontally-scalable log aggregation system designed to efficiently store and query massive amounts of log data. Unlike traditional log aggregation tools, Loki doesn't store logs as individual documents but rather in chunks, which significantly reduces storage costs and improves query performance.
Promtail: Promtail is the agent responsible for gathering logs and sending them to Loki. It supports various log formats and can scrape logs from local files, systemd journal, and remote services like syslog. Promtail also enriches log entries with labels, making it easier to filter and query logs later.
Setting Up Promtail
Promtail is responsible for collecting logs and sending them to Loki.
Installation and Configuration
- Install Promtail using a package manager or download the binary:
wget https://github.com/grafana/loki/releases/download/v2.3.0/promtail-linux-amd64.zip
unzip promtail-linux-amd64.zip
chmod +x promtail-linux-amd64
- Create a configuration file for Promtail, e.g.,
promtail-config.yaml:
server:
  http_listen_port: 9080
  grpc_listen_port: 0

positions:
  filename: /tmp/positions.yaml

clients:
  - url: http://loki:3100/loki/api/v1/push

scrape_configs:
  - job_name: journal
    journal:
      max_age: 12h
      path: /var/log/journal
      labels:
        job: systemd-journal
    relabel_configs:
      - source_labels: ['__journal__systemd_unit']
        target_label: 'unit'
      - source_labels: ['__journal__hostname']
        target_label: 'hostname'
Running Promtail as a Service
Running Promtail as a systemd service ensures that it starts automatically on system boot, restarts in case of failures, and can be managed easily.
Create a Promtail User
It's a good practice to create a dedicated user for running Promtail:
sudo useradd -m -s /bin/bash promtailInstall Promtail
Install Promtail using the steps mentioned in the previous responses.
Create a systemd Service File
Create a systemd service file for Promtail:
sudo nano /etc/systemd/system/promtail.servicePaste the following content into the file:
 [Unit]
 Description=Promtail Service
 After=network.target

 [Service]
 User=promtail
 Group=promtail
 Type=simple
 ExecStart=/path/to/promtail -config.file=/path/to/promtail-config.yaml

 [Install]
 WantedBy=multi-user.target
Replace
/path/to/promtailwith the actual path to your Promtail binary and/path/to/promtail-config.yamlwith the actual path to your Promtail configuration file.Enable and Start the Service
Enable the service to start on boot:
sudo systemctl enable promtailStart the service:
sudo systemctl start promtailCheck the Service Status
Check the status of the Promtail service:
sudo systemctl status promtailLogs and Management
View logs generated by the Promtail service:
sudo journalctl -u promtail
Setting Up Loki Data Source in Grafana
Grafana allows you to integrate Loki data sources to create informative and interactive dashboards. Loki, a log aggregation system that efficiently stores and queries log data. Setting up the Loki data source in Grafana enables you to visualize and analyze logs using Grafana's rich features.
Open Grafana and Access Data Sources
Open your Grafana instance in a web browser and log in with your credentials.
Once logged in, click on the gear icon (⚙️) on the left sidebar to access the main configuration menu.
Add a New Data Source
From the configuration menu, select "Data Sources."
Click the "Add data source" button located in the top right corner of the Data Sources page.
Choose Loki as the Data Source Type
In the "Select a data source type" search bar, type "Loki" to quickly find the Loki data source.
Click on the "Loki" option to proceed with configuring the Loki data source.
Configure Loki Data Source Settings
Fill in the necessary information in the "HTTP" section:
Name: Give your data source a meaningful name, such as "Loki" or "Log Aggregation."
URL: Enter the URL where Loki is accessible. This is typically the address of your Loki server, such as
http://localhost:3100.
HTTP Settings (Optional):
Access: Choose the access mode that best fits your environment's security requirements. Options include "Browser," "Server (Default)," and "Direct."
HTTP Method: Leave this set to the default "GET."
Loki Settings:
- Min time interval: Specify the minimum time interval between data points in the query results. This setting affects how data is aggregated and displayed in your panels.
Save and Test the Data Source
After configuring the settings, scroll down to the bottom of the page and click the "Save & Test" button.
Grafana will attempt to establish a connection to Loki using the provided settings. If successful, you will see a green banner indicating that the data source is working.
Begin Using Loki in Grafana Dashboards
With the Loki data source successfully added, you can now use it to create log-based panels in your Grafana dashboards.
Create a new dashboard or edit an existing one.
Add a new panel by clicking the "Add Panel" button.
In the panel configuration, select the Loki data source you've just added.
Use Loki Queries in Panels
Within the panel configuration, you'll find the "Query" section. This is where you'll define the Loki query that retrieves the log data you want to visualize.
Use the Loki query language to filter and search for logs based on labels, keywords, time ranges, and more.
Customize Panel Visualization
Customize the visualization of your panel to display log data effectively. Choose the appropriate visualization type (such as Graph, Table, or Logs), set labels, and adjust other settings as needed.
Save the panel configuration once you're satisfied with the setup.
Step 9: Save and Share Your Dashboard
After configuring and customizing panels, save your dashboard to preserve your work.
Share the dashboard URL or embed it in other platforms to provide visibility into your log data to relevant stakeholders.
Conclusion
In the journey of understanding and implementing monitoring solutions with Grafana and Prometheus, we've covered a diverse range of topics to empower you in maintaining resilient systems and applications. Here's a recap of the key takeaways:
Holistic Monitoring for Success: Monitoring is not just an afterthought but a proactive strategy to ensure the health, performance, and reliability of your infrastructure, databases, and applications. By leveraging Grafana and Prometheus, you've learned how to gain real-time insights that enable quick issue identification and effective decision-making.
Insights Lead to Optimization: The ability to access metrics, logs, and performance data from various layers of your technology stack equips you with the insights needed to optimize resource utilization, identify bottlenecks, and deliver better user experiences. By applying monitoring best practices, you're well-equipped to continually refine your systems and achieve operational excellence.
Empowerment through Customization: Grafana's flexibility and Prometheus' adaptability have empowered you to create tailor-made dashboards and alerts that align with your organization's unique requirements. Through this guide, you've discovered the art of crafting visualizations that resonate with your team and stakeholders, fostering a deeper understanding of your system's behavior.
Continuous Learning and Exploration: While this guide has provided you with a solid foundation, the world of monitoring is dynamic and ever-evolving. We encourage you to dive deeper into Grafana's expansive plugin ecosystem, Prometheus' advanced querying capabilities, and complementary tools like Loki for advanced log analysis. By staying curious and open to experimentation, you'll uncover new ways to refine your monitoring strategies.
Community and Collaboration: Remember that you're not alone in this journey. Grafana and Prometheus have vibrant communities that share insights, tips, and best practices. Engaging with these communities can provide you with fresh perspectives, troubleshooting guidance, and innovative ideas that can supercharge your monitoring efforts.
As you move forward, we urge you to embrace the power of monitoring as a fundamental aspect of building, scaling, and maintaining digital solutions. Whether you're managing a small application or a complex microservices architecture, monitoring with Grafana and Prometheus will always be your trusted companion, ensuring your systems sail smoothly through the dynamic seas of technology.
So, seize the opportunity to refine your monitoring stack, dive into the realms of insightful data, and drive your systems towards new heights of efficiency and reliability. Your journey with Grafana, Prometheus, and related tools is just beginning, and the possibilities are endless. Happy monitoring!
Additional Resources and References
-
- Official documentation for Grafana, including installation guides, configuration options, and usage instructions.
-
- Official documentation for Prometheus, covering setup, configuration, querying, and alerting.
-
- A list of officially maintained and community-contributed exporters for various services and platforms.
-
- Official documentation for Loki, providing information on setup, configuration, and log aggregation using Loki and Grafana.
-
- Collection of tutorials covering various aspects of Grafana, including dashboard creation, data source integration, and more.
Prometheus Monitoring for Beginners
- A beginner-friendly tutorial on installing Prometheus on Ubuntu 20.04.
Monitoring Django Applications with Prometheus
- A guide to monitoring Django applications using Prometheus and Grafana.
Setting Up Loki for Log Aggregation
- A step-by-step guide to setting up Loki for log aggregation and visualization within Grafana.
Subscribe to my newsletter
Read articles from Jayanth Kumar directly inside your inbox. Subscribe to the newsletter, and don't miss out.
Written by

Jayanth Kumar
Jayanth Kumar
SDE - Structured Labs YC S23, Past - SDE Arista Networks, C4GT Open Source Contributor, DevOps Tech4Dev - Dalgo, Application Developer Texas Instruments, Full Stack Developer TVS Motor Corp, Healthcare Winner @Hackverse4.0, Finalist @SIH