VictoriaMetrics: deploying a Kubernetes monitoring stack
 Arseny Zinchenko
Table of contents
- Planning
- VictoriaMetrics Stack Helm Chart installation
- A minimal values for the VictoriaMetrics chart
- Creating own helm chart for the monitoring stack
- Prometheus CloudWatch Exporter subchart
- Collecting metrics from exporters: VMAgent && scrape_configs
- Grafana provisioning
- Running Grafana Loki with AWS S3
- Configuring alerts with VMAlert

Now we have VictoriaMetrics + Grafana on a regular EC2 instance, launched with Docker Compose, see the VictoriaMetrics: an overview and its use instead of Prometheus.
It was kind of a Proof of Concept, and it’s time to launch it “in an adult way” – in Kubernetes and all the configurations stored in a GitHub repository.
VictoriaMetrics has charts for each component to deploy in Kubernetes, see Victoria Metrics Helm Charts, and there are charts to run VictoriaMetrics Operator andvictoria-metrics-k8s-stack – an analog of the Kuber Prometheus Stack, which I’ve used before.
We will use the victoria-metrics-k8s-stack which “under the hood” will launch VictoriaMetrics Operator, Grafana, and kube-state-metrics, see its dependencies.
This post turned out to be quite long, but I tried to describe all the interesting points of deploying full-fledged monitoring with the VictoriaMetrics Kubernetes Monitoring Stack.
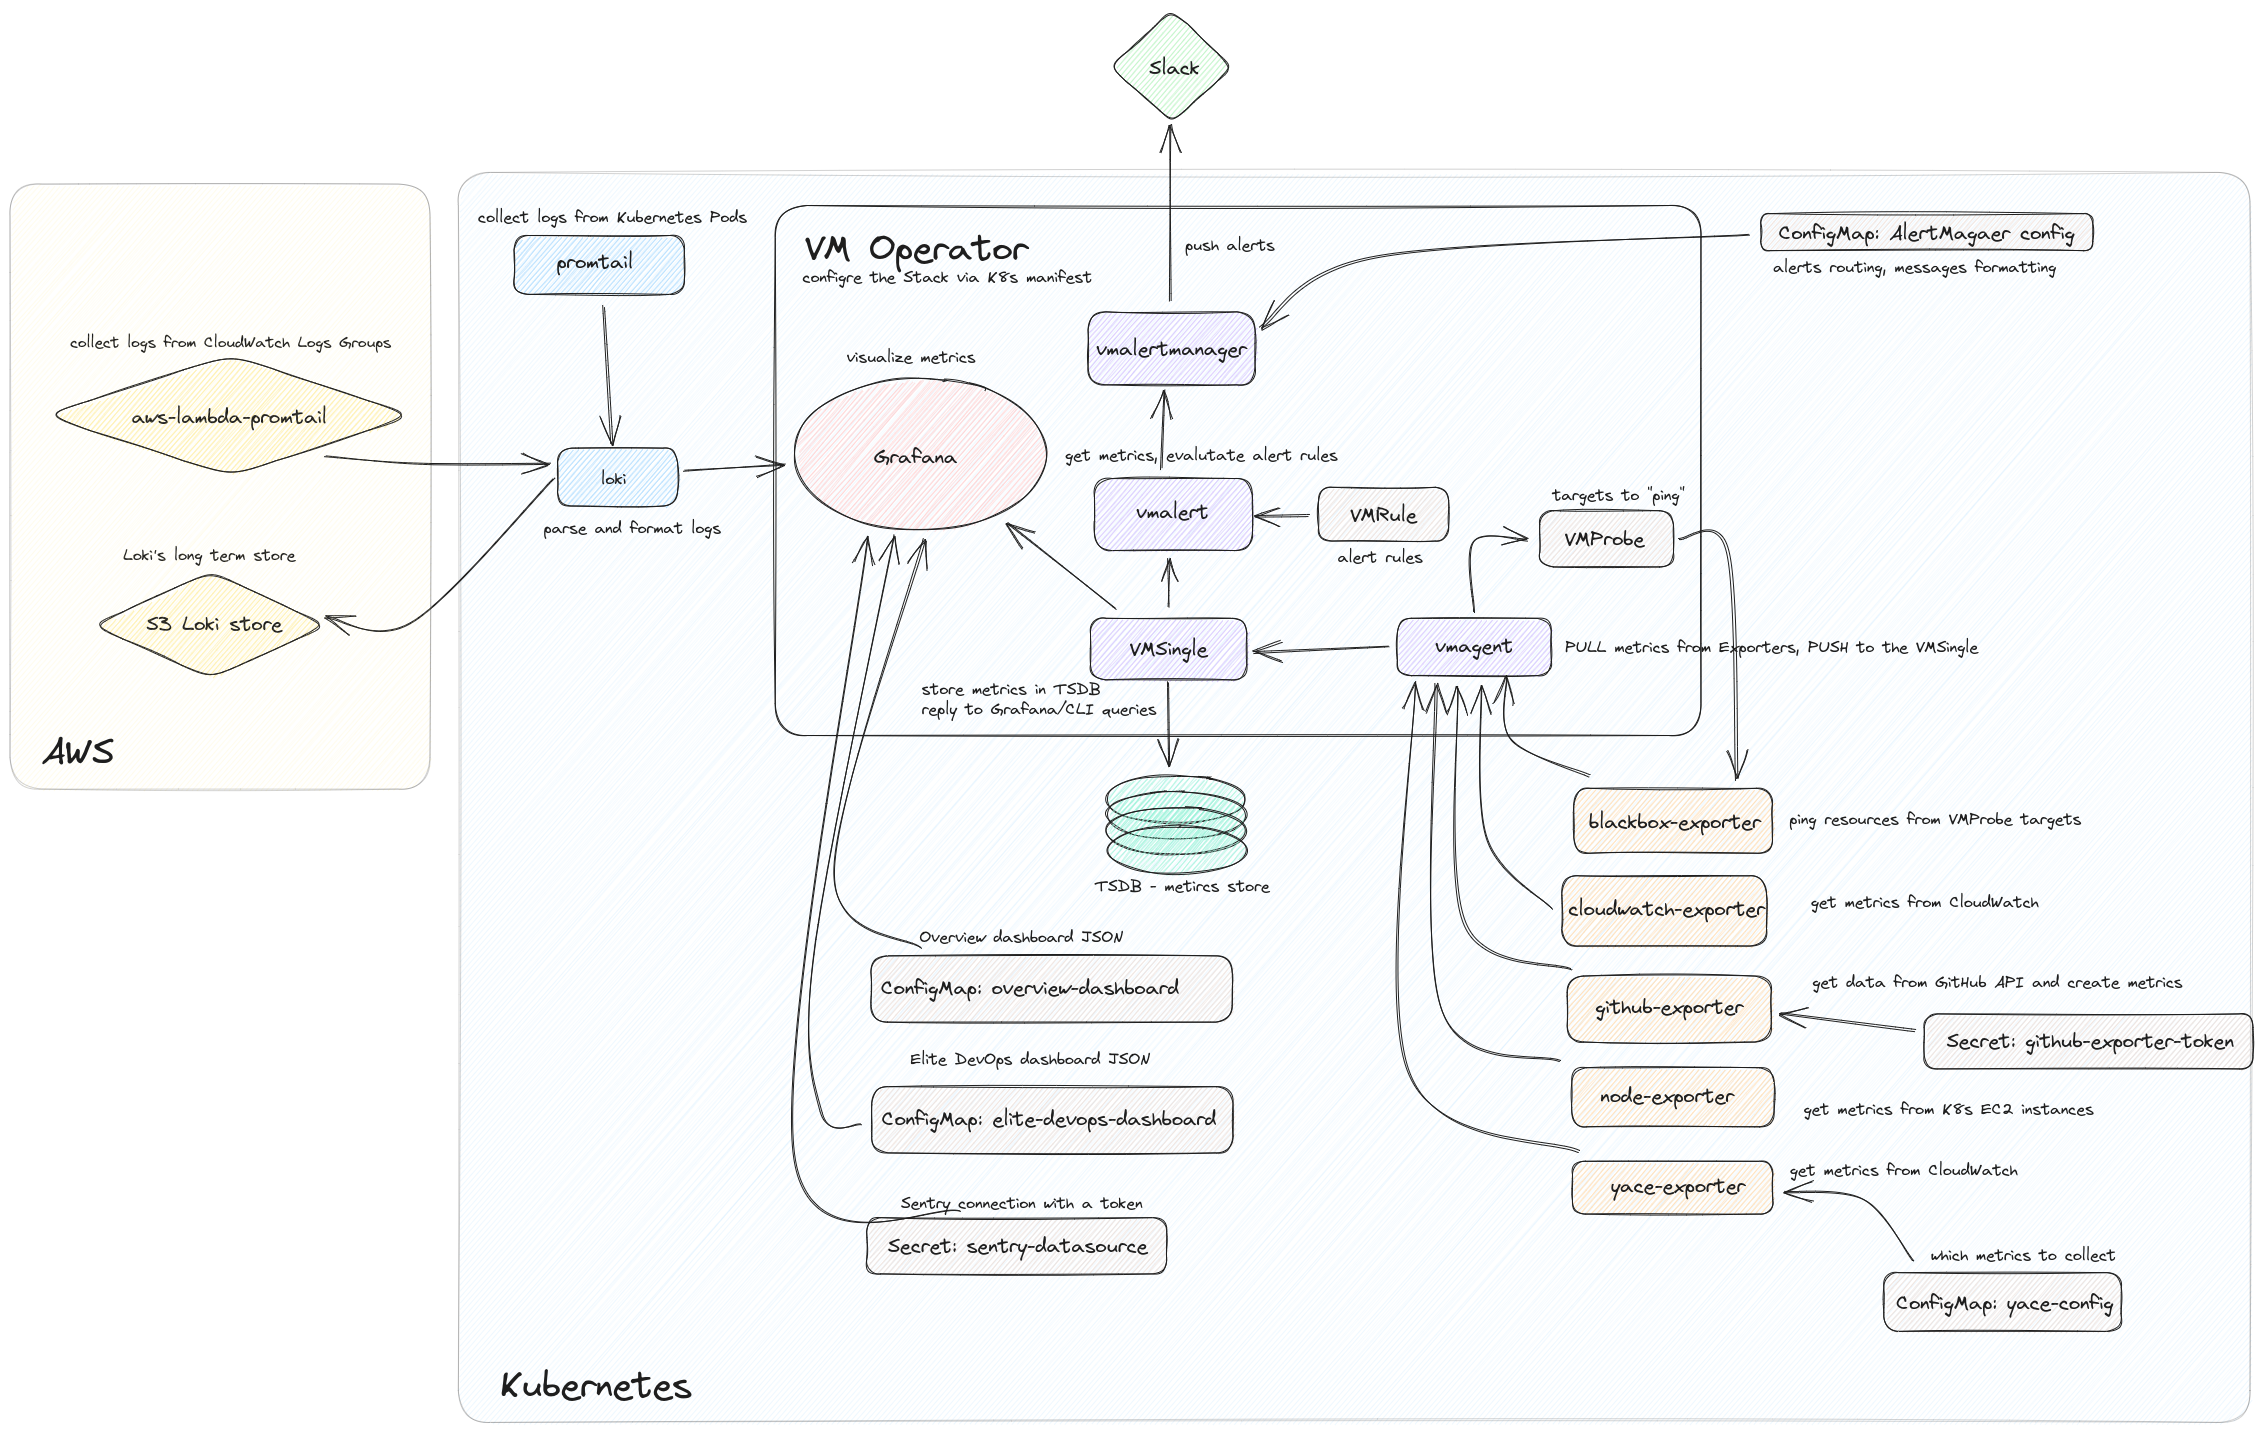
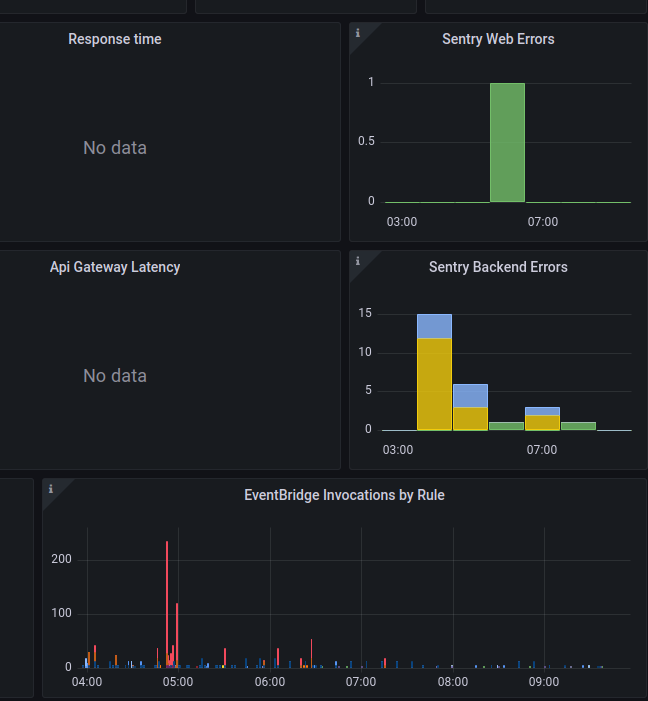
UPD: I did a documentation today on my project where I’ve set up that stack, and here is what we will have as the result:
Planning
So, what will need to be done:
check the deployment of the
victoria-metrics-k8s-stackHelm chartlook and think about how to run Prometheus exporters – some of them have charts, but we also have self-written ones (see Prometheus: GitHub Exporter – creating own exporter for GitHub API), so that exporters will have to be pushed to the Elastic Container Service and pulled from there to run in Kubernetes
secrets for monitoring – Grafana passwords, exporters tokens, etc
IRSA for exporters – Create IAM Policy and Roles for ServiceAccounts
transfer of existing alerts
config for VMAgent to collect metrics from the exporters
run Grafana Loki
Regarding the logs, recently VictoriaLogs was released, but it is still in preview, do not have support to store data in AWS S3, do not have integration with Grafana, and in general, I do not want to spend time yet, as I already know Loki more or less. Perhaps I will launch VictoriaLogs separately, to “play around and see”, and when it will be integrated with Grafana, I will replace Loki with VictoriaLogs, because now we already have dashboards with graphs from Loki logs.
Also, it will be necessary to take a look at persistence in VictoriaMetrics in Kubernetes – size, types of disks, and so on. Maybe think about their backups (VMBackup?).
We have a lot of things in the existing monitoring:
root@ip-172-31-89-117:/home/admin/docker-images/prometheus-grafana# tree .
├── alertmanager
│   ├── config.yml
│   └── notifications.tmpl
├── docker-compose.yml
├── grafana
│   ├── config.monitoring
│   └── provisioning
│       ├── dashboards
│       │   └── dashboard.yml
│       └── datasources
│           └── datasource.yml
├── prometheus
│   ├── alert.rules
│   ├── alert.templates
│   ├── blackbox-targets
│   │   └── targets.yaml
│   ├── blackbox.yml
│   ├── cloudwatch-config.yaml
│   ├── loki-alerts.yaml
│   ├── loki-conf.yaml
│   ├── prometheus.yml
│   ├── promtail.yaml
│   └── yace-config.yaml
└── prometheus.yml
What to deploy at all? Through the AWS CDK and its cluster.add_helm_chart() – or do a separate step in GitHub Actions with Helm?
We will need a CDK in any case – to create certificates from ACM, Lambda for logs in Loki, S3 buckets, IAM roles for exporters, etc.
But I don’t like the idea to drag the deployment charts into the AWS CDK, because it is better to separate the deployment of infrastructure objects from the deployment of the monitoring stack itself.
OK – let’s do it separately: CDK will create resources in AWS, and Helm will deploy charts. Or a single chart? Maybe just make your own Helm chart, and connect VictoriaMetrics Stack and exporters to it as subcharts? Seems like a good idea.
We will also need to create Kubernetes Secrets and ConfigMaps with configs for VMAgent, Loki (see Loki: collecting logs from CloudWatch Logs using Lambda Promtail), Alertmanager, etc. Make them with Kustomize? Or just YAML-manifests in the templates directory of our chart?
Will see during setup.
Now in order – what needs to be done:
run exporters
connect a config to VMAgent to start collecting metrics from these exporters
check how ServiceMonitors are configured (VMServiceScrape in VictoriaMetrics)
Grafana:
data sources
dashboards
add Loki
alerts
Let’s go. Let’s start by checking the chart itself victoria-metrics-k8s-stack.
VictoriaMetrics Stack Helm Chart installation
Add repositories with dependencies:
$ helm repo add grafana https://grafana.github.io/helm-charts
"grafana" has been added to your repositories

$ helm repo add prometheus-community https://prometheus-community.github.io/helm-charts
"prometheus-community" has been added to your repositories
And VictoriaMetrics itself:
$ helm repo add vm https://victoriametrics.github.io/helm-charts/
"vm" has been added to your repositorie

$ helm repo updateHang tight while we grab the latest from your chart repositories...
...Successfully got an update from the "vm" chart repository
...Successfully got an update from the "grafana" chart repository
...Successfully got an update from the "prometheus-community" chart repository
Update Complete. ⎈Happy Helming!⎈
Check the versions of the victoria-metrics-k8s-stack chart:
$ helm search repo vm/victoria-metrics-k8s-stack -l
NAME                            CHART VERSION   APP VERSION     DESCRIPTION
vm/victoria-metrics-k8s-stack   0.17.0          v1.91.3         Kubernetes monitoring on VictoriaMetrics stack....
vm/victoria-metrics-k8s-stack   0.16.4          v1.91.3         Kubernetes monitoring on VictoriaMetrics stack....
vm/victoria-metrics-k8s-stack   0.16.3          v1.91.2         Kubernetes monitoring on VictoriaMetrics stack....
...
All values can be taken as follows:
helm show values vm/victoria-metrics-k8s-stack > default-values.yaml
Or just from the repository – values.yaml.
A minimal values for the VictoriaMetrics chart
VictoriaMetrics has very good documentation, so during the process, we will often use the API Docs.
Here, we’ll use VMSingle instead of VMCluster as our project is small, and I’m just getting to know VictoriaMetrics, so I don’t want to complicate the system.
Create a minimal configuration:
# to confugire later
victoria-metrics-operator:
  serviceAccount:
    create: false
# to confugire later
alertmanager:
  enabled: true
# to confugire later
vmalert:
  annotations: {}
  enabled: true
# to confugire later
vmagent:
  enabled: true
grafana:
  enabled: true
  ingress:
    enabled: true
    annotations:
      kubernetes.io/ingress.class: alb
      alb.ingress.kubernetes.io/target-type: ip
      alb.ingress.kubernetes.io/scheme: internet-facing
    hosts:
      - monitoring.dev.example.co
Deploy to a new namespace:
$ helm upgrade --install victoria-metrics-k8s-stack -n dev-monitoring-ns --create-namespace vm/victoria-metrics-k8s-stack -f atlas-monitoring-dev-values.yaml
Check Pods:
$ kk -n dev-monitoring-ns get pod
NAME                                                              READY   STATUS              RESTARTS   AGE
victoria-metrics-k8s-stack-grafana-76867f56c4-6zth2               0/3     Init:0/1            0          5s
victoria-metrics-k8s-stack-kube-state-metrics-79468c76cb-75kgp    0/1     Running             0          5s
victoria-metrics-k8s-stack-prometheus-node-exporter-89ltc         1/1     Running             0          5s
victoria-metrics-k8s-stack-victoria-metrics-operator-695bdxmcwn   0/1     ContainerCreating   0          5s
vmsingle-victoria-metrics-k8s-stack-f7794d779-79d94               0/1     Pending             0          0s
And Ingress:
$ kk -n dev-monitoring-ns get ing
NAME                                 CLASS    HOSTS                      ADDRESS                                                                   PORTS   AGE
victoria-metrics-k8s-stack-grafana      monitoring.dev.example.co   k8s-devmonit-victoria-***-***.us-east-1.elb.amazonaws.com   80      6m10s
Wait for a DNS update or just open access to the Grafana Service – find it:
$ kk -n dev-monitoring-ns get svc
NAME                                                   TYPE        CLUSTER-IP       EXTERNAL-IP   PORT(S)                      AGE
victoria-metrics-k8s-stack-grafana                     ClusterIP   172.20.162.193           80/TCP                       12m
...
And run port-forward:
$ kk -n dev-monitoring-ns port-forward svc/victoria-metrics-k8s-stack-grafana 8080:80
Forwarding from 127.0.0.1:8080 -> 3000
Forwarding from [::1]:8080 -> 3000
Go to the http://localhost:8080/ in your browser.
The default username is admin, get its generated password:
$ kubectl -n dev-monitoring-ns get secret victoria-metrics-k8s-stack-grafana -o jsonpath="{.data.admin-password}" | base64 --decode ; echo
1Ev***Ko2
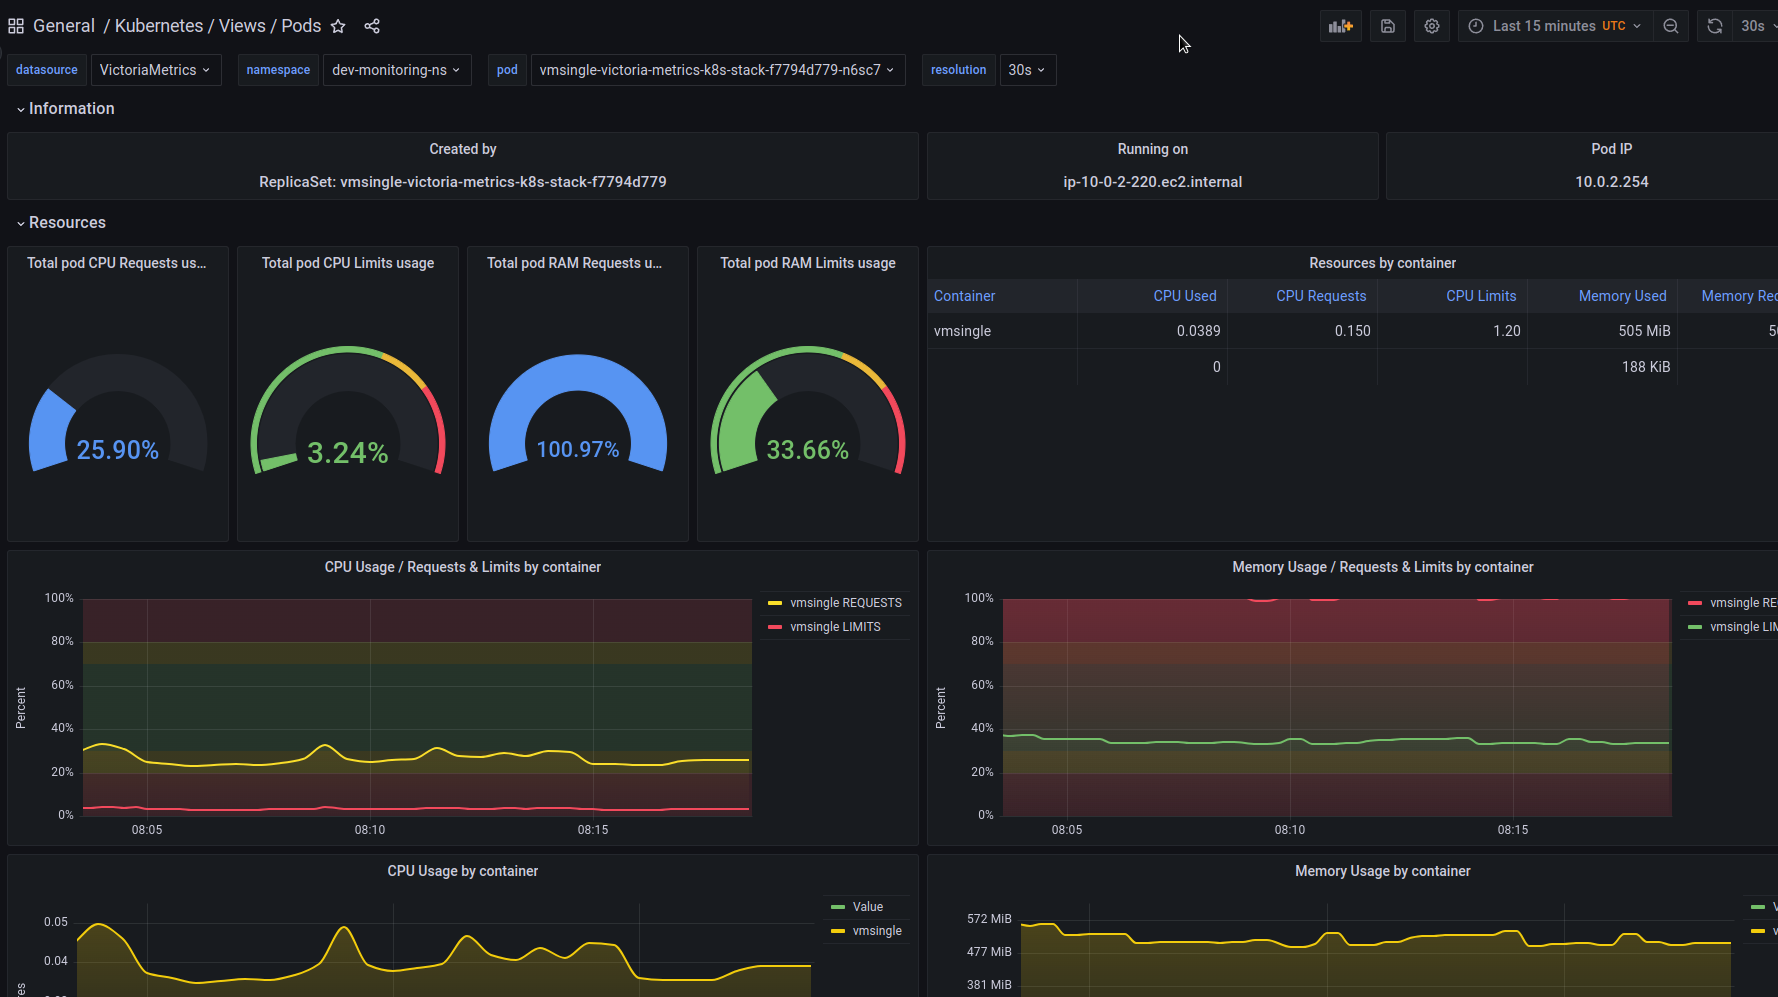
And we already have ready-made dashboards (the defaultDashboardsEnabled parameter in the default values):
Okay, that’s working, and it’s time to think about other settings.
Creating own helm chart for the monitoring stack
So, let’s make a kind of “umbrella chart” that will run the VictoriaMetrics Stack itself, all necessary Prometheus exporters, and will create all the necessary Secrets/ConfgiMaps, etc.
How will it work?
we’ll create a chart
in its
dependencieswe’ll add the VictoriaMetrics Stackin the same
dependencieswe will add exportersin the
templatesdirectory of our chart we will describe our custom resources (ConfigMaps, VMRules, Deployments for custom Exporters, etc.)
Let’s recall how it is generally doing – Helm Create, Helm: dependencies aka subcharts – обзор и пример, How to make a Helm chart in 10 minutes, One Chart to rule them all – How to implement Helm Subcharts.
But instead of helm create we’ll do the chart manually, as helm create will create too many needless files.
Create directories in our monitoring repository:
$ mkdir -p victoriametrics/{templates,charts,values}
Check the structure:
$ tree victoriametrics
victoriametrics
├── charts
├── templates
└── values
Go to the victoriametrics directory and create a Chart.yaml file:
apiVersion: v2
name: atlas-victoriametrics
description: A Helm chart for Atlas Victoria Metrics kubernetes monitoring stack
type: application
version: 0.1.0
appVersion: "1.16.0"
Adding subcharts
Now it’s time to add dependencies, start with the victoria-metrics-k8s-stack.
Versions have already been found, let’s remember which was the last one:
$ helm search repo vm/victoria-metrics-k8s-stack -l
NAME                            CHART VERSION   APP VERSION     DESCRIPTION
vm/victoria-metrics-k8s-stack   0.17.0          v1.91.3         Kubernetes monitoring on VictoriaMetrics stack....
vm/victoria-metrics-k8s-stack   0.16.4          v1.91.3         Kubernetes monitoring on VictoriaMetrics stack....
...
Add with ~ to the version number to include patches up to version 0.17 (see Dependencies):
apiVersion: v2
name: atlas-victoriametrics
description: A Helm chart for Atlas Victoria Metrics kubernetes monitoring stack
type: application
version: 0.1.0
appVersion: "1.16.0"
dependencies:
- name: victoria-metrics-k8s-stack
  version: ~0.17.0
  repository: https://victoriametrics.github.io/helm-charts/
Add values.yaml for subcharts
Next, create directories for values:
$ mkdir -p values/{dev,prod}
Copy our minimal config to the values/dev/:
$ cp ../atlas-monitoring-dev-values.yaml values/dev/
Then we will export all the general parameters in some common-values.yaml, and the values that will be different for Dev/Prod – in separate files.
Update our values - add a victoria-metrics-k8s-stack block, because now it will be our subchart:
victoria-metrics-k8s-stack:
  # no need yet
  victoria-metrics-operator:
    serviceAccount:
      create: true
  # to confugire later
  alertmanager:
    enabled: true
  # to confugire later
  vmalert:
    annotations: {}
    enabled: true
  # to confugire later
  vmagent:
    enabled: true
  grafana:
    enabled: true
    ingress:
      enabled: true
      annotations:
        kubernetes.io/ingress.class: alb
        alb.ingress.kubernetes.io/target-type: ip
        alb.ingress.kubernetes.io/scheme: internet-facing
      hosts:
        - monitoring.dev.example.co
Download charts from the dependencies:
$ helm dependency update
Check the content of the charts directory:
$ ls -1 charts/
victoria-metrics-k8s-stack-0.17.0.tgz
And run helm template for the new Helm chart with our VictoriaMetrics Stack to check that the chart itself, its dependencies and values are working:
$ helm template . -f values/dev/atlas-monitoring-dev-values.yaml
---
Source: victoriametrics/charts/victoria-metrics-k8s-stack/charts/grafana/templates/serviceaccount.yaml
apiVersion: v1
kind: ServiceAccount
metadata:
labels:
helm.sh/chart: grafana-6.44.11
app.kubernetes.io/name: grafana
app.kubernetes.io/instance: release-name
...
Looks OK – let’s try to deploy.
Delete the old release:
$ helm -n dev-monitoring-ns uninstall victoria-metrics-k8s-stack
release "victoria-metrics-k8s-stack" uninstalled
Service Invalid value: must be no more than 63 characters
Deploy a new release, and:
$ helm -n dev-monitoring-ns upgrade --install atlas-victoriametrics . -f values/dev/atlas-monitoring-dev-values.yaml
Release "atlas-victoriametrics" does not exist. Installing it now.
Error: 10 errors occurred:
* Service "atlas-victoriametrics-victoria-metrics-k8s-stack-kube-controlle" is invalid: metadata.labels: Invalid value: "atlas-victoriametrics-victoria-metrics-k8s-stack-kube-controller-manager": must be no more than 63 characters
Check the length of the name:
$ echo atlas-victoriametrics-victoria-metrics-k8s-stack-kube-controller-manager | wc -c
73
To solve this, add fullnameOverride to the values a shortened name:
victoria-metrics-k8s-stack:
  fullnameOverride: "vm-k8s-stack"
  ...
Deploy again:
$ helm -n dev-monitoring-ns upgrade --install atlas-victoriametrics . -f values/dev/atlas-monitoring-dev-values.yaml
Release "atlas-victoriametrics" has been upgraded. Happy Helming!
...
Check resources:
$ kk -n dev-monitoring-ns get all
NAME                                                      TYPE        CLUSTER-IP       EXTERNAL-IP   PORT(S)            AGE
service/atlas-victoriametrics-grafana                     ClusterIP   172.20.93.0              80/TCP             0s
service/atlas-victoriametrics-kube-state-metrics          ClusterIP   172.20.113.37            8080/TCP           0s
...
Looks like everything is fine here – let’s add exporters
Prometheus CloudWatch Exporter subchart
To authenticate exports to AWS, we will use IRSA, described in the AWS: CDK and Python – configure an IAM OIDC Provider, and install Kubernetes Controllers post.
So let’s assume that the IAM Role for the exporter already exists – we just need to install the prometheus-cloudwatch-exporter Helm chart and specify the ARN of the IAM role.
Check the chart’s available versions:
$ helm repo add prometheus-community https://prometheus-community.github.io/helm-charts
$ helm search repo prometheus-community/prometheus-cloudwatch-exporter
NAME                                                    CHART VERSION   APP VERSION     DESCRIPTION
prometheus-community/prometheus-cloudwatch-expo...      0.25.1          0.15.4          A Helm chart for prometheus cloudwatch-exporter
Add it to the dependencies of our Chart.yaml:
...
dependencies:
- name: victoria-metrics-k8s-stack
  version: ~0.17.0
  repository: https://victoriametrics.github.io/helm-charts/
- name: prometheus-cloudwatch-exporter
  version: ~0.25.1
  repository: https://prometheus-community.github.io/helm-charts
In the values/dev/atlas-monitoring-dev-values.yaml file add a prometheus-cloudwatch-exporter.serviceAccount.annotations parameter with the ARN of our IAM role, and a config block with the metrics that we will collect:
prometheus-cloudwatch-exporter:
  serviceAccount:
    annotations:
      eks.amazonaws.com/role-arn: arn:aws:iam::492***148:role/atlas-monitoring-dev-CloudwatchExporterRole0613A27-EU5LW9XRWVRL
  config: |-
    region: us-east-1
    metrics:

    - aws_namespace: AWS/Events
      aws_metric_name: FailedInvocations
      aws_dimensions: [RuleName]
      aws_statistics: [Sum, SampleCount]

    - aws_namespace: AWS/Events
      aws_metric_name: Invocations
      aws_dimensions: [EventBusName, RuleName]
      aws_statistics: [Sum, SampleCount]
Although if the config is large, it is probably better to do it by creating your own ConfigMap for the exporter.
Update the dependencies:
$ helm dependency update
Deploy:
$ helm -n dev-monitoring-ns upgrade --install atlas-victoriametrics . -f values/dev/atlas-monitoring-dev-values.yaml
Check the Pod:
$ kk -n dev-monitoring-ns get pod | grep cloud
atlas-victoriametrics-prometheus-cloudwatch-exporter-564ccfjm9j   1/1     Running   0          53s
And corresponding ServiceAccount:
$ kk -n dev-monitoring-ns get pod atlas-victoriametrics-prometheus-cloudwatch-exporter-64b6f6b9rv -o yaml
...
- name: AWS_ROLE_ARN
value: arn:aws:iam::492***148:role/atlas-monitoring-dev-CloudwatchExporterRole0613A27-EU5LW9XRWVRL
- name: AWS_WEB_IDENTITY_TOKEN_FILE
value: /var/run/secrets/eks.amazonaws.com/serviceaccount/token
...
Run port-forward:
$ kk -n dev-monitoring-ns port-forward svc/atlas-victoriametrics-prometheus-cloudwatch-exporter 9106
And let’s see if we have metrics there:
$ curl -s localhost:9106/metrics | grep aws_
HELP aws_events_invocations_sum CloudWatch metric AWS/Events Invocations Dimensions: [EventBusName, RuleName] Statistic: Sum Unit: Count
TYPE aws_events_invocations_sum gauge
aws_events_invocations_sum{job="aws_events",instance="",event_bus_name="***-staging",rule_name="***_WsConnectionEstablished-staging",} 2.0 1689598980000
aws_events_invocations_sum{job="aws_events",instance="",event_bus_name="***-prod",rule_name="***_ReminderTimeReached-prod",} 2.0 1689598740000
aws_events_invocations_sum{job="aws_events",instance="",event_bus_name="***-prod",rule_name="***_PushNotificationEvent-prod",} 2.0 1689598740000
Great.
Now, we need to configure VMAgent to start collecting these metrics from this exporter.
Collecting metrics from exporters: VMAgent && scrape_configs
The usual for the Kube Prometheus Stack way is to simply set the servicemonitor.enabled=true in an exporter’s Helm chart values, and Prometheus Operator will create a ServiceMonitor to start collecting metrics.
However, this won’t work with VictoriaMetrics because ServiceMonitor CRD is a part of the kube-prometheus-stack, and the ServiceMonitor resource simply won’t be created.
Instead, VictoriaMetrics has its own counterpart – VMServiceScrape, which can be created from a manifest where we can configure an endpoint to collect metrics. In addition, VictoriaMetrics can create a VMServiceScrape resoucres from existing ServiceMonitors, but this requires the installation of the ServiceMonitor CRD itself.
We can also pass a list of targets with the inlineScrapeConfig or additionalScrapeConfigs, see VMAgentSpec.
Most likely, I’ll use the inlineScrapeConfig for now, because our config is not too big.
It is also worth taking a look at the VMAgent’s values.yaml – for example, there are default scrape_configs values.
One more nuance that should be kept in mind – VMAgent does not check target configurations, i.e. if there is an error in YAML – then VMAgent simply ignores the changes and does not reload the file, and will not write anything to the log.
VMServiceScrape
First, let’s create a VMServiceScrape manually to see how it works.
Check the labels in the CloudWatch Exporter Service:
$ kk -n dev-monitoring-ns describe svc atlas-victoriametrics-prometheus-cloudwatch-exporter
Name:              atlas-victoriametrics-prometheus-cloudwatch-exporter
Namespace:         dev-monitoring-ns
Labels:            app=prometheus-cloudwatch-exporter
app.kubernetes.io/managed-by=Helm
chart=prometheus-cloudwatch-exporter-0.25.1
heritage=Helm
release=atlas-victoriametrics
...
Describe the VMServiceScrape with the matchLabels where we specify the labels of the CloudWatch exporter’s Service:
apiVersion: operator.victoriametrics.com/v1beta1
kind: VMServiceScrape
metadata:
  name: prometheus-cloudwatch-exporter-vm-scrape
  namespace: dev-monitoring-ns
spec:
  selector:
    matchLabels:
      app: prometheus-cloudwatch-exporter
  endpoints:
  - port: http
Deploy:
$ kubectl apply -f vmsvcscrape.yaml
vmservicescrape.operator.victoriametrics.com/prometheus-cloudwatch-exporter-vm-scrape created
Check the vmservicescrape resources – there is already a bunch of default ones created by the VictoriaMetrics Operator:
$ kk -n dev-monitoring-ns get vmservicescrape
NAME                                       AGE
prometheus-cloudwatch-exporter-vm-scrape   6m45s
vm-k8s-stack-apiserver                     4d22h
vm-k8s-stack-coredns                       4d22h
vm-k8s-stack-grafana                       4d22h
vm-k8s-stack-kube-controller-manager       4d22h
...
The VMAgent config is created in the Pod in the file /etc/vmagent/config_out/vmagent.env.yaml.
Let’s see if our CloudWatch Exporter has been added there:
$ kk -n dev-monitoring-ns exec -ti vmagent-vm-k8s-stack-98d7678d4-cn8qd -c vmagent -- cat /etc/vmagent/config_out/vmagent.env.yaml
global:
scrape_interval: 25s
external_labels:
cluster: eks-dev-1-26-cluster
prometheus: dev-monitoring-ns/vm-k8s-stack
scrape_configs:
- job_name: serviceScrape/dev-monitoring-ns/prometheus-cloudwatch-exporter-vm-scrape/0
honor_labels: false
kubernetes_sd_configs:
- role: endpoints
namespaces:
names:
- dev-monitoring-ns
...
And now we must have the metrics in VictoriaMetrics itself.
Open a port:
$ kk -n dev-monitoring-ns port-forward svc/vmsingle-vm-k8s-stack 8429
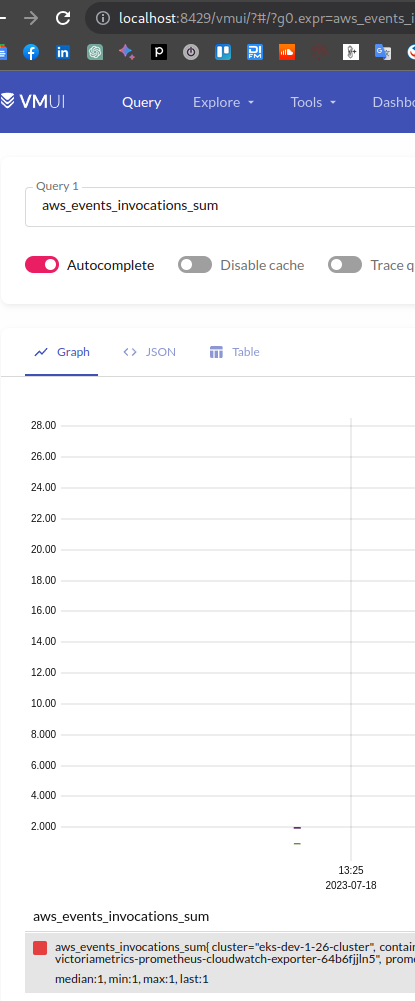
Go to the http://localhost:8429/vmui/, and to check – make a request for any metric from the CloudWatch Exporter:
Good – we saw how to manually create a VMServiceScrape. But what about automating this process? I don’t really like the idea to create a dedicated VMServiceScrape for each service through Kustomize.
VMServiceScrape from a ServiceMonitor and VictoriaMetrics Prometheus Converter
So as already mentioned, in order for the ServiceMonitor object to be created in the cluster, we need a ServiceMonitor’s Custom Resource Definition.
We can install it directly from the manifest in the repository kube-prometheus-stack:
$ kubectl apply -fhttps://raw.githubusercontent.com/prometheus-community/helm-charts/main/charts/kube-prometheus-stack/charts/crds/crds/crd-servicemonitors.yaml
customresourcedefinition.apiextensions.k8s.io/servicemonitors.monitoring.coreos.com created
Then updatevalues – add the serviceMonitorenabled=true:
...
prometheus-cloudwatch-exporter:
  serviceAccount:
    annotations:
      eks.amazonaws.com/role-arn: arn:aws:iam::492***148:role/atlas-monitoring-dev-CloudwatchExporterRole0613A27-EU5LW9XRWVRL
      eks.amazonaws.com/sts-regional-endpoints: "true"
  serviceMonitor:
    enabled: true
...
And in the victoria-metrics-k8s-stack values, add the operator.disable_prometheus_converter=false parameter:
victoria-metrics-k8s-stack:
  fullnameOverride: "vm-k8s-stack"
  # no need yet
  victoria-metrics-operator:
    serviceAccount:
      create: true
    operator:
      disable_prometheus_converter: false
...
Deploy and check whether a servicemonitor was created:
$ kk -n dev-monitoring-ns get servicemonitors
NAME                                                   AGE
atlas-victoriametrics-prometheus-cloudwatch-exporter   2m22s
And we have to have a vmservicescrape created automatically:
$ kk -n dev-monitoring-ns get vmservicescrape
NAME                                                   AGE
atlas-victoriametrics-prometheus-cloudwatch-exporter   2m11s
...
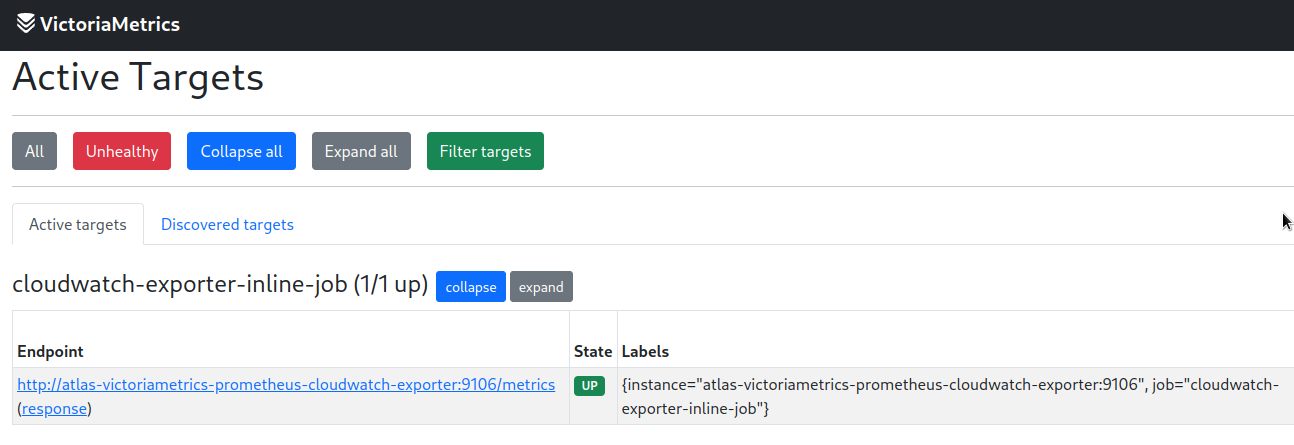
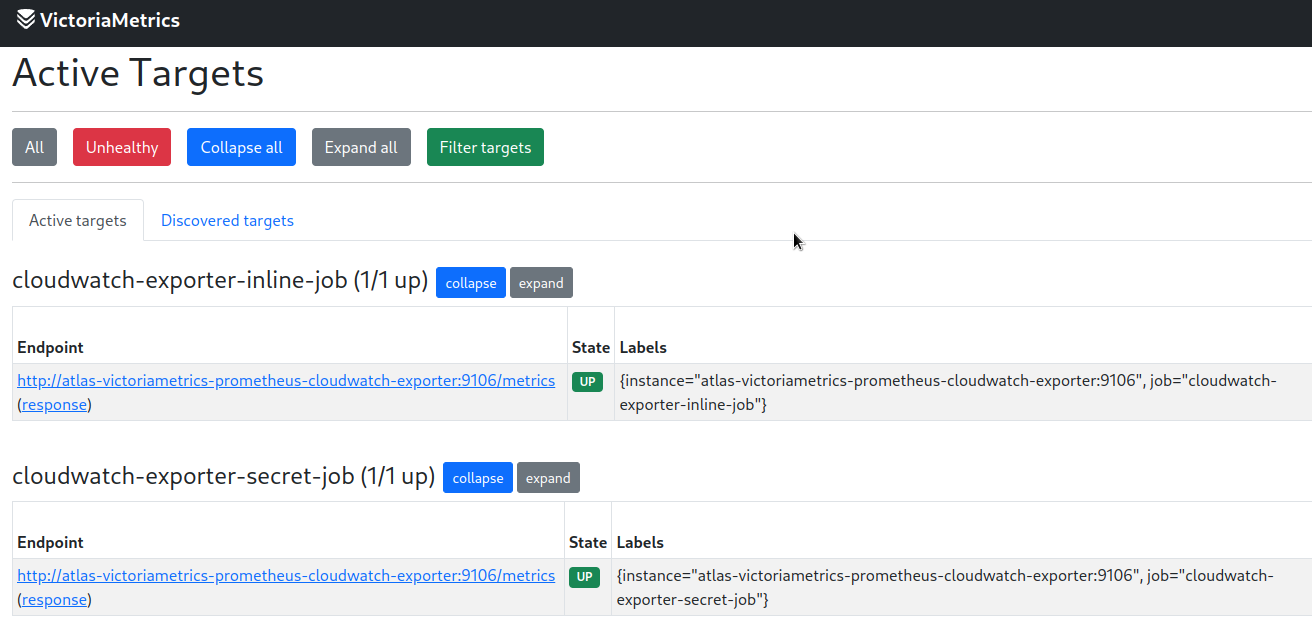
Check the targets:
Everything is there.
The only nuance here is that when a ServiceMonitor is deleted, the corresponding one vmservicescrape will remain in the cluster. Also, the need to install a third-party CRD, which will have to be somehow updated over time, preferably automatically.
inlineScrapeConfig
Probably the simplest option is to describe a config using inlineScrapeConfig directly in the values of our chart:
...
  vmagent:
    enabled: true
    spec:
      externalLabels:
        cluster: "eks-dev-1-26-cluster"
      inlineScrapeConfig: |
        - job_name: cloudwatch-exporter-inline-job
          metrics_path: /metrics
          static_configs:
            - targets: ["atlas-victoriametrics-prometheus-cloudwatch-exporter:9106"]
...
Deploy and check the vmagent:
$ kk -n dev-monitoring-ns get vmagent -o yaml
apiVersion: v1
items:
- apiVersion: operator.victoriametrics.com/v1beta1
kind: VMAgent
...
inlineScrapeConfig: |
- job_name: cloudwatch-exporter-inline-job
metrics_path: /metrics
static_configs:
- targets: ["atlas-victoriametrics-prometheus-cloudwatch-exporter:9106"]
...
Let’s look at the targets again:
additionalScrapeConfigs
A more secure way if there are any access tokens/keys in the parameters, but requires a separate Kubernetes Secret object to be created.
Actually, it is not a problem, because we will have to have additional ConfigMaps/Secrets anyway, and I’ll want to export the config of targets in a separate file most likely I will convert it to the additionalScrapeConfigs.
Now we will create it manually, just to see how it will work. Take an example directly from the documentation:
apiVersion: v1
kind: Secret
metadata:
  name: additional-scrape-configs
stringData:
  prometheus-additional.yaml: |
    - job_name: cloudwatch-exporter-secret-job
      metrics_path: /metrics
      static_configs:
      - targets: ["atlas-victoriametrics-prometheus-cloudwatch-exporter:9106"]
Do not forget to deploy it :-)
$ kubectl -n dev-monitoring-ns apply -f vmagent-targets-secret.yaml
secret/additional-scrape-configs created
Update the VMAgent values - add the additionalScrapeConfigs block:
...
  vmagent:
    enabled: true
    spec:
      externalLabels:
        cluster: "eks-dev-1-26-cluster"
      additionalScrapeConfigs:
        name: additional-scrape-configs
        key: prometheus-additional.yaml
      inlineScrapeConfig: |
        - job_name: cloudwatch-exporter-inline-job
          metrics_path: /metrics
          static_configs:
            - targets: ["atlas-victoriametrics-prometheus-cloudwatch-exporter:9106"]
...
Update the deployment and check the targets:
Now that we have the metrics, we can move on to the Grafana.
Grafana provisioning
What do we need for Grafana? Plugins, plugins, data sources, and dashboards.
First, let’s add Data Sources, see the documentation.
Adding Data Sources && Plugins
If everything is more or less simple with dashboards, then with Data Sources there is a question: how to transfer some secrets to them? For example, for the Sentry data source, we need to set a token, which I do not want to show in the values of the chart because we do not encrypt the data in GitHub, even though the repositories are private (check the git-crypt if you thinking about encrypting data in a Git repository).
Let’s first see how it works in general, then will think about how to transfer the token to us.
We will add a Sentry Data Source, see grafana-sentry-datasource. We already have a token created in sentry.io \> User settings > User Auth Tokens.
In the Grafana values, we’ll add the plugins where we set the name of the plugin grafana-sentry-datasource (the value of the type field from the documentation above), and describe the additionalDataSources block with the secureJsonData field with the token itself:
...
  grafana:
    enabled: true
    ingress:
      enabled: true
      annotations:
        kubernetes.io/ingress.class: alb
        alb.ingress.kubernetes.io/target-type: ip
        alb.ingress.kubernetes.io/scheme: internet-facing
      hosts:
        - monitoring.dev.example.co
    plugins:
      - grafana-sentry-datasource
    additionalDataSources:
      - name: Sentry
        type: grafana-sentry-datasource
        access: proxy
        orgId: 1
        version: 1
        editable: true
        jsonData:
          url: https://sentry.io
          orgSlug: ***
        secureJsonData:
          authToken: 974***56b
...
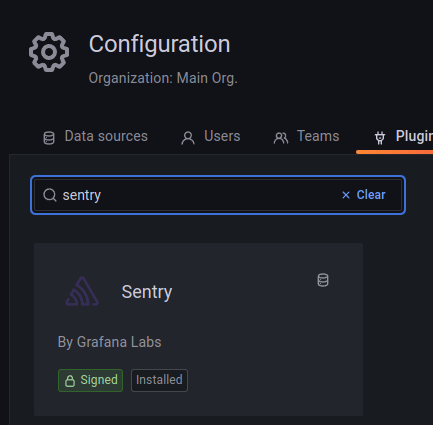
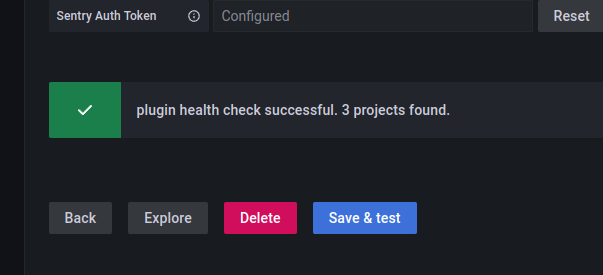
Deploy, and check the plugin:
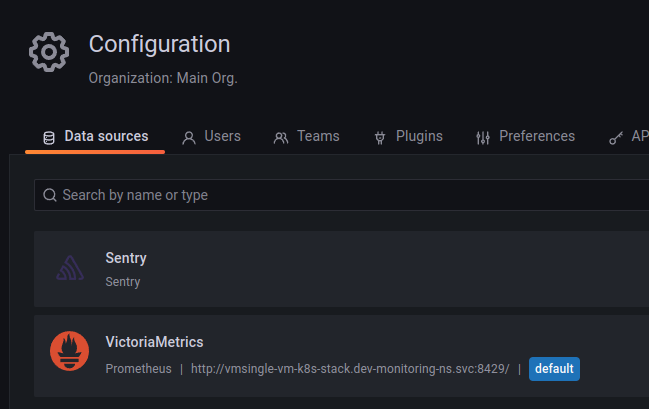
And the Data Source:
Okay, it works.
A Token for a Data Source with the envFromSecret
Now let’s try to use a variable with a value from a Kubernetes Secret taken by the envFromSecret.
Create a Secret:
---
apiVersion: v1
kind: Secret
metadata:
  name: grafana-datasource-sentry-token
stringData:
  SENTRY_TOKEN: 974***56b
Update the Grafana values - add the envFromSecret to set the $SENTRY_TOKEN variable, and then use it in the additionalDataSources:
...
  grafana:
    ...
    envFromSecret: grafana-datasource-sentry-token
    additionalDataSources:
      - name: Sentry
        type: grafana-sentry-datasource
        access: proxy
        orgId: 1
        version: 1
        editable: true
        jsonData:
          url: https://sentry.io
          orgSlug: ***
        secureJsonData:
          authToken: ${SENTRY_TOKEN}
...
Deploy and check the variable in the Grafana’s Pod:
$ kk -n dev-monitoring-ns exec -ti atlas-victoriametrics-grafana-64d9db677-g7l25 -c grafana -- printenv | grep SENTRY_TOKEN
SENTRY_TOKEN=974***56b
Check the config of the data sources:
$ kk -n dev-monitoring-ns exec -ti atlas-victoriametrics-grafana-64d9db677-bpkw8 -c grafana -- cat /etc/grafana/provisioning/datasources/datasource.yaml
...
apiVersion: 1
datasources:
- name: VictoriaMetrics
type: prometheus
url: http://vmsingle-vm-k8s-stack.dev-monitoring-ns.svc:8429/
access: proxy
isDefault: true
jsonData:
{}
- access: proxy
editable: true
jsonData:
orgSlug: ***
url: https://sentry.io
name: Sentry
orgId: 1
secureJsonData:
authToken: ${SENTRY_TOKEN}
type: grafana-sentry-datasource
version: 1
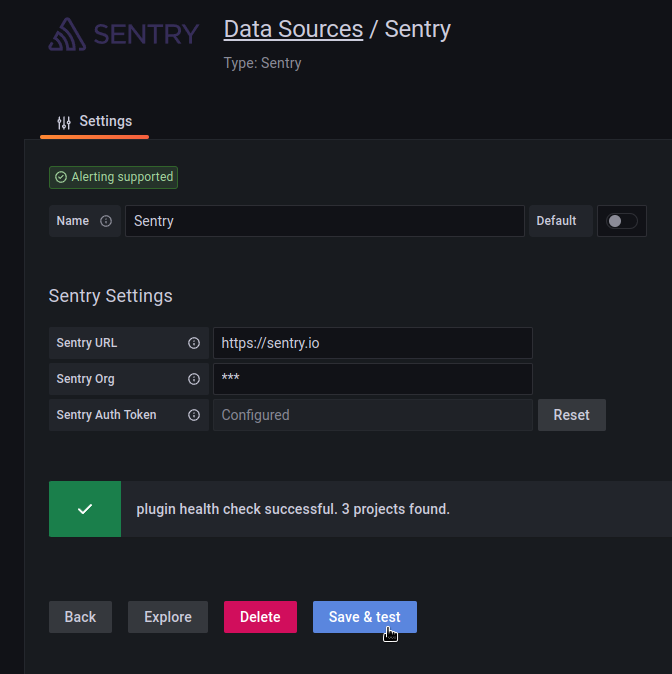
And again check the Data Source:
So with this approach, we can use the AWS Secrets and Configuration Provider (ASCP) (see AWS: Kubernetes – AWS Secrets Manager and Parameter Store Integration ):
create a secret variable
$SECRET_NAME_VARin the GitHub Actions Secretsduring AWS CDK deployment, take the value into a variable with the
os.env("SECRET_NAME_VAR"), and create a secret in the AWS Secrets Managerin our chart’s
templatesdirectory, we can createSecretProviderClasswith a fieldsecretObjects.secretNameto create a Kubernetes Secret
And when Grafana’s Pod will be created, it will connect this Secret to the Pod:
kk -n dev-monitoring-ns get pod atlas-victoriametrics-grafana-64d9db677-dlqfr -o yaml
...
envFrom:
- secretRef:
name: grafana-datasource-sentry-token
...
And will pass the value to the Grafana itself.
Okay, this might work, although it looks a bit confusing.
But there is another option – with the sidecar.datasources.
A Kubernetes Secret with a Data Source with sidecar.datasources
There is a second option – to configure data sources through a sidecar container: we can create a Kubernetes Secret with the specific labels, and add a data source to this secret. See Sidecar for datasources.
And that’s a pretty nice idea: create a manifest with a Kubernetes Secret in the templates directory, and transfer a value with the --set during helm install in GitHub Actions with a value from GitHub Actions Secrets. And it looks simpler. Let’s try.
Describe a Kubernetes Secret in the templates/grafana-datasources-secret.yaml file:
apiVersion: v1
kind: Secret
metadata:
  name: grafana-datasources
  labels:
    grafana_datasource: 'true'
stringData:
  sentry.yaml: |-
    apiVersion: 1
    datasources:
      - name: Sentry
        type: grafana-sentry-datasource
        access: proxy
        orgId: 1
        version: 1
        editable: true
        jsonData:
          url: https://sentry.io
          orgSlug: ***
        secureJsonData:
          authToken: {{ .Values.grafana.sentry_token }}
Deploy it with --set grafana.sentry_token=TOKEN:
$ helm -n dev-monitoring-ns upgrade --install atlas-victoriametrics . -f values/dev/atlas-monitoring-dev-values.yaml --set grafana.sentry_token="974***56b"
Check the configuration of data sources in the Grafana Pod:
$ kk -n dev-monitoring-ns exec -ti atlas-victoriametrics-grafana-5967b494f6-5zmjb -c grafana -- ls -l /etc/grafana/provisioning/datasources
total 8
-rw-r--r--    1 grafana  472            187 Jul 19 13:36 datasource.yaml
-rw-r--r--    1 grafana  472            320 Jul 19 13:36 sentry.yaml
And the sentry.yaml file’s content:
$ kk -n dev-monitoring-ns exec -ti atlas-victoriametrics-grafana-5967b494f6-5zmjb -c grafana -- cat /etc/grafana/provisioning/datasources/sentry.yaml
apiVersion: 1
datasources:
- name: Sentry
type: grafana-sentry-datasource
access: proxy
orgId: 1
version: 1
editable: true
jsonData:
url: https://sentry.io
orgSlug: ***
secureJsonData:
authToken: 974***56b
And once again the data source in the Grafana itself:
It’s a magic!
Adding Dashboards
So we already have Grafana in our PoC monitoring, and there are dashboards that we need to move to the new monitoring stack and deploy from the GitHub repository.
Documentation on importing dashboards – Import dashboards.
To create a dashboard through the Helm chart, we have a sidecar container grafana-sc-dashboard similar to the grafana-sc-datasources which will check all ConfigMaps with a specific label, and will connect them to the Pod. See Sidecar for dashboards.
Keep in mind the recommendation:
A recommendation is to use one configmap per dashboard, as a reduction of multiple dashboards inside one configmap is currently not properly mirrored in grafana.
That is, one ConfigMap for each dashboard.
So what we need to do is describe a ConfigMap for each dashboard, and Grafana will add them to the /tmp/dashboards.
Export of existing dashboard and the “Data Source UID not found” error
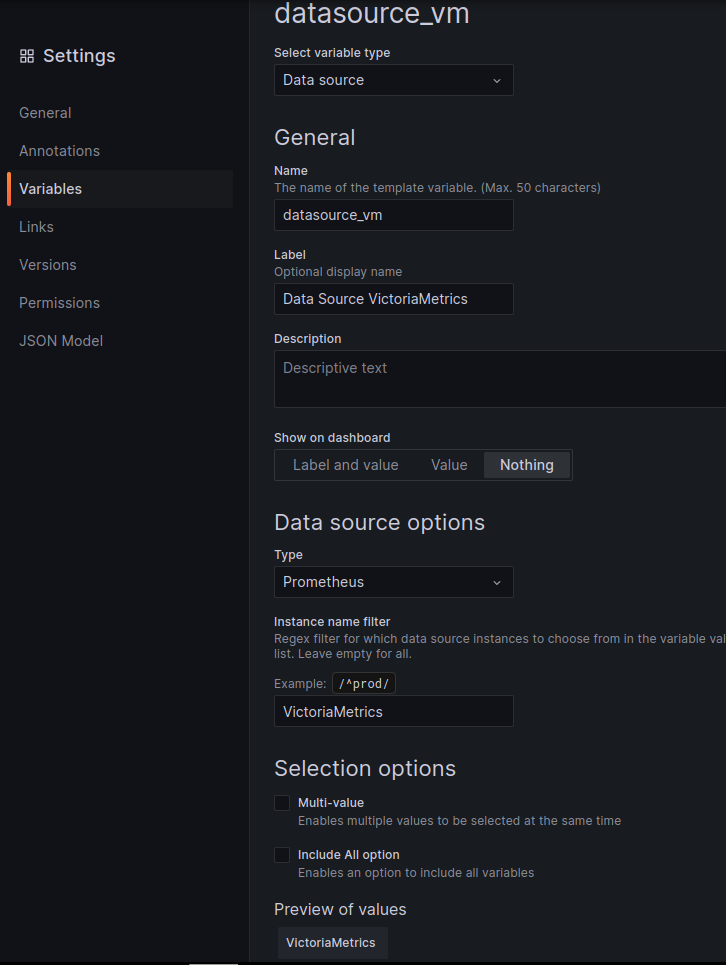
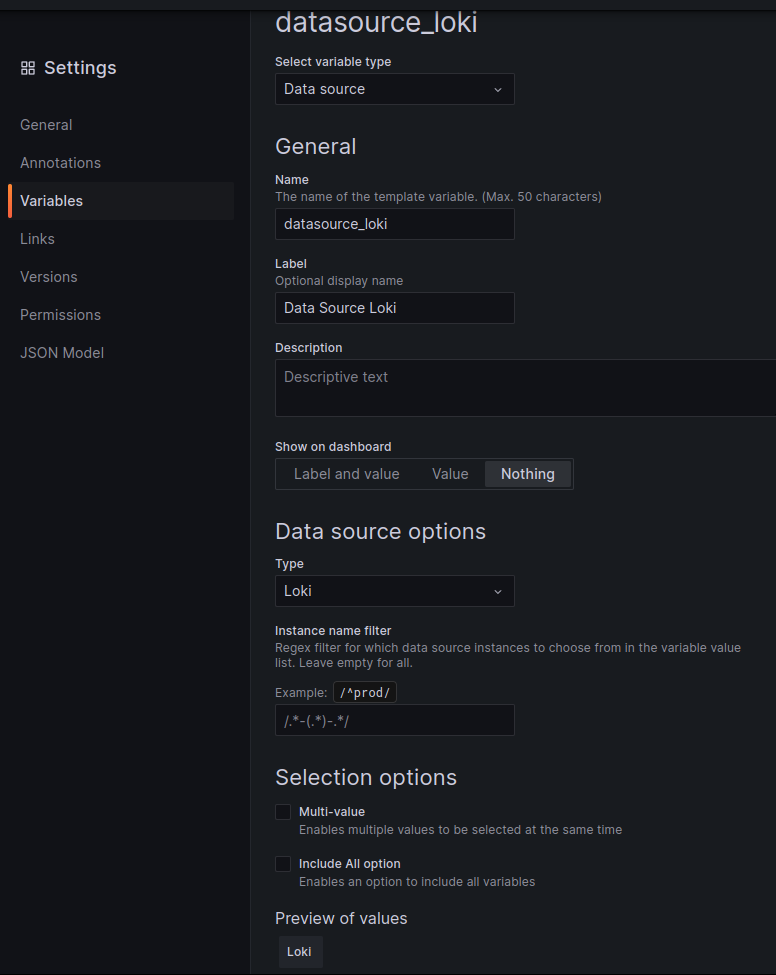
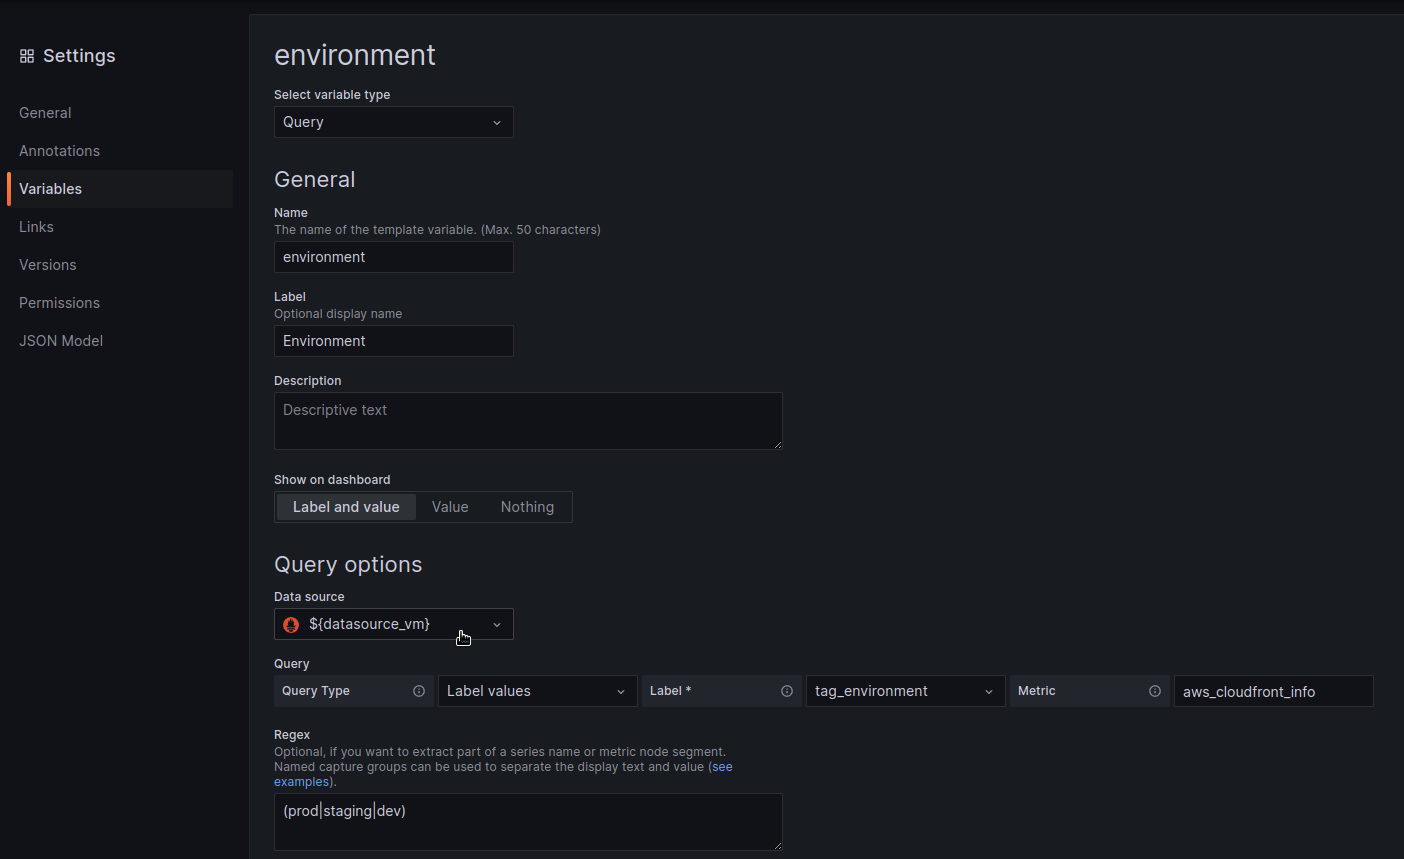
To avoid an error with the UID (“Failed to retrieve datasource Datasource f0f2c234-f0e6-4b6c-8ed1-01813daa84c9 was not found”) – go to the dashboard in the existing Grafana instance and add a new variable with the Data Source type:
Repeat for Loki, Sentry:
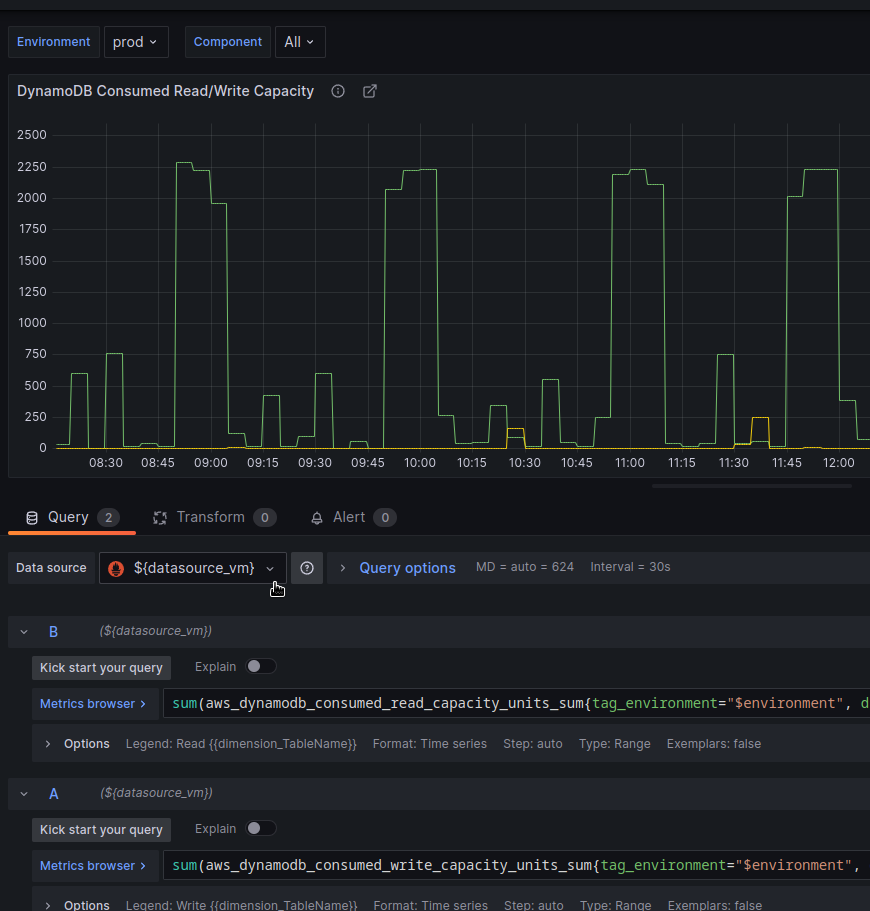
And update the panels – set a data source from the variable:
Repeat the same for all queries in the Annotations and Variables:
Create a directory for the files that will keep files to import into Kubernetes:
$ mkdir -p grafana/dashboards/
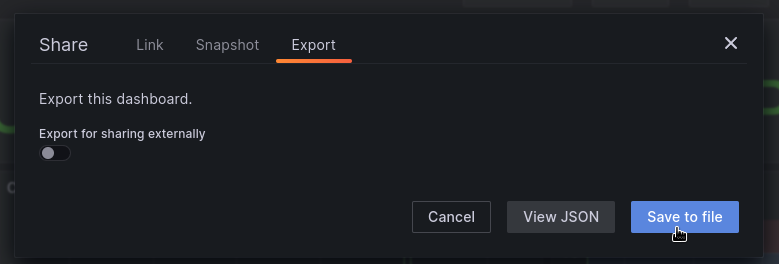
And export a dashboard in JSON and save as grafana/dashboards/overview.json:
Dashboard ConfigMap
In the templates directory, create a manifest for the ConfigMap:
apiVersion: v1
kind: ConfigMap
metadata:
  name: overview-dashboard
  labels:
    grafana_dashboard: "1"
data:
  overview.json: |
{{ .Files.Get "grafana/dashboards/overview.json" | indent 4 }}
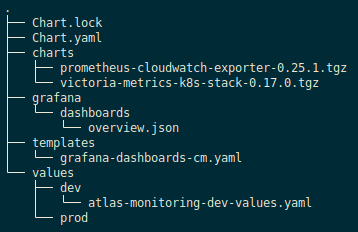
Now all the files of our project look like this:
Deploy the chart and check the ConfigMap:
$ kk -n dev-monitoring-ns get cm overview-dashboard -o yaml | head
apiVersion: v1
data:
overview.json: |
{
"annotations": {
"list": [
{
"builtIn": 1,
"datasource": {
"type": "grafana",
And check in the Pod whether the file was added to the /tmp/dashboards:
kubectl -n dev-monitoring-ns exec -ti atlas-victoriametrics-grafana-5967b494f6-gs4jm -c grafana -- ls -l /tmp/dashboards
total 1032
...
-rw-r--r--    1 grafana  472          74821 Jul 19 10:31 overview.json
...
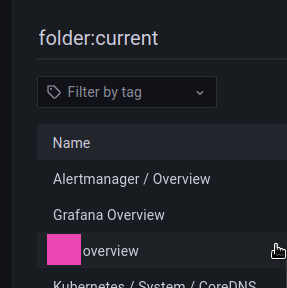
And in the Grafana itself:
And we have our graphs – not all yet, because an only one exporter has been launched:
Let’s move on.
What do we have to do else?
GitHub exporter – create a chart, add it as a dependency to the general chart (or just create a manifest with Deployment? we will have just one Pod there)
launch Loki
configure alerts
For the GitHub exporter, I’ll probably just make a Deployment manifest in templates of the main chart.
So, let’s now recall on Loki installation, because when I did it six months ago it was a bit hard. I hope I didn’t change too much, and I can just take the config from the Grafana Loki: architecture and running in Kubernetes with AWS S3 storage and boltdb-shipper post.
Running Grafana Loki with AWS S3
What do we need here?
create an S3 bucket
create an IAM Policy && IAM Role to access the bucket
create a ConfigMap with the Loki config
add the Loki chart as a subchart of our main chart
AWS CDK for S3 and IAM Role
Describe S3 and IAM, we are using AWS CDK:
...
        ##################################
        ### Grafana Loki AWS resources ###
        ##################################
        ### AWS S3 to store logs data and indexes
        loki_bucket_name = f"{environment}-grafana-loki"
        bucket = s3.Bucket(
            self, 'GrafanaLokiBucket',
            bucket_name=loki_bucket_name,
            block_public_access=s3.BlockPublicAccess.BLOCK_ALL
        )
        # Create an IAM Role to be assumed by Loki
        grafana_loki_role = iam.Role(
            self,
            'GrafanaLokiRole',
            # for Role's Trust relationships
            assumed_by=iam.FederatedPrincipal(
                federated=oidc_provider_arn,
                conditions={
                    'StringEquals': {
                        f'{oidc_provider_url.replace("https://", "")}:sub': f'system:serviceaccount:{monitoring_namespace}:loki'
                    }
                },
                assume_role_action='sts:AssumeRoleWithWebIdentity'
            )
        )
        # Attach an IAM Policies to that Role
        grafana_loki_policy = iam.PolicyStatement(
            actions=[
                "s3:ListBucket",
                "s3:PutObject",
                "s3:GetObject",
                "s3:DeleteObject"
            ],
            resources=[
                f"arn:aws:s3:::{loki_bucket_name}",
                f"arn:aws:s3:::{loki_bucket_name}/*"
            ]
        )
        grafana_loki_role.add_to_policy(grafana_loki_policy)
...
        CfnOutput(
            self,
            'GrafanaLokiRoleArn',
            value=grafana_loki_role.role_arn
        )
...
Deploy it:
$ cdk deploy atlas-monitoring-dev
...
Outputs:
atlas-monitoring-dev.CloudwatchExporterRoleArn = arn:aws:iam::492***148:role/atlas-monitoring-dev-CloudwatchExporterRole0613A27-EU5LW9XRWVRL
atlas-monitoring-dev.GrafanaLokiRoleArn = arn:aws:iam::492***148:role/atlas-monitoring-dev-GrafanaLokiRole27EECE19-1HLODQFKFLDNK
...
And now can we add a subchart.
Loki Helm chart installation
Add the repository, find a latest version of the chart:
$ helm repo add grafana https://grafana.github.io/helm-charts

$ helm search repo grafana/loki
NAME                            CHART VERSION   APP VERSION     DESCRIPTION
grafana/loki                    5.8.9           2.8.2           Helm chart for Grafana Loki in simple, scalable...
grafana/loki-canary             0.12.0          2.8.2           Helm chart for Grafana Loki Canary
grafana/loki-distributed        0.69.16         2.8.2           Helm chart for Grafana Loki in microservices mode
grafana/loki-simple-scalable    1.8.11          2.6.1           Helm chart for Grafana Loki in simple, scalable...
grafana/loki-stack              2.9.10          v2.6.1          Loki: like Prometheus, but for logs.
Here again a bunch of charts:
loki-canary: a system to check Loki workloki-distributed: Loki in the microservice modesimple-scalable: deprecated, it’s thelokiloki-stack: all together – Grafana, Promtail, etc
We will use the grafana/loki 5.8.9.
Add depending to our chart in the Chart.yaml:
apiVersion: v2
name: atlas-victoriametrics
description: A Helm chart for Atlas Victoria Metrics kubernetes monitoring stack
type: application
version: 0.1.0
appVersion: "1.16.0"
dependencies:
- name: victoria-metrics-k8s-stack
  version: ~0.17.0
  repository: https://victoriametrics.github.io/helm-charts/
- name: prometheus-cloudwatch-exporter
  version: ~0.25.1
  repository: https://prometheus-community.github.io/helm-charts
- name: loki
  version: ~5.8.9
  repository: https://grafana.github.io/helm-charts
All default values are here>>>, I took them from my old config – everything worked:
...
loki:
  loki:
    auth_enabled: false
    commonConfig:
      path_prefix: /var/loki
      replication_factor: 1
    storage:
      bucketNames:
        chunks: dev-grafana-loki
      type: s3
    schema_config:
      configs:
      - from: "2023-07-20"
        index:
          period: 24h
          prefix: loki_index_
        store: boltdb-shipper
        object_store: s3
        schema: v12

    storage_config:
      aws:
        s3: s3://us-east-1/dev-grafana-loki
        insecure: false
        s3forcepathstyle: true
      boltdb_shipper:
        active_index_directory: /var/loki/index
        shared_store: s3
    rulerConfig:
      storage:
        type: local
        local:
          directory: /var/loki/rules
  serviceAccount:
    create: true
    annotations:
      eks.amazonaws.com/role-arn: "arn:aws:iam::492***148:role/atlas-monitoring-dev-GrafanaLokiRole27EECE19-1HLODQFKFLDNK"
  write:
    replicas: 1

  read:
    replicas: 1
  backend:
    replicas: 1
  test:
    enabled: false
  monitoring:
    dashboards:
      enabled: false
    rules:
      enabled: false
    alerts:
      enabled: false
    serviceMonitor:
      enabled: false
    selfMonitoring:
      enabled: false
      grafanaAgent:
        installOperator: false
    lokiCanary:
      enabled: false
...
Will need to add Loki alerts, but will do it another time (see Grafana Loki: alerts from the Loki Ruler and labels from logs)
Promtail Helm chart installation
Let’s run Promtail in the cluster to check Loki, and to have logs from the cluster.
Find versions of the chart:
$ helm search repo grafana/promtail -l | head
NAME                    CHART VERSION   APP VERSION     DESCRIPTION
grafana/promtail        6.11.7          2.8.2           Promtail is an agent which ships the contents o...
grafana/promtail        6.11.6          2.8.2           Promtail is an agent which ships the contents o...
grafana/promtail        6.11.5          2.8.2           Promtail is an agent which ships the contents o...
...
Add it as a subchart to the dependencies of our Chart.yaml:
apiVersion: v2
name: atlas-victoriametrics
description: A Helm chart for Atlas Victoria Metrics kubernetes monitoring stack
type: application
version: 0.1.0
appVersion: "1.16.0"
dependencies:
- name: victoria-metrics-k8s-stack
  version: ~0.17.0
  repository: https://victoriametrics.github.io/helm-charts/
- name: prometheus-cloudwatch-exporter
  version: ~0.25.1
  repository: https://prometheus-community.github.io/helm-charts
- name: loki
  version: ~5.8.9
  repository: https://grafana.github.io/helm-charts
- name: promtail
  version: ~6.11.7
  repository: https://grafana.github.io/helm-charts
Find a Service for the Loki:
$ kk -n dev-monitoring-ns get svc | grep loki-gateway
loki-gateway                                           ClusterIP   172.20.102.186           80/TCP                       160m
Add values for the Promtail with the loki.serviceName:
...
promtail:
  loki:
    serviceName: "loki-gateway"
Deploy, and check the Pods:
kk -n dev-monitoring-ns get pod | grep 'loki\|promtail'
atlas-victoriametrics-promtail-cxwpz                              0/1     Running       0          17m
atlas-victoriametrics-promtail-hv94f                              1/1     Running       0          17m
loki-backend-0                                                    0/1     Running       0          9m55s
loki-gateway-749dcc85b6-5d26n                                     1/1     Running       0          3h4m
loki-read-6cf6bc7654-df82j                                        1/1     Running       0          57s
loki-write-0                                                      0/1     Running       0          52s
Add a new Grafana Data Source via additionalDataSources (see Provision the data source ) for the Loki:
...
  grafana:
    enabled: true
    ...
    additionalDataSources:
      - name: Loki
        type: loki
        access: proxy
        url: http://loki-gateway:80
        jsonData:
          maxLines: 1000
...
Deploy, and check data sources:
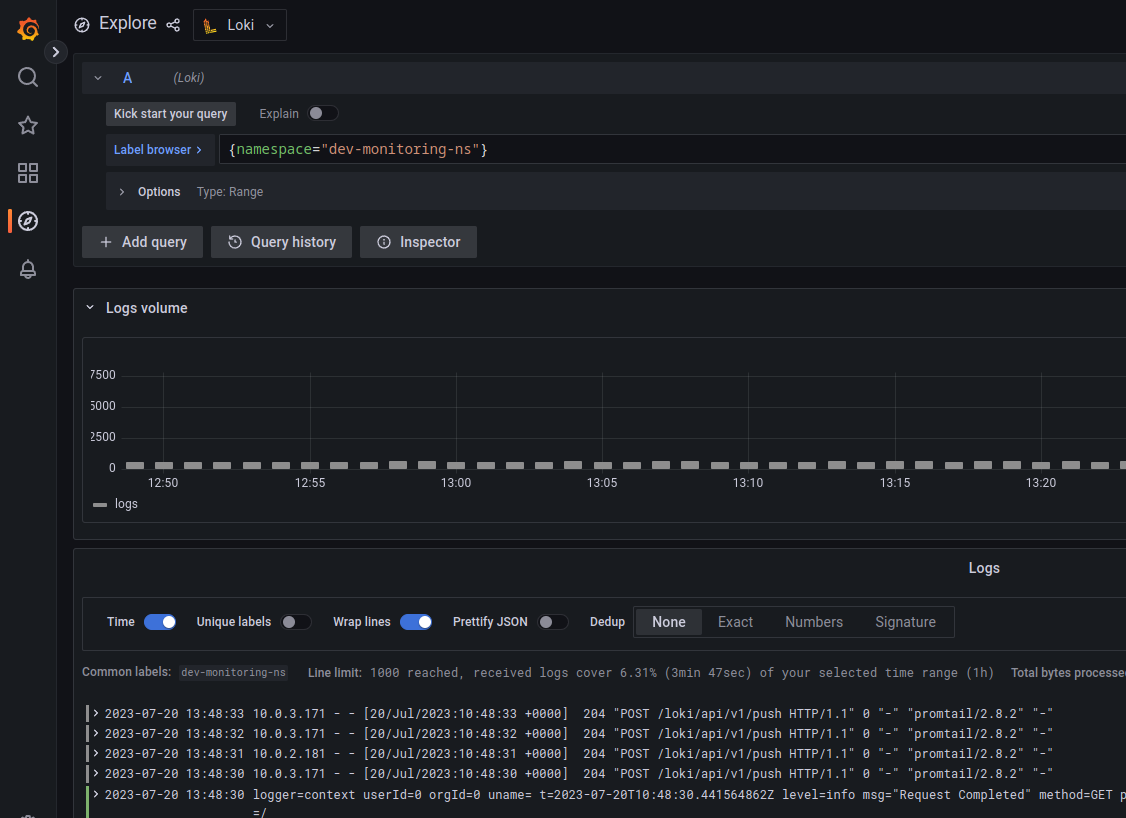
And we must see our logs in Grafana:
Now let’s see what about alerts in VictoriaMetrics.
Configuring alerts with VMAlert
We already have a VMAlert && Alertmanager Pods running from the chart described in the vmalert and alertmanager:
$ kk -n dev-monitoring-ns get pod | grep alert
vmalert-vm-k8s-stack-dff5bf755-57rxd                              2/2     Running   0          6d19h
vmalertmanager-vm-k8s-stack-0                                     2/2     Running   0          6d19h
First, let’s look at how Alertmanager is configured because alerts will be sent through it.
Alertmanager configuration
Documentation – VMAlertmanagerSpec.
Let’s find its config file:
kk -n dev-monitoring-ns describe pod vmalertmanager-vm-k8s-stack-0
...
Args:
....
--config.file=/etc/alertmanager/config/alertmanager.yaml
...
Mounts:
...
/etc/alertmanager/config from config-volume (rw)
...
Volumes:
config-volume:
Type:        Secret (a volume populated by a Secret)
SecretName:  vmalertmanager-vm-k8s-stack-config
...
That is, the /etc/alertmanager/config/alertmanager.yaml file is mounted from a Kubernetes Secret vmalertmanager-vm-k8s-stack-config:
$ kk -n dev-monitoring-ns get secret vmalertmanager-vm-k8s-stack-config -o yaml | yq '.data'
{
"alertmanager.yaml": "Z2x***GwK"
}
Check the content with base64 -d or on the website www.base64decode.org.
Now let’s add our own config.
Here, again, we will have to think about a secret, because in the slack_api_url we have a token. I think, will do the same as with the Sentry token – just pass via --set.
Update our values/dev/atlas-monitoring-dev-values.yaml:
...
  alertmanager:
    enabled: true
    config:
      global:
        resolve_timeout: 5m
        slack_api_url: ""
      route:
        repeat_interval: 12h
        group_by: ["alertname"]
        receiver: 'slack-default'
        routes: []
      receivers:
        - name: "slack-default"
          slack_configs:
            - channel: "#alerts-devops"
              send_resolved: true
              title: '{{ template "slack.monzo.title" . }}'
              icon_emoji: '{{ template "slack.monzo.icon_emoji" . }}'
              color: '{{ template "slack.monzo.color" . }}'
              text: '{{ template "slack.monzo.text" . }}'
              actions:
                # self
                - type: button
                  text: ':grafana: overview'
                  url: '{{ (index .Alerts 0).Annotations.grafana_url }}'
                - type: button
                  text: ':grafana: Loki Logs'
                  url: '{{ (index .Alerts 0).Annotations.logs_url }}'
                - type: button
                  text: ':mag: Alert query'
                  url: '{{ (index .Alerts 0).GeneratorURL }}'
                - type: button
                  text: ':aws: AWS dashboard'
                  url: '{{ (index .Alerts 0).Annotations.aws_dashboard_url }}'
                - type: button
                  text: ':aws-cloudwatch: AWS CloudWatch Metrics'
                  url: '{{ (index .Alerts 0).Annotations.aws_cloudwatch_url }}'
                - type: button
                  text: ':aws-cloudwatch: AWS CloudWatch Logs'
                  url: '{{ (index .Alerts 0).Annotations.aws_logs_url }}'
...
Although in my current monitoring I have my own nice template for Slack, for now, let’s see what this Monzo looks like.
Deploy chart with the --set victoria-metrics-k8s-stack.alertmanager.config.global.slack_api_url=$slack_url:
$ slack_url="https://hooks.slack.com/services/T02***37X"
$ helm -n dev-monitoring-ns upgrade --install atlas-victoriametrics . -f values/dev/atlas-monitoring-dev-values.yaml --set grafana.sentry_token=$sentry_token --set victoria-metrics-k8s-stack.alertmanager.config.global.slack_api_url=$slack_url --debug
And let’s check.
Find an Alertmanager Service:
kk -n dev-monitoring-ns get svc | grep alert
vmalert-vm-k8s-stack                                   ClusterIP   172.20.251.179   <none>        8080/TCP                     6d20h
vmalertmanager-vm-k8s-stack                            ClusterIP   None             <none>        9093/TCP,9094/TCP,9094/UDP   6d20h
Run port-forward:
$ kk -n dev-monitoring-ns port-forward svc/vmalertmanager-vm-k8s-stack 9093
And send an alert with cRUL:
$ curl -H 'Content-Type: application/json' -d '[{"labels":{"alertname":"testalert"}}]' http://127.0.0.1:9093/api/v1/alerts
{"status":"success"}
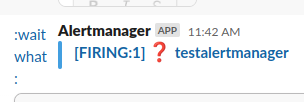
Check in the Slack:
Wait, what?)))
Okay. It works, but I don’t like these message templates for Slack, so better to take the ones I already have on the old monitoring.
Custom Slack messages template
This custom template is connected via ConfigMap vmalertmanager-vm-k8s-stack-0:
...
Volumes:
...
templates-vm-k8s-stack-alertmanager-monzo-tpl:
Type:      ConfigMap (a volume populated by a ConfigMap)
Name:      vm-k8s-stack-alertmanager-monzo-tpl
Optional:  false
...
And are enabled with the monzoTemplate.enabled=true parameter.
Let’s add a templateFiles, where we can describe our own templates:
...
  alertmanager:
    enabled: true
    monzoTemplate:
      enabled: false
    templateFiles:
      slack.tmpl: |-
        {{/* Title of the Slack alert */}}
        {{ define "slack.title" -}}
          {{ if eq .Status "firing" }} :scream: {{- else -}} :relaxed: {{- end -}}
          [{{ .Status | toUpper -}} {{- if eq .Status "firing" -}}:{{ .Alerts.Firing | len }} {{- end }}] {{ (index .Alerts 0).Annotations.summary }}
        {{ end }}

        {{ define "slack.text" -}}

            {{ range .Alerts }}
                {{- if .Annotations.description -}}
                {{- "\n\n" -}}
                *Description*: {{ .Annotations.description }}
                {{- end }}
            {{- end }}
        {{- end }}
...
Deploy and check the ConfigMap, which is described in the custom-templates.yaml:
$ kk -n dev-monitoring-ns get cm | grep extra
vm-k8s-stack-alertmanager-extra-tpl                    1      2m4s
Check volumes in the Pod:
$ kk -n dev-monitoring-ns exec -ti vmalertmanager-vm-k8s-stack-0 -- ls -l /etc/vm/templates/
Defaulted container "alertmanager" out of: alertmanager, config-reloader
total 0
drwxrwxrwx    3 root     root            78 Jul 20 10:06 vm-k8s-stack-alertmanager-extra-tpl
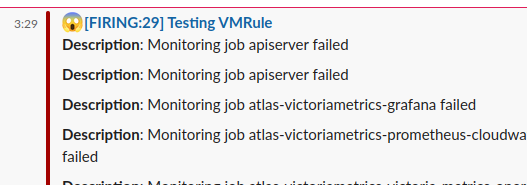
And wait for an alert:
Now everything is beautiful. Move on to create your own alerts.
VMAlert alerts with VMRules
Documentation – VMAlert.
So how to add our alerts to VMAlert?
VMAlert uses VMRules, which it selects by ruleSelector:
$ kk -n dev-monitoring-ns get vmrule
NAME                                                AGE
vm-k8s-stack-alertmanager.rules                     6d19h
vm-k8s-stack-etcd                                   6d19h
vm-k8s-stack-general.rules                          6d19h
vm-k8s-stack-k8s.rules                              6d19h
...
That is, we can describe the necessary alerts in the VMRules manifests, deploy them, and VMAlert will pick them up.
Let’s take a look at VMAlert itself – we have only one here, and it will be enough for us for now:
kk -n dev-monitoring-ns get vmalert vm-k8s-stack -o yaml
apiVersion: operator.victoriametrics.com/v1beta1
kind: VMAlert
...
spec:
datasource:
url: http://vmsingle-vm-k8s-stack.dev-monitoring-ns.svc:8429/
evaluationInterval: 15s
extraArgs:
remoteWrite.disablePathAppend: "true"
image:
tag: v1.91.3
notifiers:
- url: http://vmalertmanager-vm-k8s-stack.dev-monitoring-ns.svc:9093
remoteRead:
url: http://vmsingle-vm-k8s-stack.dev-monitoring-ns.svc:8429/
remoteWrite:
url: http://vmsingle-vm-k8s-stack.dev-monitoring-ns.svc:8429/api/v1/write
resources: {}
selectAllByDefault: true
Let’s try to add a test alert – create a victoriametrics/templates/vmalert-vmrules-test.yaml file with the kind: VMRule:
apiVersion: operator.victoriametrics.com/v1beta1
kind: VMRule
metadata:
  name: vmrule-test
  # no need now, as we have one VMAlert with selectAllByDefault
  #labels:
  #    project: devops
spec:
  groups:
    - name: testing-rule
      rules:
        - alert: TestAlert
          expr: up == 1
          for: 1s
          labels:
            severity: test
            job:  '{{ "{{" }} $labels.job }}'
            summary: Testing VMRule
          annotations:
            value: 'Value: {{ "{{" }} $value }}'
            description: 'Monitoring job {{ "{{" }} $labels.job }} failed'
Here we add a crutch in the form of "{{" }} because {{ }} is used both by Helm itself and by alerts.
Deploy, check the vmrule-test VMRule:
$ kk -n dev-monitoring-ns get vmrule vmrule-test -o yaml
apiVersion: operator.victoriametrics.com/v1beta1
kind: VMRule
...
spec:
groups:
- name: testing-rule
rules:
- alert: TestAlert
annotations:
description: Monitoring job {{ $labels.job }} failed
value: 'Value: {{ $value }}'
summary: Testing VMRule
expr: up == 1
for: 1s
labels:
job: '{{ $labels.job }}'
severity: test
severity: test
Wait for an alert in Slack
“It works!”
Actually, that’s all – looks like I described the main points for the VictoriaMetrics Kubernetes Monitoring Stack installation.
The post VictoriaMetrics: deploying a Kubernetes monitoring stack first appeared on RTFM: Linux, DevOps, and system administration.
Subscribe to my newsletter
Read articles from Arseny Zinchenko directly inside your inbox. Subscribe to the newsletter, and don't miss out.
Written by

Arseny Zinchenko
Arseny Zinchenko
DevOps, Cloud infrastructure engineer. In love Linux, Open Source, and AWS.
