Adding Prometheus to a FastAPI app | Python
 Carlos Armando Marcano Vargas
In this article, we are going to learn how to add Prometheus to a FastAPI server. This article will show a simple demonstration and code examples of how to create a request counter to count the number of requests made to a route. And a request counter for all the requests.
Requirements
Python installed
Pip installed
Prometheus
Prometheus is an open-source systems monitoring and alerting toolkit originally built at SoundCloud. Since its inception in 2012, many companies and organizations have adopted Prometheus, and the project has a very active developer and user community.
Installing Prometheus
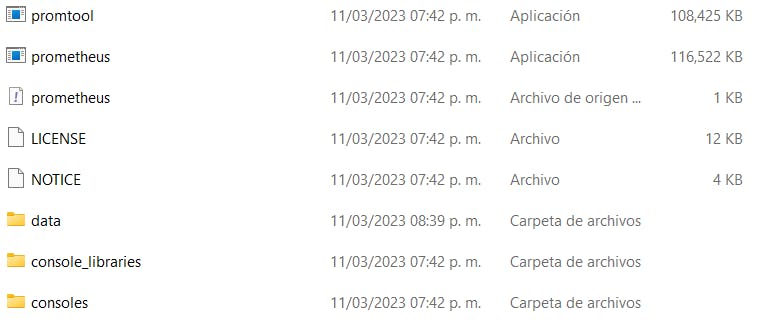
To install Prometheus, you can use a Docker Image or download a precompiled binary. We will use a precompiled binary, to download it, we have to go to this site.

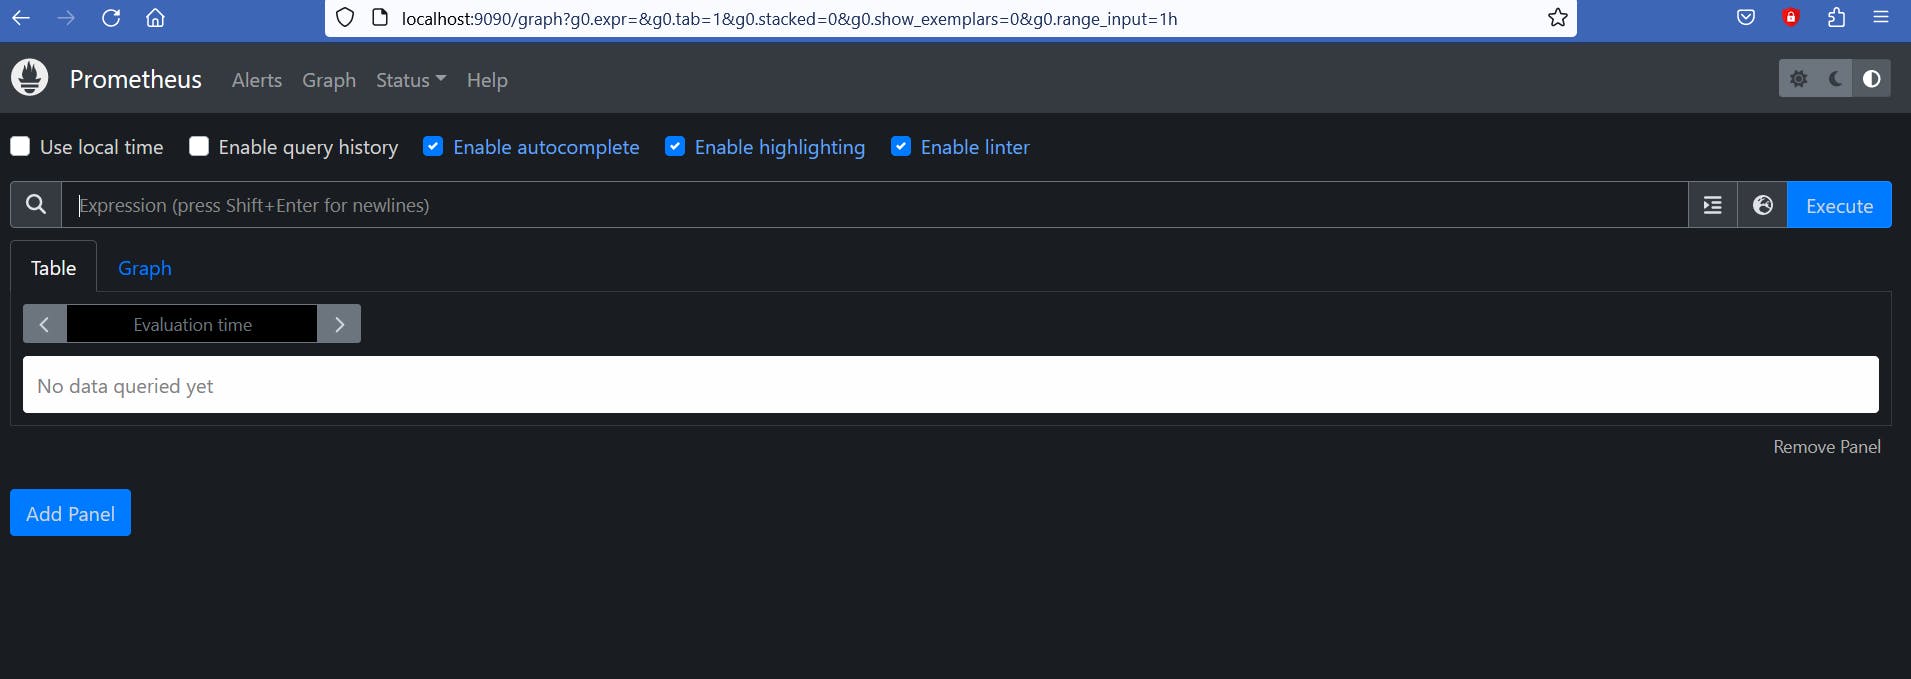
The prometheus server will start on port 9090. So we go to localhost:9090 to see its UI.

Creating the FastAPI server
Now we are going to build the FastAPI server. We need to install FastAPI, Uvicorn and the Prometheus client.
pip install fastapi uvicorn prometheus-client
main.py
from fastapi import FastAPI

from prometheus_client import make_asgi_app

app = FastAPI()


metrics_app = make_asgi_app()
app.mount("/metrics", metrics_app)

@app.get("/")
def index():
    return "Hello, world!"
In this file, we import make_asgi_app from prometheus_client to create a Prometheus metrics app. We pass that registry to make_asgi_app() to create the metrics app. We mount that metrics app at the /metrics route using app.mount("/metrics", metrics_app).
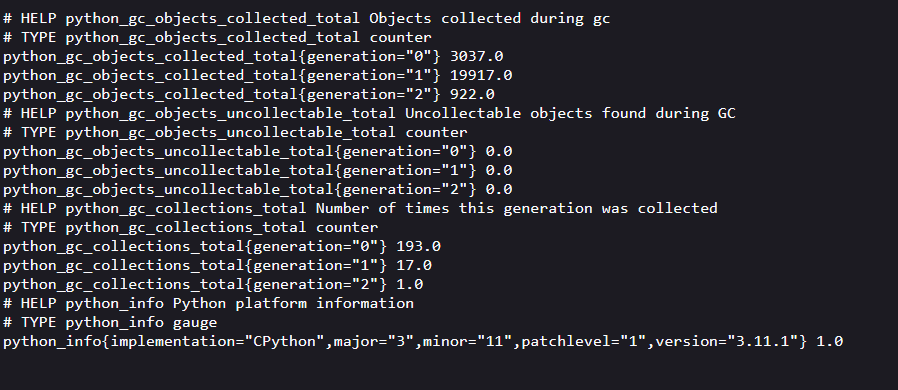
We start the server and navigate to localhost:8000/metrics. We should see the following response in our web browser.

Creating a counter
from fastapi import FastAPI, Request
from prometheus_client import make_asgi_app, Counter

app = FastAPI()

index_counter = Counter('index_counter', 'Description of counter')

metrics_app = make_asgi_app()
app.mount("/metrics", metrics_app)

@app.get("/")
def index():
    index_counter.inc()

    return "Hello, world!"
Next, we create a counter. For every request to the route "/", the counter will increment by 1.
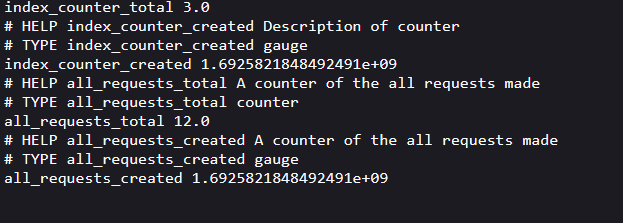
We start the server. And navigate to localhost:8000/ and then to localhost:8000/metrics , we should see the following response.

Now, we can create a middleware, to count every request made to the server.
from fastapi import FastAPI, Request
from prometheus_client import make_asgi_app, Counter

app = FastAPI()

all_requests = Counter('all_requests', 'A counter of the all requests made')

...

@app.middleware("tracing")
def tracing(request: Request, call_next):
    all_requests.inc()
    response = call_next(request)
    return response
Here, we create a FastAPI middleware and create a counter to count all the requests. We create the tracing function and add the all_request.inc() function which will increment by 1 for every request made to the server.

prometheus.yml
# my global config
global:
  scrape_interval: 15s # Set the scrape interval to every 15 seconds. Default is every 1 minute.
  evaluation_interval: 15s # Evaluate rules every 15 seconds. The default is every 1 minute.
  # scrape_timeout is set to the global default (10s).

# Alertmanager configuration
alerting:
  alertmanagers:
    - static_configs:
        - targets:
          # - alertmanager:9093

# Load rules once and periodically evaluate them according to the global 'evaluation_interval'.
rule_files:
  # - "first_rules.yml"
  # - "second_rules.yml"

# A scrape configuration containing exactly one endpoint to scrape:
# Here it's Prometheus itself.
scrape_configs:
  # The job name is added as a label `job=<job_name>` to any timeseries scraped from this config.
  - job_name: "prometheus"

    # metrics_path defaults to '/metrics'
    # scheme defaults to 'http'.

    static_configs:
      - targets: ["localhost:9090"]

  - job_name: fastapi-server
    static_configs:
      - targets: ["localhost:8000"]
prometheus.yml is the configuration file for the Prometheus server. We add another job_name to scrape the metrics of our Gin server and define it as fastapi-server. We have to specify the port where the exporter is listening, in our case, 8000. Now, we can go to localhost:9090 and execute a query to test if Prometheus is collecting any metric.
We write all_requests_total to see how many requests were made to the server, and click execute.

Conclusion
Prometheus is a powerful open-source monitoring system that can be easily integrated with FastAPI applications. In this article, we saw how to set up Prometheus monitoring for a FastAPI app. We installed the Prometheus client library and exposed metrics endpoints. We then configured Prometheus to scrape those endpoints and started visualizing the metrics in the Prometheus UI.
In this article, we create a request counter. But, this is not all we can do with Prometheus. We can monitor response time, and request latency. We can set up alerts based on these metrics to notify us of any issues. Prometheus gives us visibility into the performance and health of our application, this feature helps us to debug issues and optimize the performance of our applications.
Thank you for taking the time to read this article.
If you have any recommendations about other packages, architectures, how to improve my code, my English, or anything; please leave a comment or contact me through Twitter, or LinkedIn.
The source code is here.
Resources
Subscribe to my newsletter
Read articles from Carlos Armando Marcano Vargas directly inside your inbox. Subscribe to the newsletter, and don't miss out.
Written by

Carlos Armando Marcano Vargas
Carlos Armando Marcano Vargas
I am a backend developer from Venezuela. I enjoy writing tutorials for open source projects I using and find interesting. Mostly I write tutorials about Python, Go, and Rust.