My Experience as an LFX Mentee on the CNCF Thanos Project
 Nishchay Veer
What is LFX mentorship?
The LFX Mentorship provides a structured way for people who want to learn about open-source software development. Experienced open-source developers and maintainers help newcomers become contributors to the open-source community. If you're interested, you can check out the Mentorship Guide to learn more about how the program works.

My Cloud Native Journey Before LFX
My fascination with cloud-native technologies ignited while I was employed as an intern at a startup back in July 2022. The frustrations surrounding our application deployment and management led me on a quest for a more effective approach. That's when I encountered Kubernetes and other cloud-native technologies.
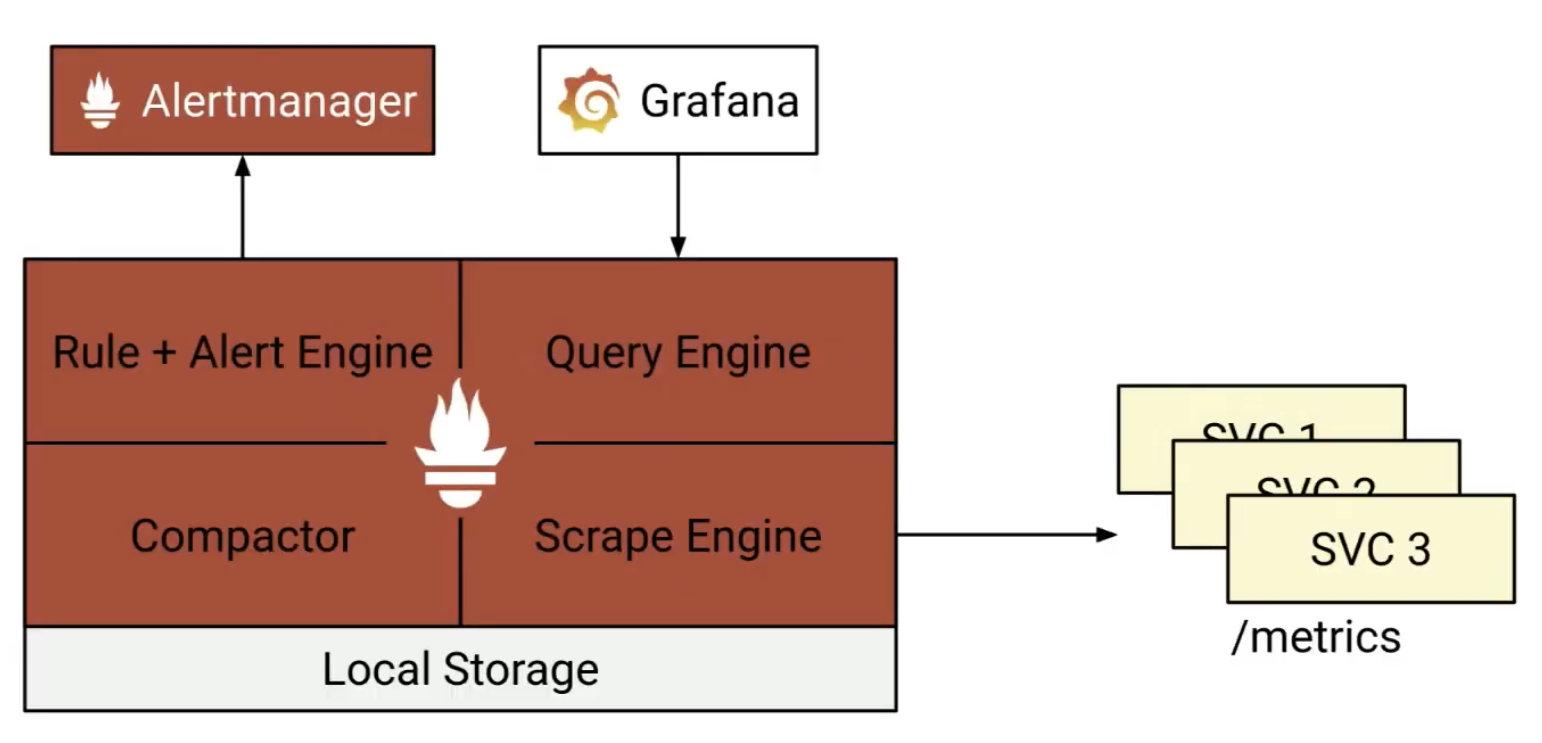
Before discovering LFX, I dipped my toes into a few cloud-native projects. One standout experience was with Prometheus, where I was tasked to write instrumentation code using Golang. If you're not familiar, Prometheus is an open-source tool for monitoring and alerting. I also had the opportunity to contribute to Jenkins and CCextractor during the GSoC application phase, although my proposal, unfortunately, didn't make the cut.
In my LFX journey, I rolled up my sleeves, dove headfirst into the communities, and delved into the codebases. It wasn't just about projects; it was also about connecting with mentors who shared the same passion. Advice: Try to engage with the community as much as you can, ask questions, attend community meetings, and be active on Slack channels. It shows that you are interested in learning in public.
As I embarked on this adventure, I found myself zeroing in on three exciting projects within the CNCF ecosystem:
CNCF - Thanos: Continuation of add query observability for the new engine
CNCF - Service Mesh Performance: IDE Plugin
CNCF - ORAS: Design and implement Artifact Explore web portal
Why Thanos?
Before we dive into Thanos and the reasons behind my application, let's rewind a bit. Back in the day, I was given the chance to work with Prometheus.
What is monitoring?
Managing applications as they grow more complex is a puzzle we all face. Especially when you're dealing with a larger scale, keeping your infrastructure ticking smoothly becomes vital. You want a bird's-eye view of how your applications are doing, how resources are getting used, and where the growth is happening. Imagine this: multiple servers each running containers. But as your user base expands, it starts making sense to split these services into smaller pieces, forming what we call a microservice setup. And when these services need to talk to each other, that's when the magic of interconnection comes into play.
My Experience With Prometheus
I was asked to write an Instrumentation code on Golang. In the context of Prometheus, instrumentation means adding and exposing your own custom metrics. Say, you want to know how many people are clicking on a button, then you can create a counter metric for this purpose. Tracking the number of API calls being made on an API is another place where you can add and expose your own custom metric. Prometheus provides you with different client libraries that can be used to instrument your application depending on the language you're using in your application/service.

Yet, even Prometheus has its own set of limitations. For instance:
It's tough to get a big-picture view of your data.
Holding onto data for extended periods can be a challenge.
And those long-range queries? The resolution might leave you wanting more.
Thanos as the name suggests, it's like the superhero swooping in to address these gaps with its impressive features:
Offering a global view that's hard to beat.
Providing the ability to retain data for the long haul.
And don't even get me started on downsampling—it's a game-changer.
Given my solid grasp of Prometheus, there was no hesitation on my end. I jumped right in, wasted no time, and submitted my application. It was like saying, "Let's do this!" and diving headfirst into the codebase.
Getting Selected
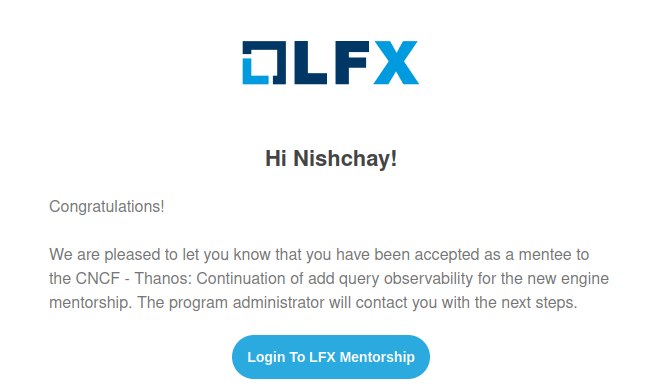
Picture this: It's a breezy evening on May 29th, around 8:00 pm. I'm out cycling, just enjoying the ride. Then, out of nowhere, my phone comes alive with vibrations. My first thought? Maybe it's just another WhatsApp message, nothing urgent. So, I carry on pedaling. But hold on, the vibrations keep coming. This time, though, it's not messages flooding in – it's the mentions in the Thanos Slack channel! I was caught completely off guard, utterly surprised. It was surreal, to say the least. All the hard work I poured into contributions and crafting that cover letter suddenly paid off in the most unexpected way. The excitement that bubbled up within me was beyond words. Finally being accepted felt like a dream coming true.

A Glance at the Orientation Session
The LFX Mentorship Program set sail on June 4th, marking the beginning of an inspiring phase of collaboration and innovation. After weeks of putting our hearts into the mentee review process, the moment arrived with a wave of excitement. The program warmly welcomed a group of eager mentees and mentors who were ready to dive into this journey with genuine enthusiasm.
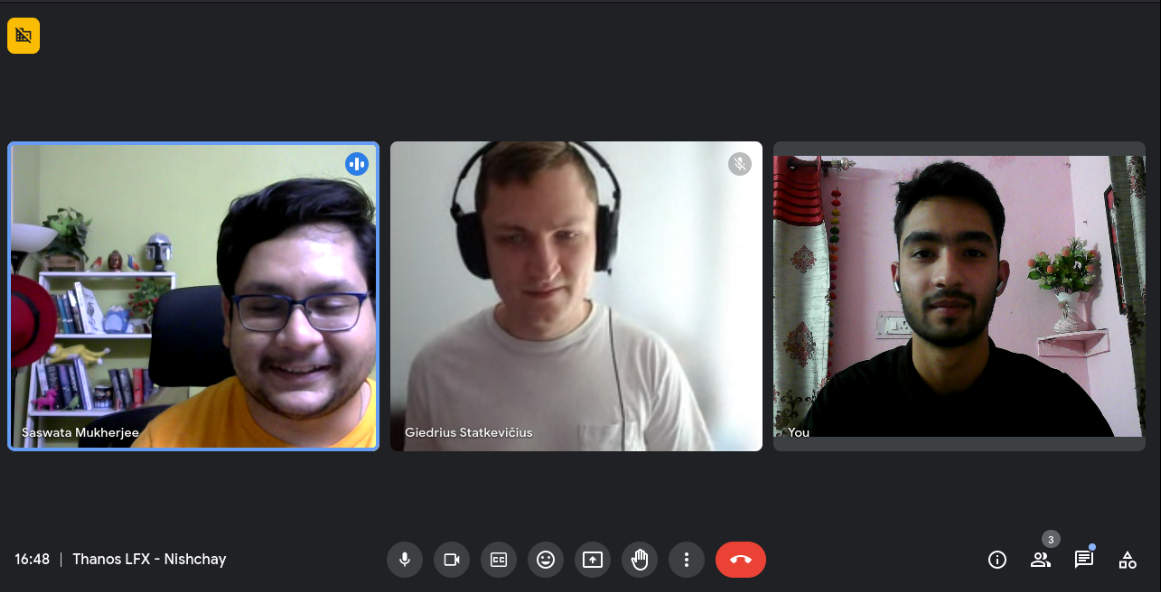
My mentors Saswata and Giedrius guided me with the initial onboarding materials and project-specific resources.

The Assignment: Query Analysis
In the early stages, the new Thanos PromQL Engine had a bit of a blind spot when it came to observability down to the operator level. There was no efficient way to track how each operator performed. So, during term 1, the project's focus was to enhance the Explain method for each operator. The aim was to generate an operator tree, allowing the Thanos Query UI to visualize this operator trace. In this phase, Pradyumna Krishna, the mentee, played a pivotal role in introducing query observability for the new PromQL engine.
During my term, I had the privilege of building upon Pradyumna's foundation by implementing additional features. This entailed establishing the essential groundwork for query observability within Thanos's new PromQL engine and integrating it seamlessly into the UI. As a result, we now have a solid infrastructure that not only enables us to record telemetry from the query engine but also captures crucial metrics like the time each operator consumes.
Feel free to check out the work I've done! But don't worry if you're looking for a deeper dive – I'm planning to write another blog post that will break down my contributions in a way that's easy to understand. It's all geared toward helping future contributors grasp the codebase and the concept of query observability. Stay tuned!
Conclusion
What next
In the previous mentorship sessions, we added the foundation required for query observability in Thanos's new promql engine and hooked it up in the UI. We now have the foundation to record telemetry from our query engine as well such as time consumed per operator. Now we can add more metadata to the query execution, both on the promql engine operator tree level and Thanos Query Select() calls for fan-out query observability. Once we have this metadata, we would like to visualize it in the Query UI.
Overall Experience
I can't express how much I cherish the LFX mentorship program. It's been an incredible learning journey for me. I soaked up so much knowledge while contributing, and I even managed to pick up some fresh skills in Golang and TypeScript along the way. My mentors, Giedrius and Saswata, have been absolute gems. They've held my hand through every step, ensuring I never got stuck and providing both technical expertise and career advice. Their guidance has been a game-changer for me.
Subscribe to my newsletter
Read articles from Nishchay Veer directly inside your inbox. Subscribe to the newsletter, and don't miss out.
Written by
