Kubernetes Monitoring using Prometheus and Grafana
 Aditya Dhopade
What are we going to do here?
We will create a Kubernetes cluster in minikube using the helm charts and set the monitoring of the resources using Prometheus; Showing the monitored Cluster on the descriptive dashboards on the Grafana.
Why there is a need for Monitoring?
It basically boils it down to if we have less number of clusters then we can manage them easily but in the production environment there are 100's or 1000's clusters at that time managing and keeping an eye on each cluster is not possible so we need a monitoring resource in our case Prometheus.
Install minikube
minikube start --memory=4098 --driver=docker
For that instance, you can install any driver from the below link.
Install Prometheus
Add the repository for Prometheus first
helm repo add prometheus-community https://prometheus-community.github.io/helm-charts
helm repo update #to get the latest updates at thatt point of time
Install the Prometheus controller
helm install prometheus prometheus-community/prometheus
Then take a look at the output of the above command generated
# The Prometheus PushGateway can be accessed via port 9091 on the following DNS name from within your cluster:
prometheus-prometheus-pushgateway.default.svc.cluster.local
Get the PushGatewayURL by running this command in the same shell
  export POD_NAME=$(kubectl get pods --namespace default -l "app=prometheus-pushgateway,component=pushgateway" -o jsonpath="{.items[0].metadata.name}")
  kubectl --namespace default port-forward $POD_NAME 9091
Now lets see if the pods and services are up and running for the prometheus
kubectl get pods
kubectl get svc
While getting the service we can see the service type for all the Prometheus services are "ClusterIP" we need to convert them to "NodePort".
kubectl expose service prometheus-server --type=NodePort --target-port=8090 --name=prometheus-server-ext
NOTE: How do we know the target port? ==> we can see it in the port column.
Now as we want to access the Prometheus Dashboard on the browser we can do it simply by using the Minikube IP Address: PORT
To find minikube IP ==> Command is "minikube ip"
Now on the browser we can see it as
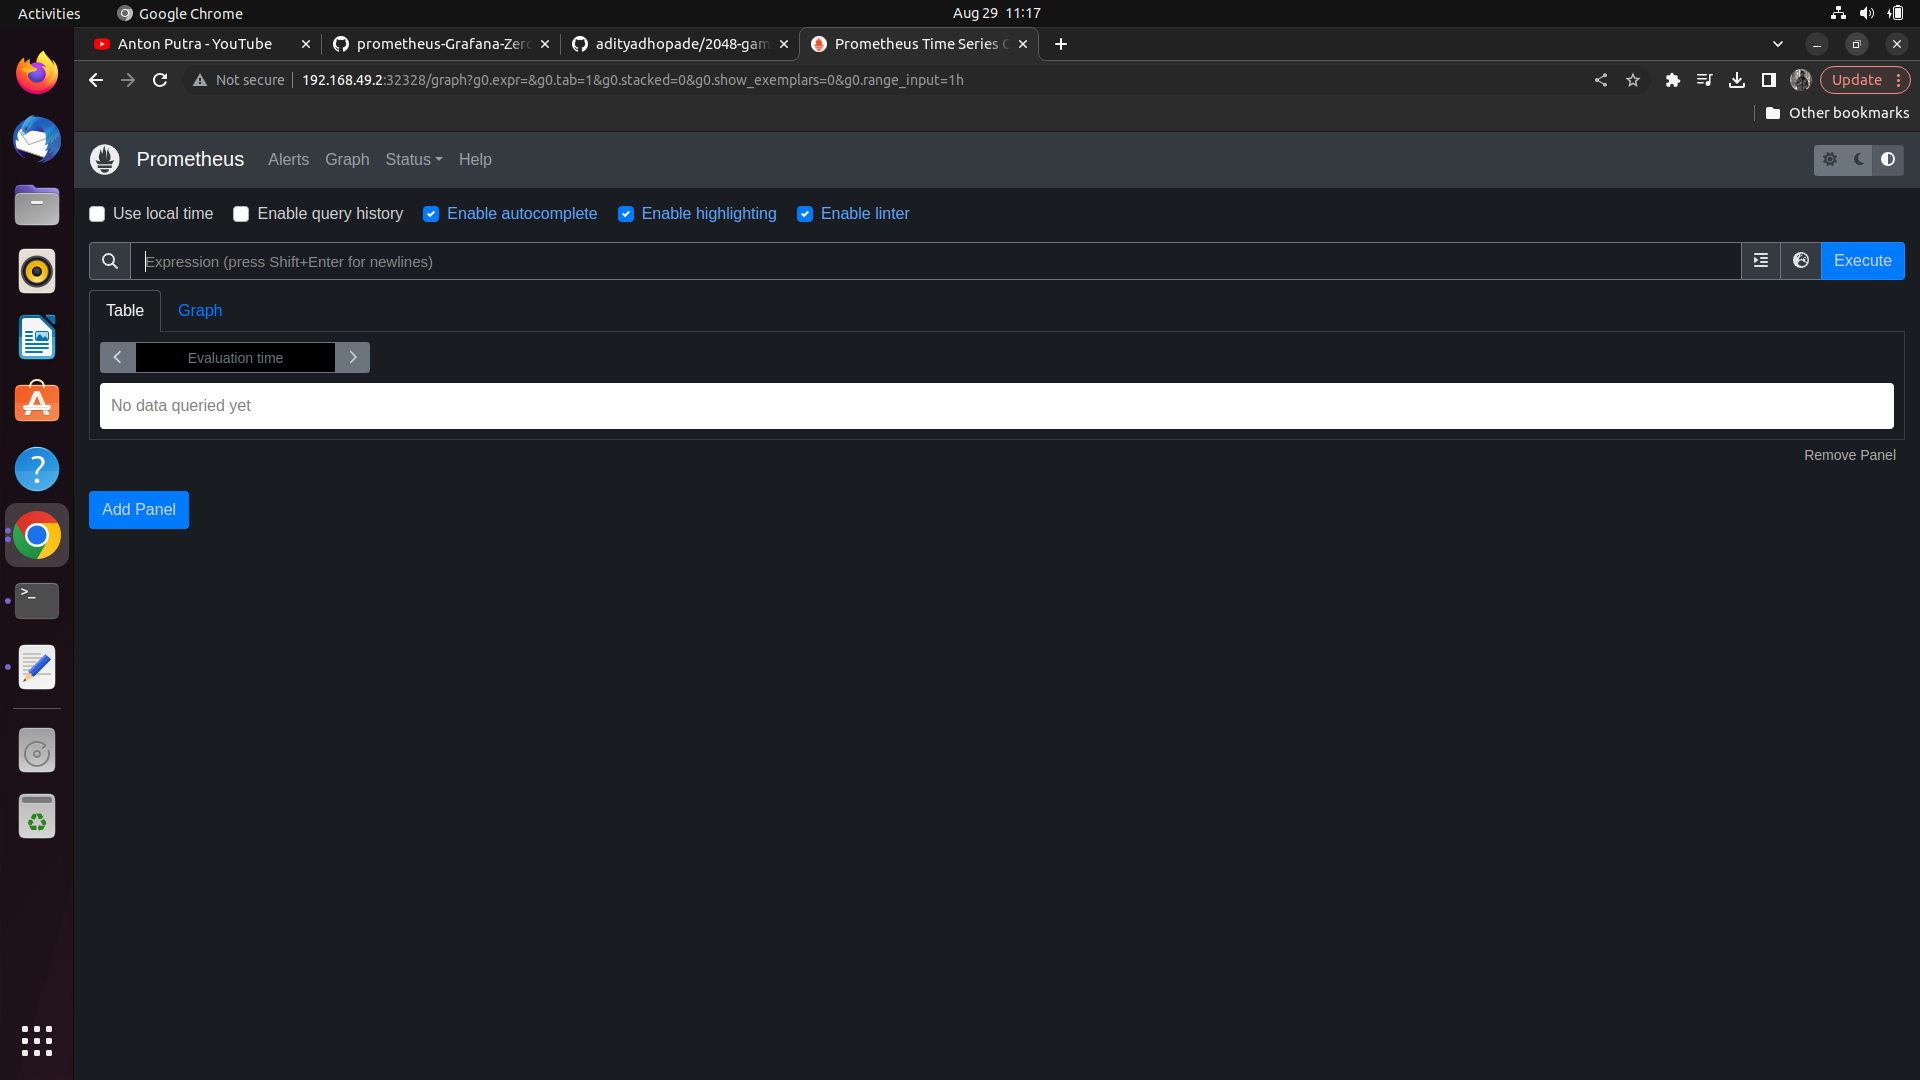
Now we can implement any queries here in the Prometheus Query language to get the details about the K8 server, but these details provided by the K8's API Server are rather generic info about the cluster
What if suppose we want the details about Liveness Probe, HealthChecks of any application then the API Server do not have the capability to provide that for that we need the Kube State metrics (let us move to this in some time)
Install Grafana
Use helm to install the repo
helm repo add grafana https://grafana.github.io/helm-charts
helm repo update

helm install grafana grafana/grafana
Take a look at the output of the latest command there we will get the grafana's dashboard login credentials.
The default user is "admin" and the password is base 64 encoded we need to decode it (don't worry we do not need to remember this). Take a look at the output of the latest command
kubectl get secret --namespace default grafana -o jsonpath="{.data.admin-password}" | base64 --decode ; echo
Save the decoded password somewhere and just log into the Grafana dashboard.
See if the pods and the services for both the Grafana and the Prometheus are running
kubectl get pods
kubectl get svc
Now we can see in the Service that all services are of type and are running on the Cluster IP so we need to convert them to Nodeport.
kubectl expose service grafana --type=NodePort --target-port=3000 --name=grafana-ext
To access the Grafana dashboard we will get it as http://<minikube-ip>:PORT
Add Prometheus as a Data Source to the Grafana Dashboard.
As Grafana is just a visualization platform it would need some more input here that will be provided with the help of data source
Click on Data Sources card ==> Add Datasource [prometheus]
Now in the text field below add the URL ==> http://<minikube-ip>:PORT
So now the grafana can use the promtheus as the data source and show some charts/ dashboards.
We can also import the Dashboard; Grafana have defined some predefined queries and anybody with the dashboard id will automatically be able to pull some information from Prometheus
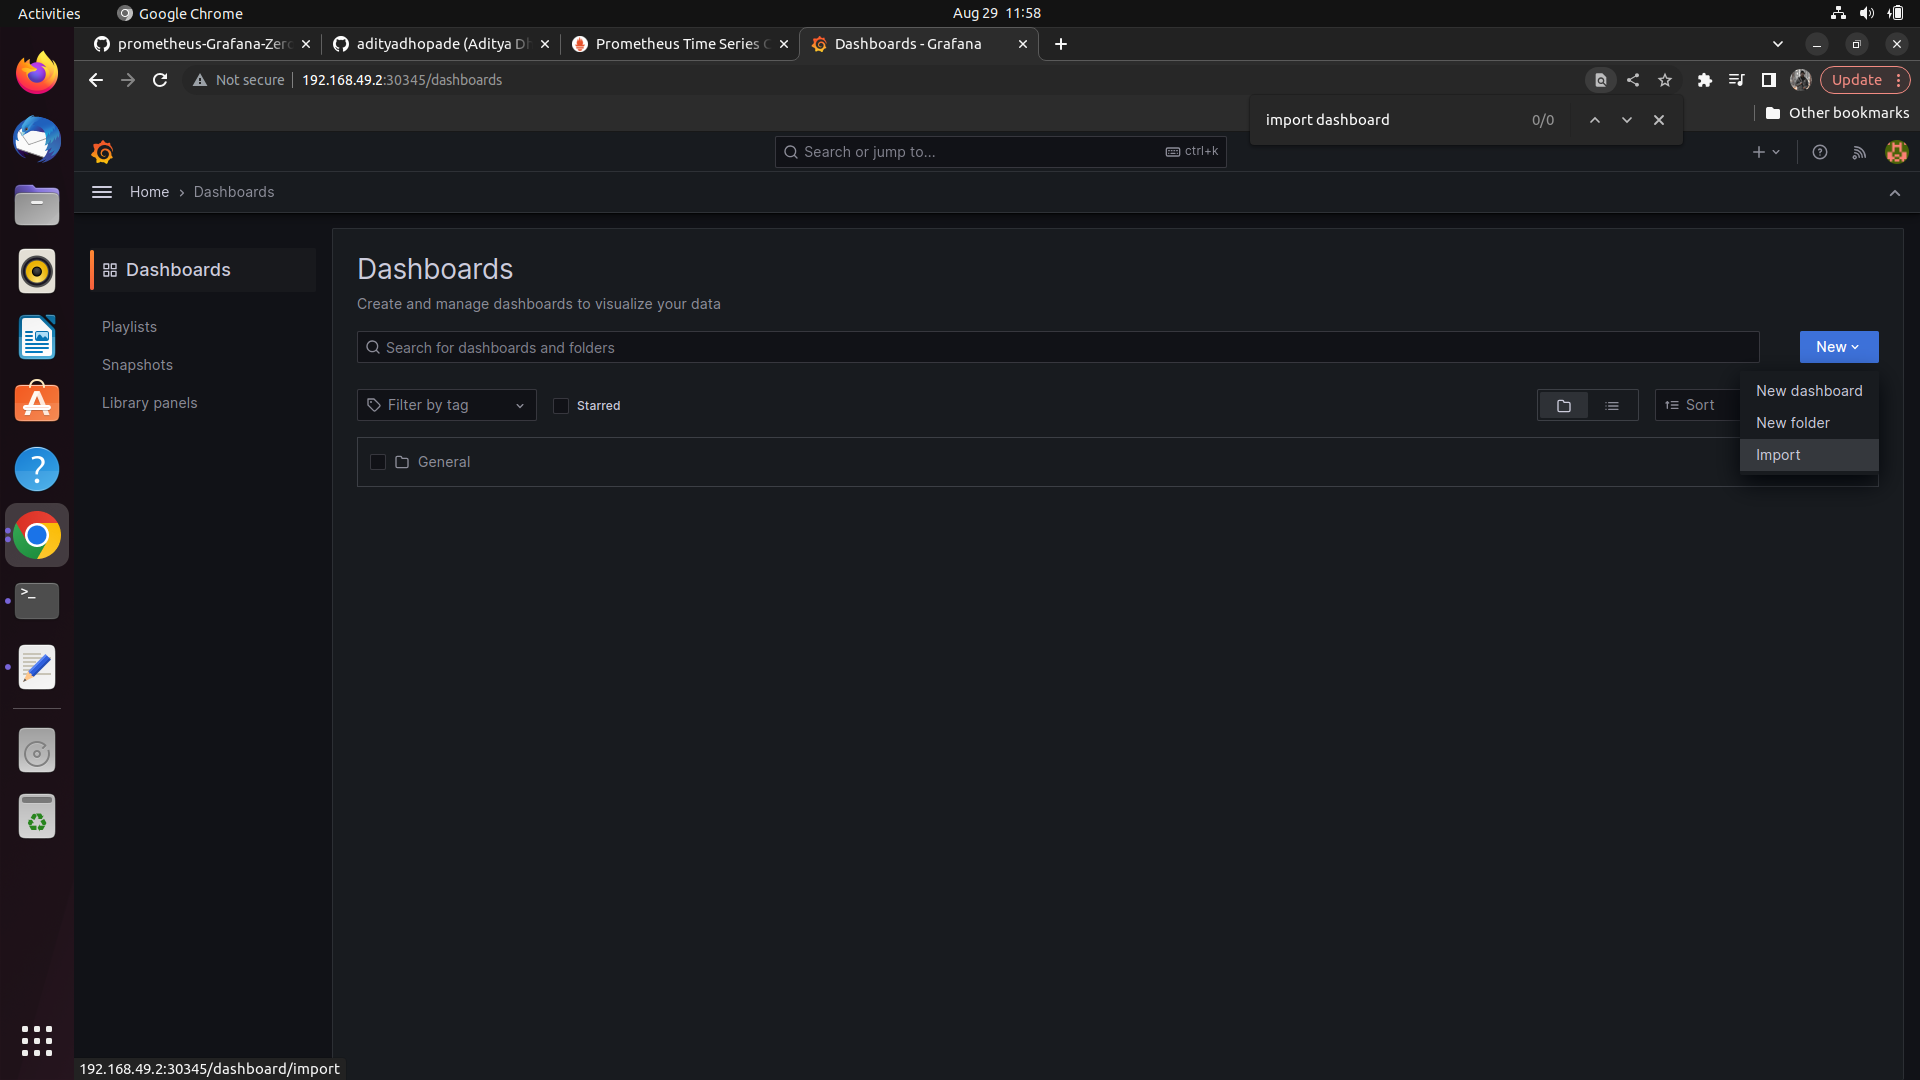
in the field import via grafana.com text field and add the ID number as 3662
Why 3662? ==> Gives out the standard template in the grafana; that gets lots of information from the Kubernetes cluster;
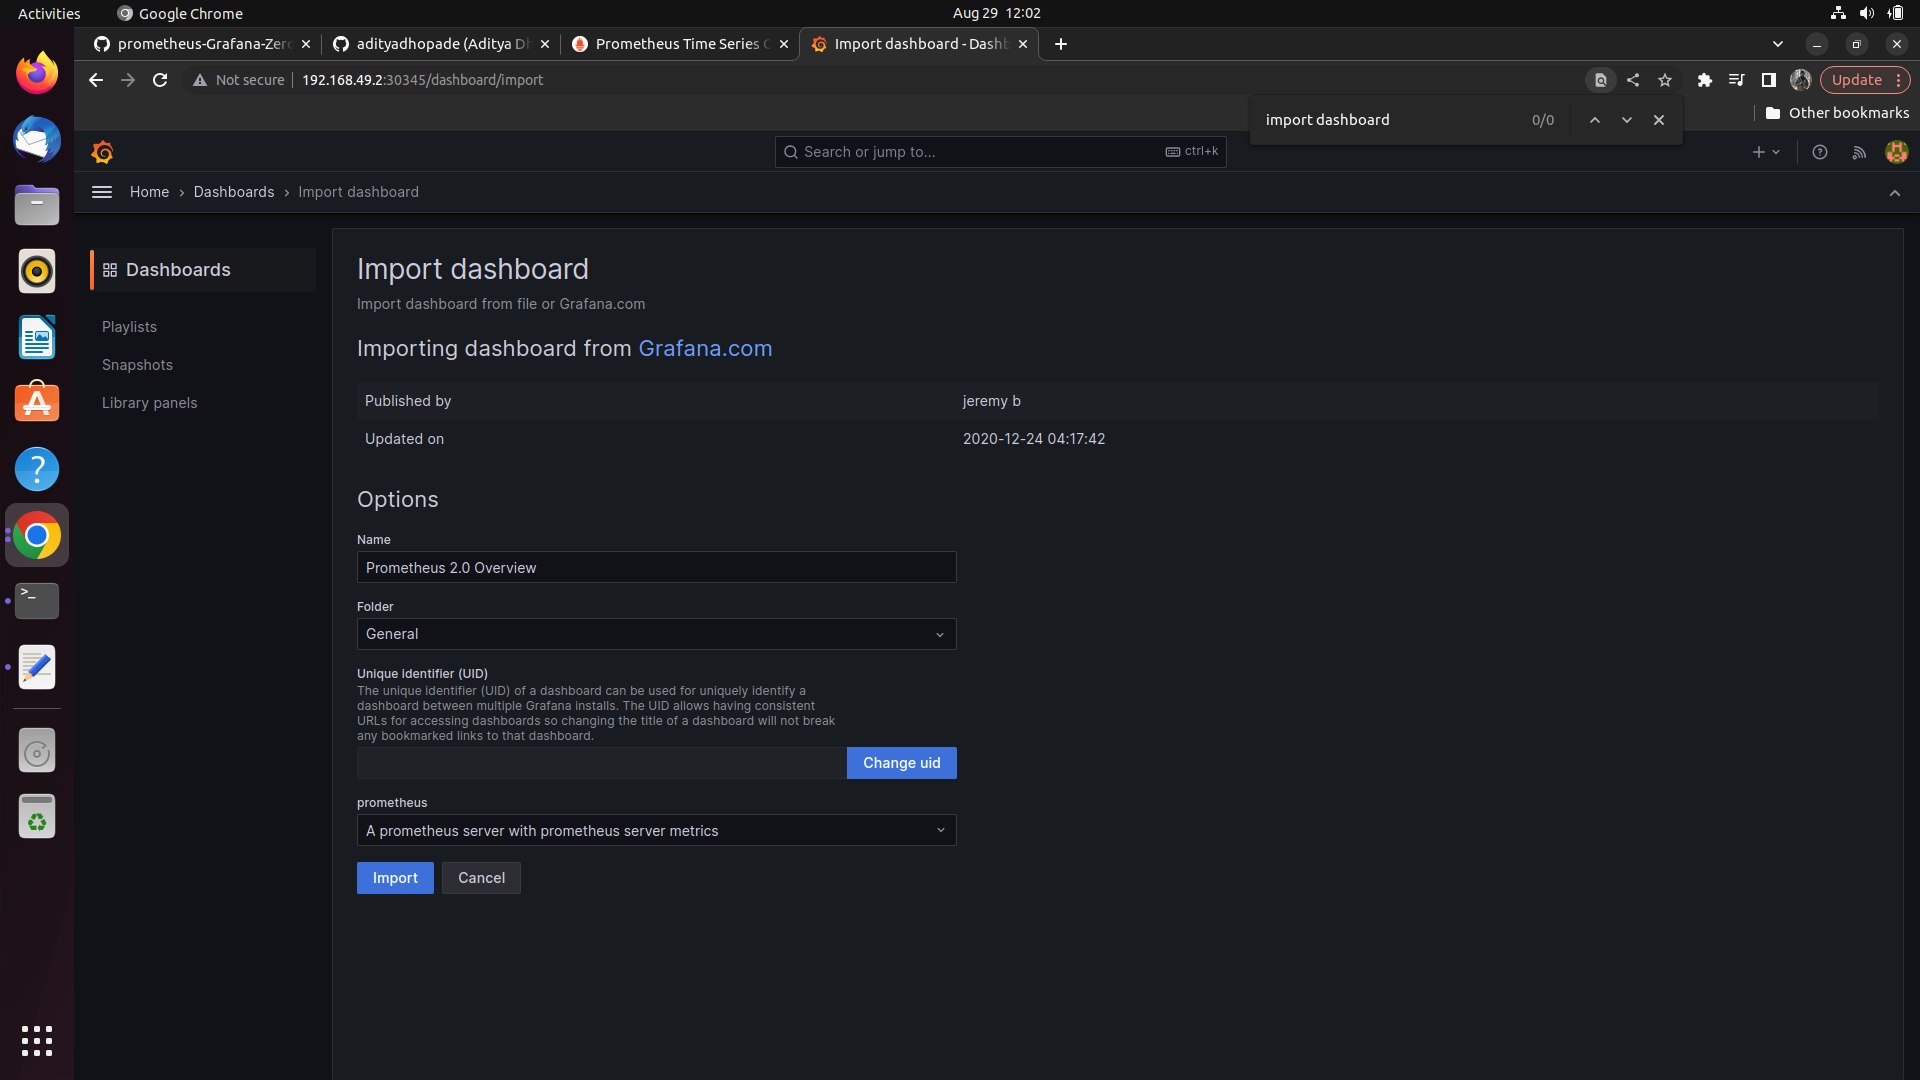
Kube State metrics
We can see the service of kube state metrics running
kubectl get svc
prometheus-kube-state-metrics has ClusterIP in it and we need to convert it to Nodeport
kubectl expose service prometheus-kube-state-metrics --type=NodePort --target-port=8080 --name=prometheus-kube-state-metrics-ext
Check this out on the Browser using http://minikube-ip:port
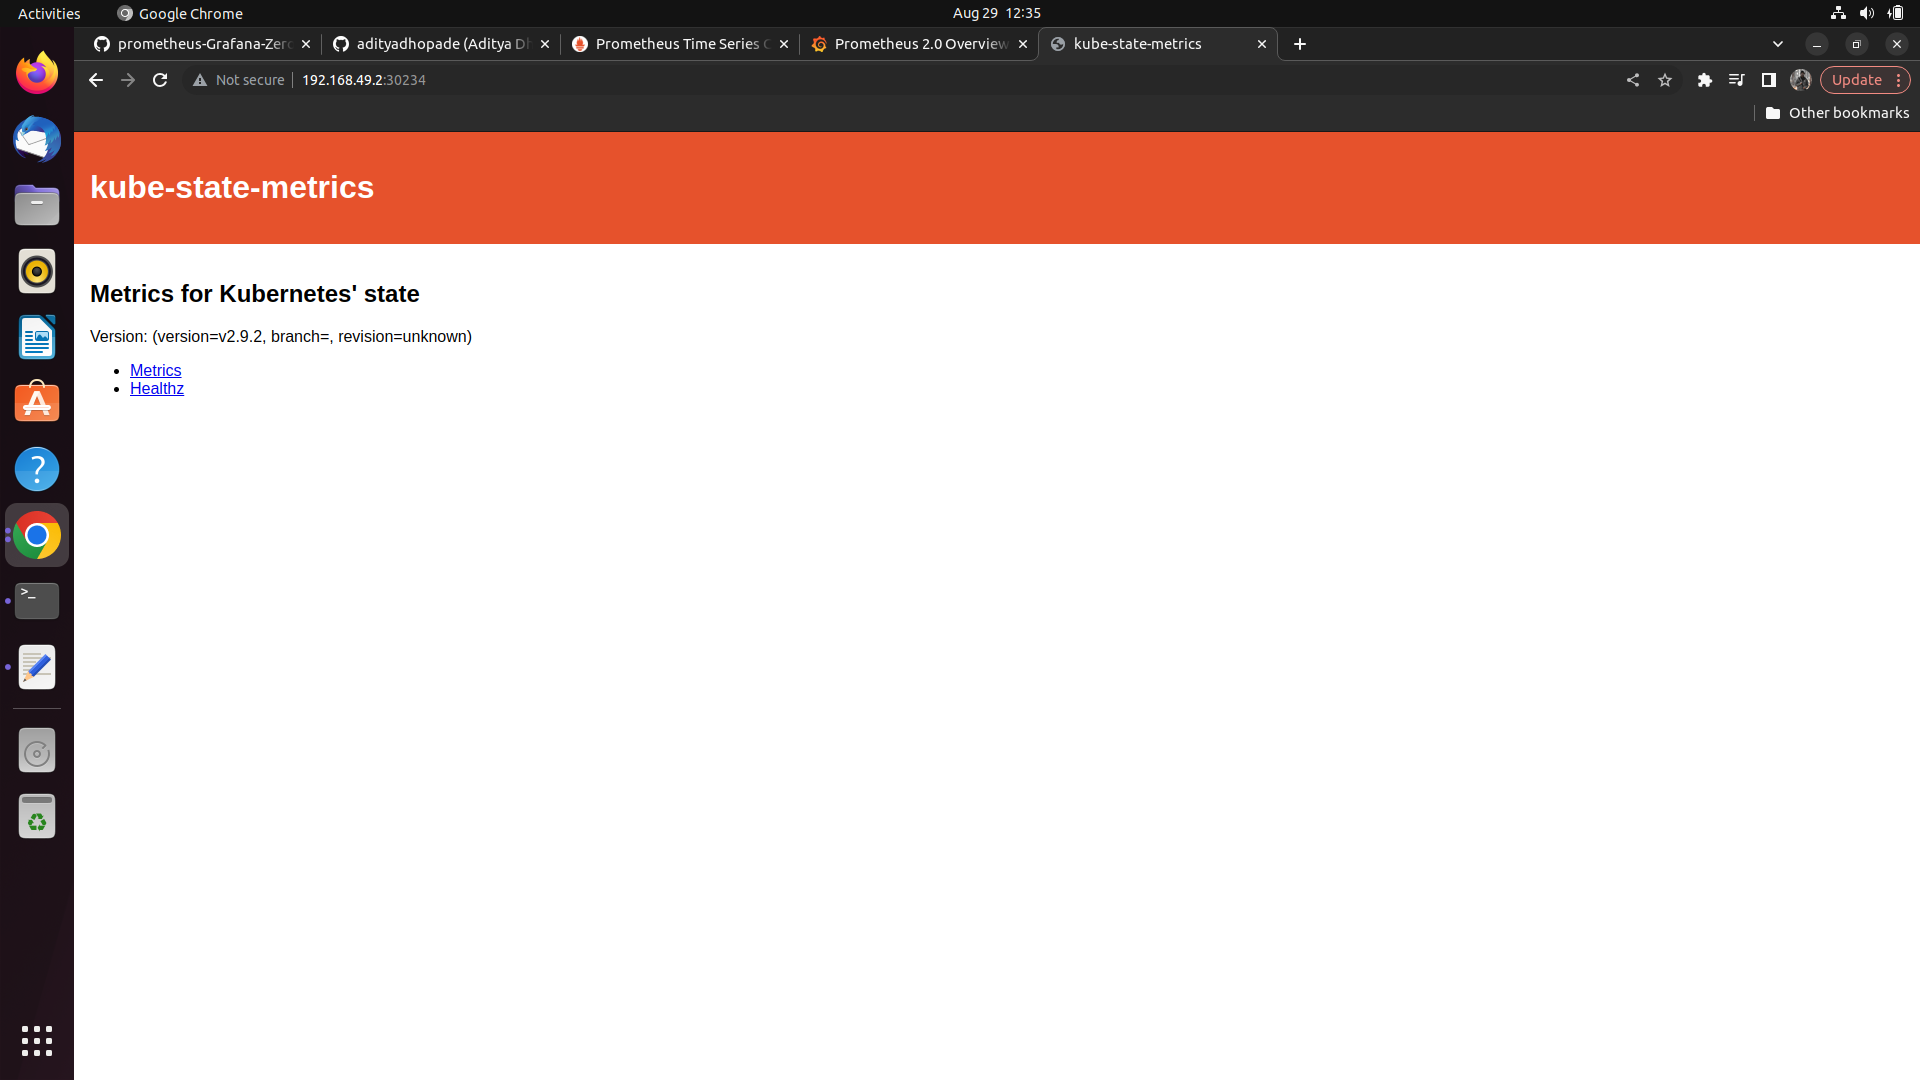
If we go to http://minikube-ip:port/metrics

The data is present in the metrics format;
We can use this information inside the Grafana as well as Prometheus
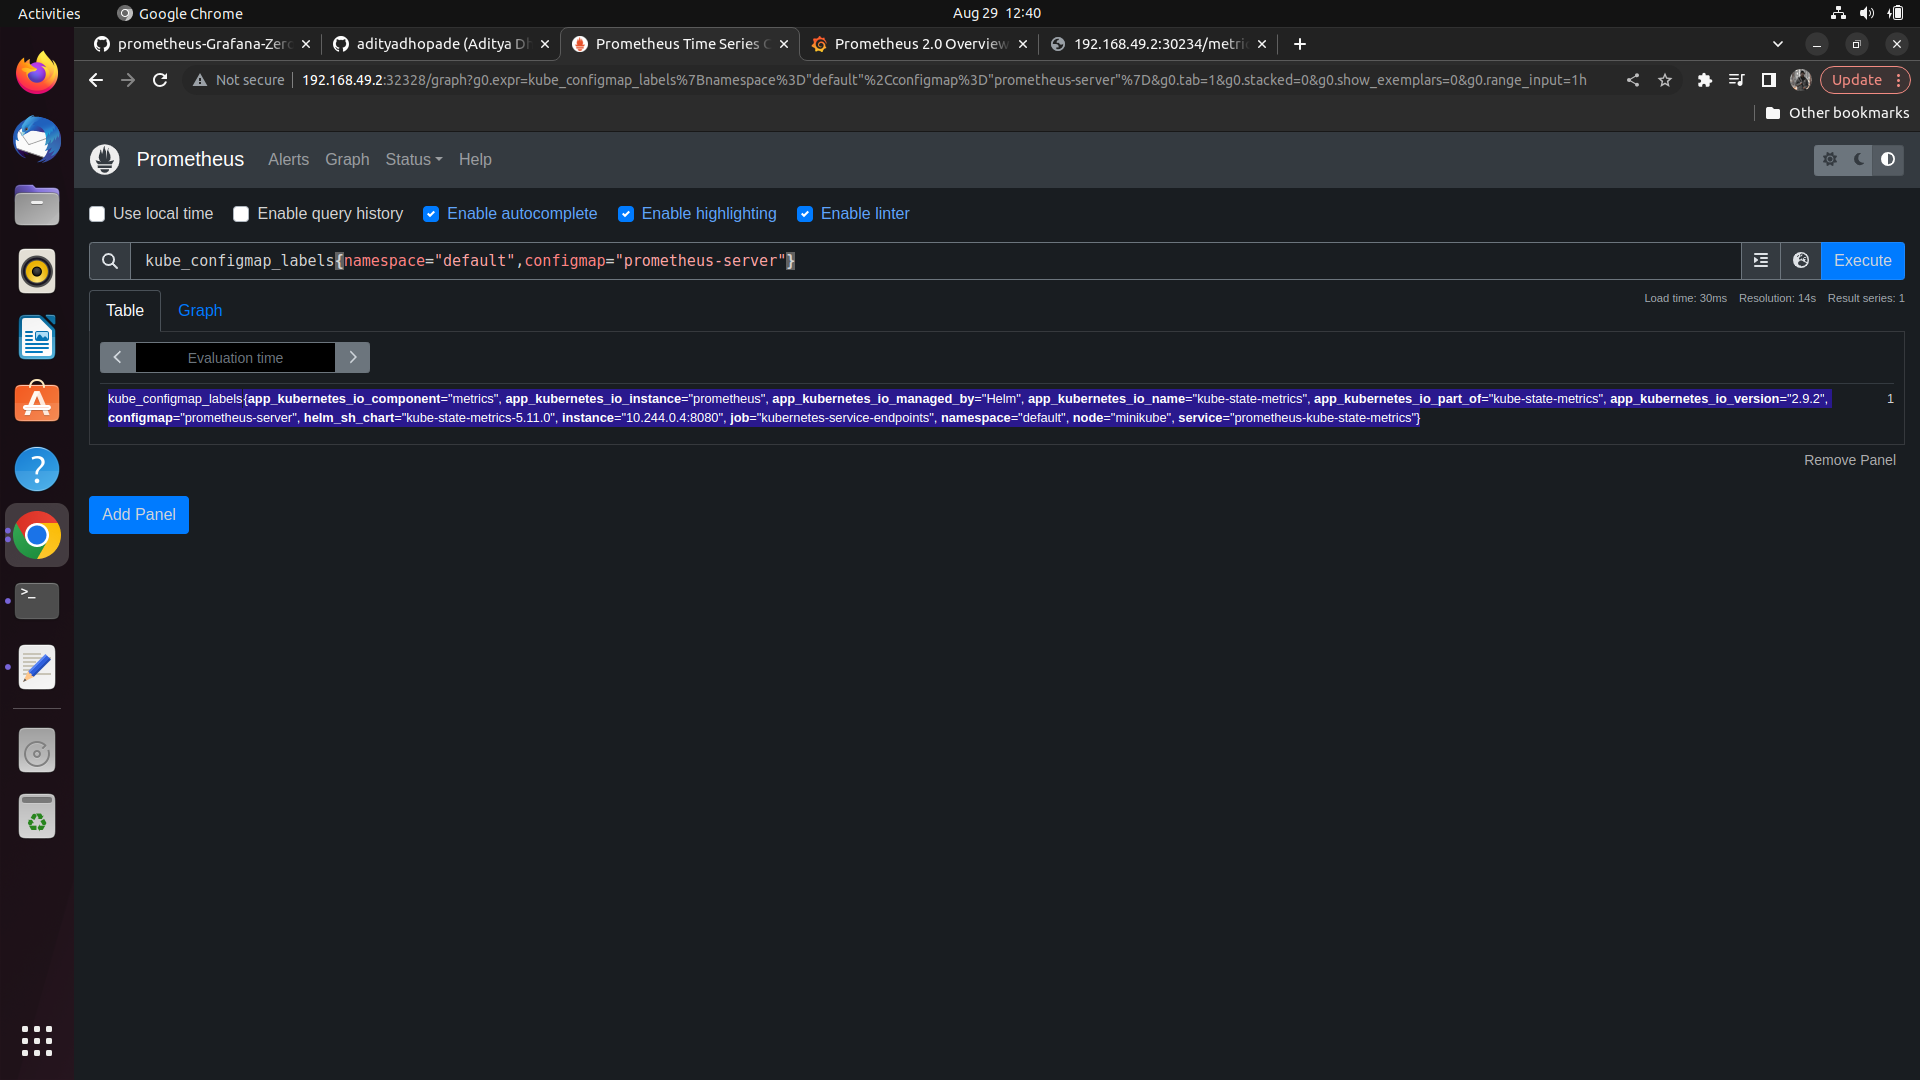
Now if we run any of the queries that are showing in the metrics format in the Prometheus dashboard we can see it as follows
kube_configmap_labels{namespace="default",configmap="prometheus-server"}
Can we add the metrics info directly to Prometheus?
YES
kubectl get cm
kubectl edit cm prometheus-server
// Inside the
scrape_configs:
    - job_name: prometheus
      static_configs:
      - targets:
        - localhost:9090
As our new target will be http://minikube-ip:portno/metrics so we need to addd it under the scrape_sconfigs:
    scrape_configs:
    - job_name: prometheus
      static_configs:
      - targets:
        - localhost:9090
    - job_name: state_metrics
      static_configs:
       - targets:
            - http://192.168.49.2:30234/metrics
We will get the same o/p with all the metrics in the data
Subscribe to my newsletter
Read articles from Aditya Dhopade directly inside your inbox. Subscribe to the newsletter, and don't miss out.
Written by

Aditya Dhopade
Aditya Dhopade
A passionate DevOps Engineer with 2+ years of hands-on experience on various DevOps tools. Supporting, automating, and optimising deployment process, leveraging configuration management, CI/CD, and DevOps processes.