Time Series Analysis Series
 Benedict Debrah
Introduction to time series analysis
Have you ever wondered how experts are able to predict the future or why the past holds such significance? Time series analysis holds the answers. By examining historical data patterns and trends, this powerful technique enables us to make informed predictions about what lies ahead. Time series analysis allows us to learn from the past and use that knowledge to make informed decisions about the future. It helps us gain confidence and predict what may happen ahead of time.
In this post, I will discuss time series and give a thorough understanding of this concept. In the field of data science and statistics, time series can often be perceived as complex and challenging to grasp. However, through this post, I aim to simplify the concepts and provide clarity. Additionally, I will guide you through a practical session to reinforce your understanding. Join me as we demystify time series and embark on a journey to explore its practical applications.
I will use Python for this series.
Time Series Time series is a sequence of data points collected over a specific time period. It represents the values of a variable or multiple variables recorded at regular intervals, such as seconds, minutes, hours, days, months, or years. Time series data is commonly used in various fields, including finance, economics, meteorology, and signal processing, to analyze trends, patterns, and make forecasts.
And in any time series analysis, the objectives are :
1. Description: The objective of description in time series analysis is to summarize and understand the main characteristics of the data. This involves examining the statistical properties of the time series, such as mean, variance, autocorrelation, and distributional characteristics. Descriptive analysis helps in gaining an initial understanding of the data, identifying any trends or patterns, and assessing the data quality.
2. Explanation: The objective of explanation is to identify the underlying factors or causes that contribute to the observed patterns or behavior in the time series. This involves investigating the relationships between the time series and relevant explanatory variables. By understanding the drivers or determinants of the time series, one can gain insights into the causal mechanisms and make informed decisions based on the identified relationships.
3. Prediction: The objective of prediction, also known as forecasting, is to estimate or predict future values of the time series based on past observations. Prediction is a crucial aspect of time series analysis as it allows for anticipating future trends, making business or investment decisions, and planning resource allocation. Various statistical and machine learning methods, such as ARIMA, exponential smoothing, or regression models, are used for time series forecasting.
4. Control: The objective of control involves using the insights gained from time series analysis to implement control measures or interventions to influence the behavior of the time series. This objective is particularly relevant in business or manufacturing settings where maintaining desired performance levels or targets is crucial. Control involves monitoring the time series data in real-time, detecting any deviations from desired values or patterns, and implementing corrective actions or adjustments to bring the time series back within the desired control limits.
By pursuing these objectives of description, explanation, prediction, and control, analysts can effectively analyze and utilize time series data to gain insights, make informed decisions, and improve performance in various domains.
Time series are very important because of its Applications in many fields.
- Sales forecasting
- Economic forecasting
- Stock market analysis
- Census analysis
and more
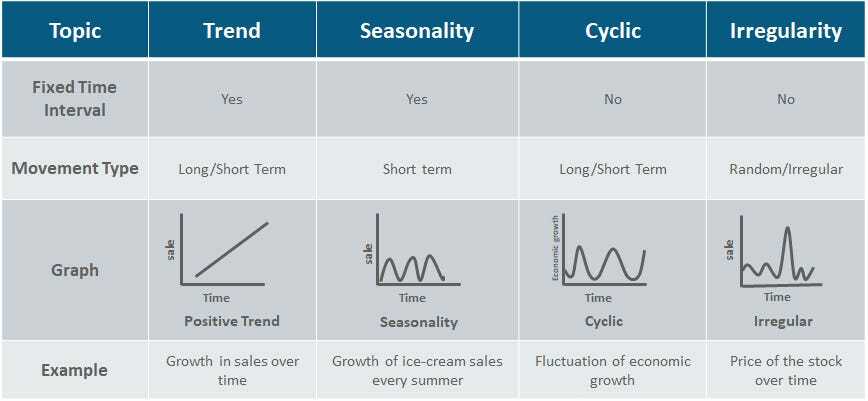
And in time series, we basically have 4 components( there is more, but we will focus on these 4 ): The components of a time series are the different patterns that can be identified within the data. The main components of a time series are:

1. Trend: The trend component represents the long-term, overall direction or movement of the time series. It indicates whether the series is increasing, decreasing, or remaining relatively stable over time. A trend can be linear (straight line) or nonlinear (curved), and it provides insights into the underlying behavior or growth of the variable being measured.
2. Seasonality: Seasonality refers to regular and predictable fluctuations in the time series that occur at fixed intervals, such as days, weeks, months, or seasons. Seasonality is typically driven by calendar effects, climatic factors, or recurring events. Identifying and understanding seasonality is important for analyzing and forecasting the data accurately, as it helps capture the recurring patterns within shorter time periods.
3. Cyclical: The cyclical component represents longer-term, irregular fluctuations in the time series that do not repeat at fixed intervals. These fluctuations are often associated with economic or business cycles, reflecting periods of expansion and contraction. Unlike seasonality, which has a fixed duration, cyclical patterns can vary in length and amplitude. Analyzing the cyclical component helps in understanding the broader economic or systemic influences on the data.
4. Irregular or Residual: The irregular or residual component represents the random or unpredictable fluctuations that remain in the time series after removing the trend, seasonal, and cyclical effects. It captures the residual noise or randomness that cannot be explained by the other components. The irregular component may include measurement errors, short-term shocks, or unforeseen factors affecting the data.
Understanding and decomposing these components is essential for analyzing the patterns, trends, and underlying dynamics in a time series, as well as for making accurate forecasts and informed decisions based on the data.
We now have a basic understanding of time series, objectives and its components.
My next post will be a practical session talking about the discussed content here using Python.
Thanks for reading.
Subscribe to my newsletter
Read articles from Benedict Debrah directly inside your inbox. Subscribe to the newsletter, and don't miss out.
Written by

Benedict Debrah
Benedict Debrah
Currently working as an AI engineer