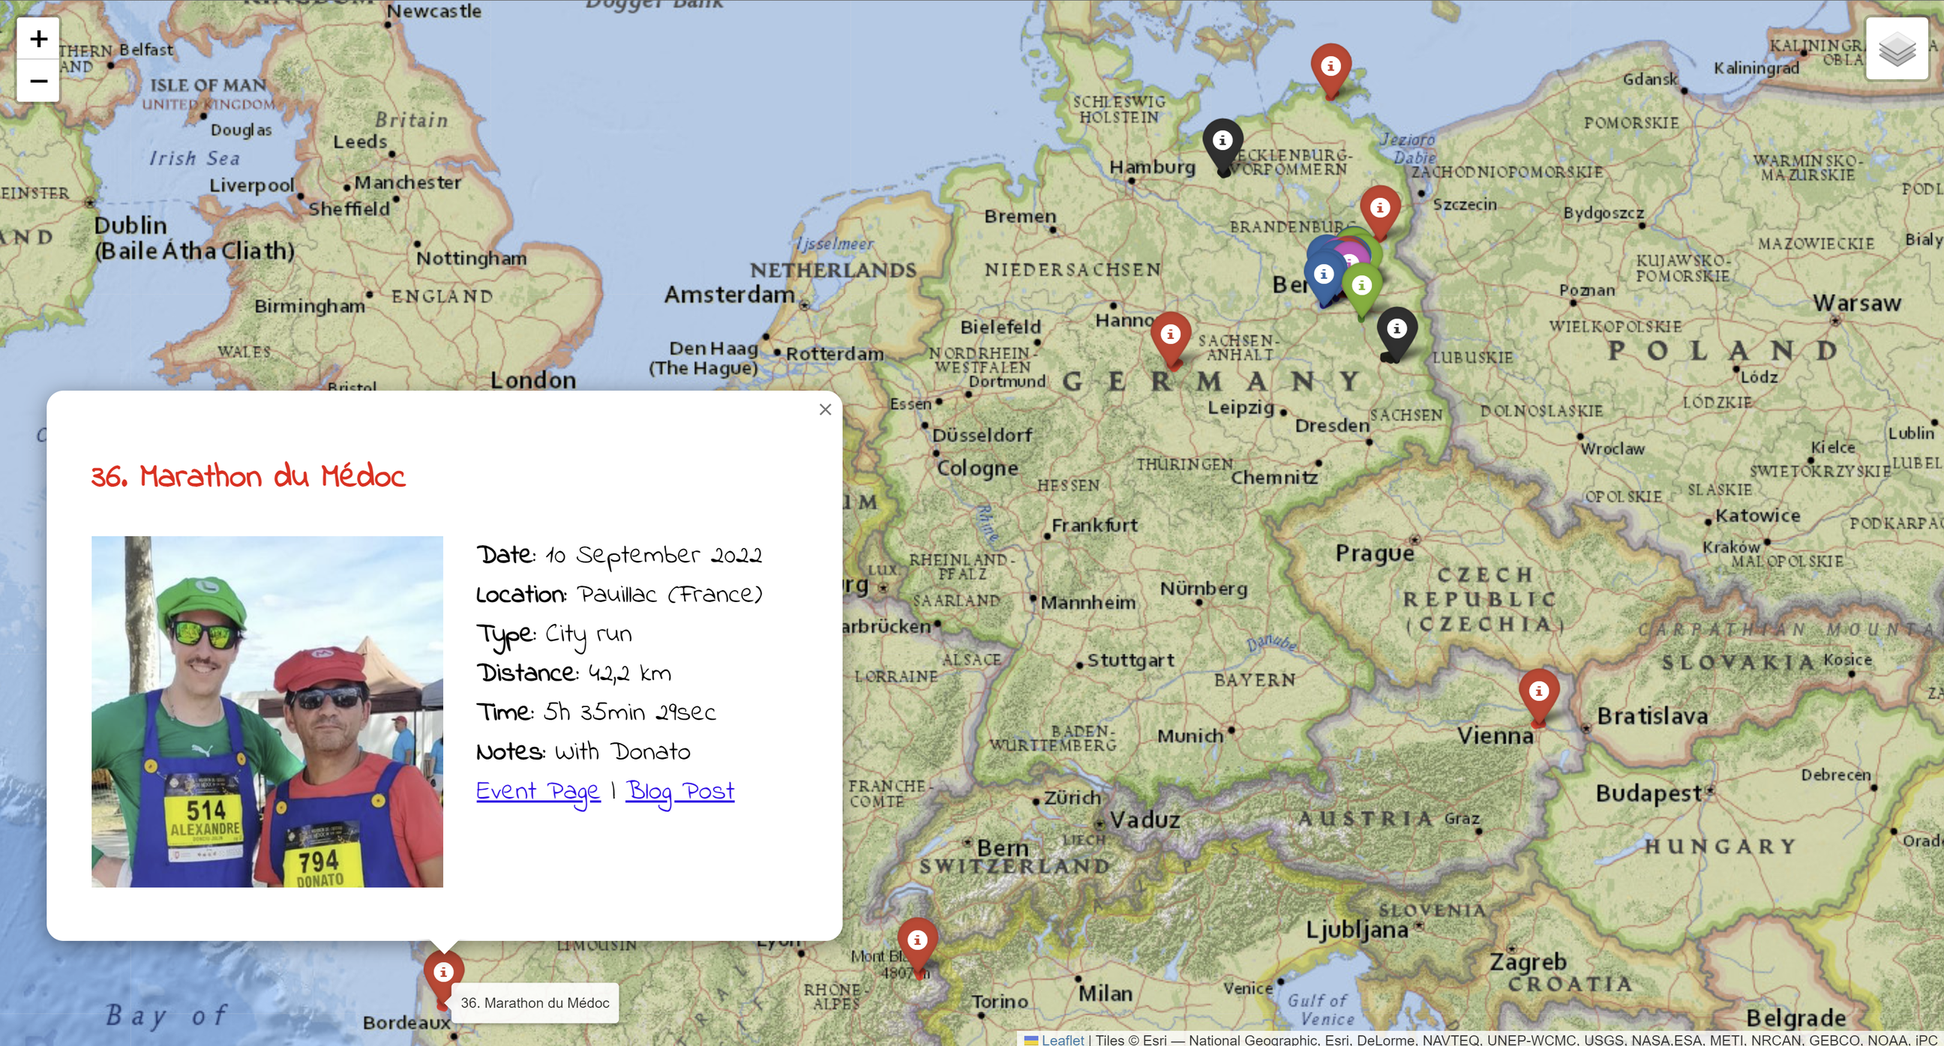
My running map using python and folium
 Alexandre Donciu-Julin
Click on the image to display the interactive one.
I'm a huge fan of maps, probably since I played around with my dad's roadmaps as a kid (he hated it, as he could never fold them back properly!). I cannot spend a day without fiddling with Google Maps. Although my trail running hobby and my GPS-watch addiction play a big part in that!
I have a running blog where I share reviews of events I took part in 🏃 But over the years, I kind of lost track of them. How many were there? Where did I run? How was the route? I need some kind of map to visualize them. What if I could make it so simple, that I would only need to update a Google spreadsheet with race information and the map on my blog would update accordingly? Let's see what we can do...
FOLIUM. That's our code word for today. Folium is a Python module that is going to provide exactly what we need: Manipulate data in Python, then visualize it in a Leaflet map.
Let's start with a simple example: Creating a map from one race event logged in this spreadsheet.
See tutorial.py on my git repo.
Download the spreadsheet
Let's first download the Google spreadsheet as a CSV file, it will be easier to work with the data. I shared the document so anyone with the link can access it. The following command will download the spreadsheet.
import os
sheet_url = 'https://docs.google.com/spreadsheets/d/1WghWJbxdCeKpbi3-H_6FmBAv_jILD_1_woRhuKGJ190/export?exportFormat=csv'
current_folder = os.path.dirname(os.path.abspath(__file__))
csv_filepath = os.path.join(current_folder, 'run_events.csv')
command = f'curl -L {sheet_url} -o {csv_filepath}'
os.system(command)
You should now have a run_events.csv file next to your script.
Load CSV data
Who doesn't love Pandas 🐼? Load the contents of the CSV file into a Python dictionary.
import pandas as pd
data = pd.read_csv(csv_filepath).to_dict(orient='records')[0]
print(data)

# Output:
# {'Date': '28.09.2014', 'Race': '41. Berlin Marathon', 'Latitude': 52.51625499, 'Longitude': 13.37757535, 'Time': '4:17:35', 'Link': 'https://www.bmw-berlin-marathon.com/'}
Create the HTML map
Now we can start having fun! You will find Folium tutorials everywhere and the documentation itself is pretty straightforward. Let's generate a simple map and populate it with our data.
import folium

# create map object and center it on our event
import folium
run_map = folium.Map(location=[data['Latitude'], data['Longitude']], tiles=None, zoom_start=12)

# add Openstreetmap layer
folium.TileLayer('openstreetmap', name='OpenStreet Map').add_to(run_map)

# save and open map
run_map.save('run_map.html')
import webbrowser
webbrowser.open('run_map.html')
Run the code, the map should be generated, saved and opened in your default web browser. As you can see, it's empty and just centered on the race location (Berlin). Click images to see HTML maps.
Populate the map
Let's add a marker point for our race to the map. We want it to be part of a 'Marathons' feature group, display the race name as a tooltip, assign a color to it and display a short legend in the corner.
# add feature group for Marathons
fg_marathons = folium.FeatureGroup(name='Marathons').add_to(run_map)

# create marker and add it to marathon feature group
folium_marker = folium.Marker(location=[data['Latitude'], data['Longitude']], tooltip=data['Race'], icon=folium.Icon(color='red'))
folium_marker.add_to(fg_marathons)

# add legend in top right corner
run_map.add_child(folium.LayerControl(position='topright', collapsed=False, autoZIndex=True))
Our marker now shows up at the given coordinates. It displays the name of the race if we hover over it and we can display or hide it from the corner legend.
Add pop-up windows
It would be nice to make that marker clickable and offer more information about the race. Let's create an HTML iframe that will pop up when the user clicks on the marker. You will need some basic HTML knowledge for that, but nothing fancy at this point.
# create an iframe pop-up for the marker
popup_html = f"<b>Date:</b> {data['Date']}<br/>"
popup_html += f"<b>Race:</b> {data['Race']}<br/>"
popup_html += f"<b>Time:</b> {data['Time']}<br/>"
popup_html += '<b><a href="{}" target="_blank">Event Page</a></b>'.format(data['Link'])
popup_iframe = folium.IFrame(width=200, height=110, html=popup_html)

# modify the marker object to display the pop-up
folium_marker = folium.Marker(location=[data['Latitude'], data['Longitude']], tooltip=data['Race'], popup=folium.Popup(popup_iframe), icon=folium.Icon(color='red'))
folium_marker.add_to(fg_marathons)
There it is. We even created a link on the URL, opening the event page in another tab. And since it's an HTML iframe, we can now basically display anything we want in it (pictures, videos, links, CSS styling, and so on).
Add GPX trace
The cherry on top, it would be amazing to display the route, like you usually see on the event website.

This was easier than I thought. GPX files recorded by GPS watches or phones are XML documents easy to read and parse. I used the gpxpy library for that, which is doing exactly what we need: read the GPX file and extract points/segments from it to display on our map. You can find GPX files everywhere, on Strava or Komoot for instance.
Here is how I opened and extracted segments from my own GPX file recorded during the race. I am using a step value when slicing all the points, to smooth out the curve (loading 1 every 10 coordinate points).
# parse gpx file
import gpxpy
gpx_file = 'berlin_marathon_2014.gpx'
gpx = gpxpy.parse(open(gpx_file))
track = gpx.tracks[0]
segment = track.segments[0]

# load coordinate points
points = []
for track in gpx.tracks:
    for segment in track.segments:
        step = 10
        for point in segment.points[::step]:
            points.append(tuple([point.latitude, point.longitude]))

# add segments to the map
folium_gpx = folium.PolyLine(points, color='red', weight=5, opacity=0.85).add_to(run_map)

# add the gpx trace to our marathon group
folium_gpx.add_to(fg_marathons)
Wonderful, the trace is showing up as expected on the map. Notice that, as we added it to the Marathons feature group, it inherits the red color and is affected by the legend checkbox too. You can now play around with the segment's weight, opacity, color and step value to fine-tune it.
That's it, you have all you need to build a kick-ass map. Just add multiple lines to the spreadsheet and modify your data frame to load all the data into lists.
Improve the map
If you browse through my run_map.py script, you will notice that it is a bit more advanced. Here are some improvements I added to my map and to the project itself, to make it more appealing and fit my needs:
Add additional tile layers (ArcGIS)
Group my events by type (halfs, marathons, ultras) and assign to each one a different color, also affecting the pop-up title and the G{X trace
Customize the pop-up window with a picture of the race, a nice font, links, etc
Move all paths and map settings to a JSON file, so there are no hard-coded values in the code and it is easier to change a setting (GPX trace weight or opacity for instance)
Put all race events info into the Google spreadsheet
Add an FTP upload method at the end to send the HTML, JPG and GPX files onto the online storage my blog is using
You can see the final result in the Events tab of my running blog.
Finally, you may notice that my script does not only update the map but also a table of events information displayed below it, as well as a little event-o-meter gadget in the sidebar. Both are generated when I run the script and are updated according to the updated Google spreadsheet information.


Conclusion
I therefore succeeded in my holy quest to put all my running events on a pretty nice-looking map. All I need to do now, after completing a new event, is to fill in the information in the Google doc and provide a jpg thumbnail and the GPX trace of my run, then run the script to generate a new map and update the table and gadget. This last step could be automated of course, if we had our script running in the cloud and checking any updates done on the spreadsheet.
Have fun playing with folium and don't forget to share your maps! Take care and see you on the trail 🏔️🏃♂️

Subscribe to my newsletter
Read articles from Alexandre Donciu-Julin directly inside your inbox. Subscribe to the newsletter, and don't miss out.
Written by

Alexandre Donciu-Julin
Alexandre Donciu-Julin
Innovative software engineer with over 15 years of solid technical expertise in AI, computer vision and software development.


