EDA Analysis on IPL Dataset
 Manjunath Irukulla
Table of contents

In this new series, I'm going to share my learnings in Machine Learning. In this article, we are going to learn what EDA analysis is, how it can help us explore the data, and the basic libraries, code implementation, etc.
I am using Google Collab for it, but you can use any IDE you are comfortable with.
Click - here for the Dataset link. I got this from the Kaggle website for free.
Let's get started!
What is EDA Analysis?
EDA (Exploratory Data Analysis) is generally used to investigate the data and summarize the key insights of the dataset. It will give you a basic understanding of your data, its distribution, null values, and much more. We can easily explore the data using a few commands using Python and its libraries such as numpy, Pandas, etc.
Commands in EDA
#Load the Data
#To load the dataset, we need to use the Python library Pandas.
import pandas as pd
df = pd.read_csv("/path/to/csv/file")
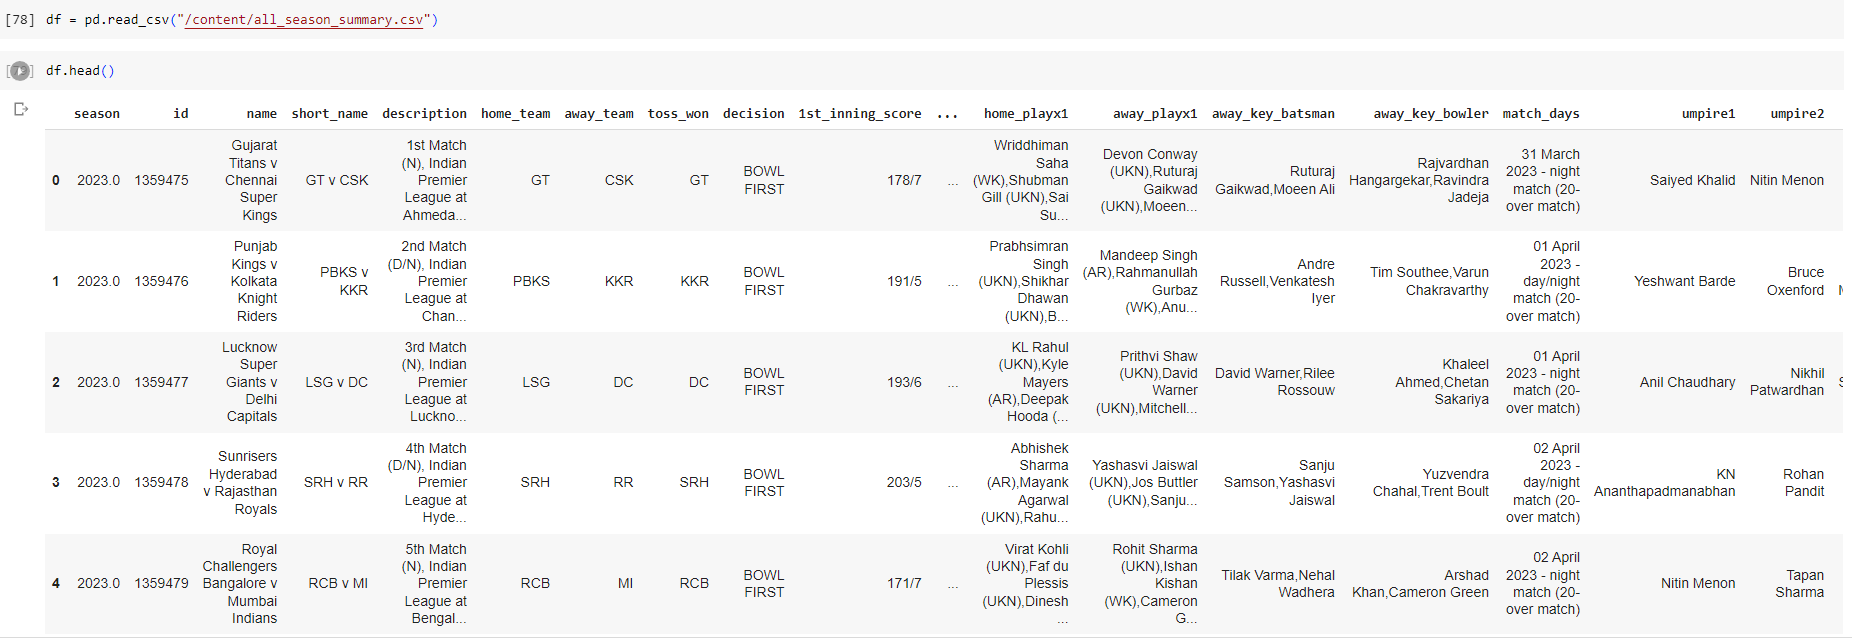
#To view the top five listings in the dataset
df.head()

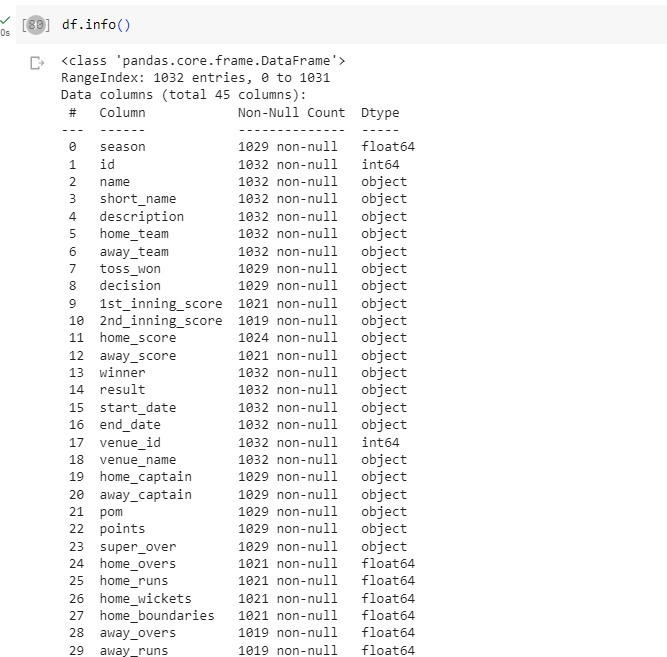
#To Get Basic Information about Data
df.info()

#To Know the Columns in the Dataset
df.columns()

#To get a basic description of the Dataset
df.describe()

#To know if there are any null values in the dataset
df.isnull()

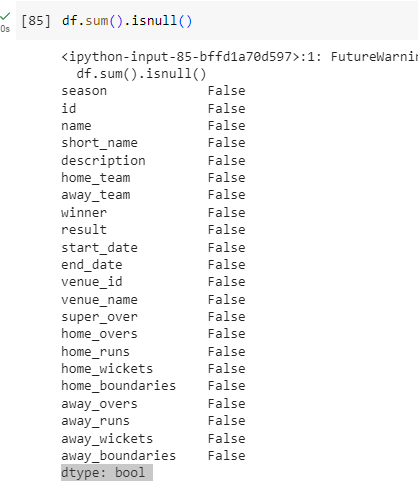
In our case, it's empty. No column has a null value in it. If in any case, you get null values while working on other datasets, then you can use this command to know how many there are in them.
df.sum().isnull()

Let's say you have to work on a single column, i.e., pom (Player of the match), then you can use this code.
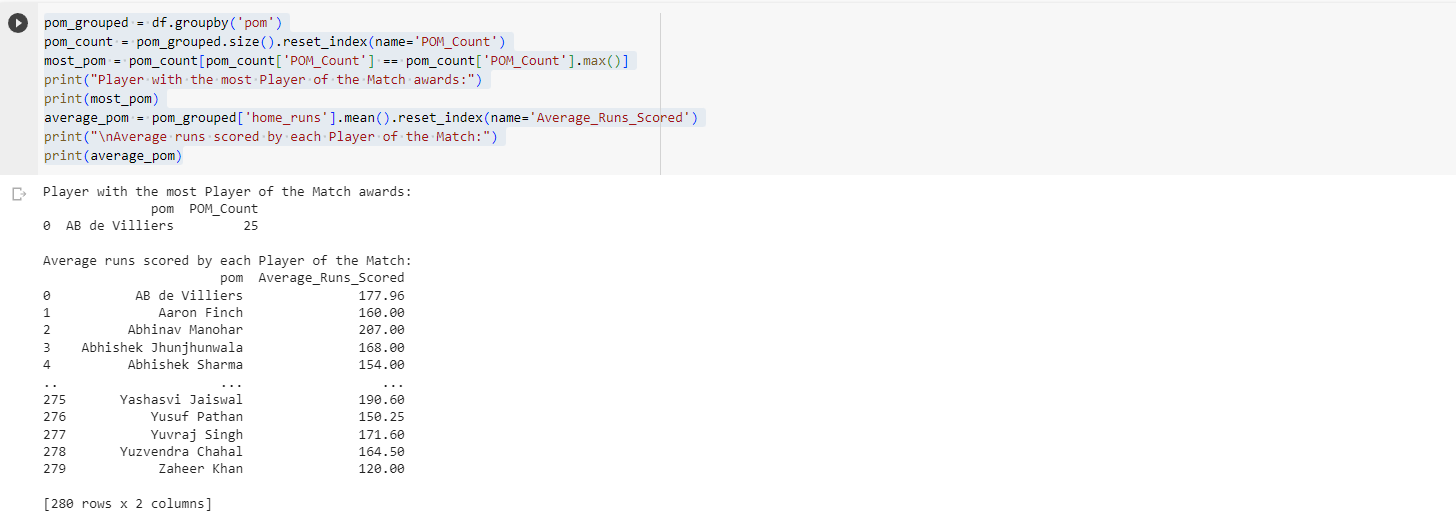
pom_grouped = df.groupby('pom')
pom_count = pom_grouped.size().reset_index(name='POM_Count')
most_pom = pom_count[pom_count['POM_Count'] == pom_count['POM_Count'].max()]
print("Player with the most Player of the Match awards:")
print(most_pom)
average_pom = pom_grouped['home_runs'].mean().reset_index(name='Average_Runs_Scored')
print("\nAverage runs scored by each Player of the Match:")
print(average_pom)
I think you guys didn't understand this code well. Don't worry, I can help you.
The code first groups the data frame by pom column. It then gets the number of rows in each group and the player with the most Player of the Match awards. Finally, it calculates the average number of runs scored by each Player of the Match.
The code then uses the groupby() function to group the DataFrame by the pom column. This means that the data frame is split into 5 groups, one for each number of Player of the Match awards (1, 2, 3, 4, and 5).
The next line of code pom_count = pom_grouped.size().reset_index(name='POM_Count')gets the number of rows in each group. The size() function returns the number of rows in each group, and the reset_index() function adds a new column POM_Count that contains the number of rows in each group.
The next line of code most_pom = pom_count[pom_count['POM_Count'] == pom_count['POM_Count'].max()]gets the row that contains the player with the most Player of the Match awards. The pom_count['POM_Count'] == pom_count['POM_Count'].max() expression checks if the number of Player of the Match awards in each row is equal to the maximum number of Player of the Match awards.
The next line of code, print("Player with the most Player of the Match awards:"), prints the player with the most Player of the Match awards.
The next line of code, print(most_pom), prints the contents of the most_pom DataFrame.
The last few lines of code calculate the average number of runs scored by each Player of the Match. The code first uses the mean() function to calculate the average number of runs scored in each group. The reset_index() function then adds a new column Average_Runs_Scored containing the average number of runs scored in each group.
The code finally prints the average number of runs scored by each Player of the Match.

We can see that player AB de Villiers is the player with most of the Player of the Match awards.
These are just the basics of EDA analysis. In upcoming blogs of this series, we are going to learn about One Hot Encoding, Data Visualization, Prediction on player's stats, Complete Player's Data Visualization, Basic Machine Learning Algorithms implementations, and much more planned for you.
If you've not followed me yet, please support me by following and you can also not miss the further updates from me. Moreover, you can always comment down your doubts and share this with your friends who are interested in AI or just to pass the university exams.
Subscribe to my newsletter
Read articles from Manjunath Irukulla directly inside your inbox. Subscribe to the newsletter, and don't miss out.
Written by

Manjunath Irukulla
Manjunath Irukulla
I am a DevOps Enthusiast with Java DSA and Writing Skills