Creating Impactful QuickSight Dashboards for Data Visualization
 Amresh Kumar
Table of contents

Crafting Compelling QuickSight Dashboards: A Step-by-Step Guide
Step 1: Define Your Dashboard Objectives
- Before you start building your QuickSight dashboard, clearly define its purpose and objectives. What insights are you trying to convey? Who is the target audience? Understanding these factors will guide your design.
Step 2: Gather and Prepare Data
- Ensure you have the necessary data sources available in QuickSight. You can connect to various data sources like Amazon Redshift, Amazon RDS, CSV files, etc. Import, clean, and transform the data as needed.
Step 3: Create a New Dashboard
- In QuickSight, click on "Create" and select "Dashboard" to start a new project.
Step 4: Choose Visualizations
- Select appropriate visualizations to represent your data effectively. QuickSight offers various chart types, such as bar charts, line graphs, pie charts, and maps. Choose the ones that best convey your message.
Step 5: Add Visualizations to the Dashboard
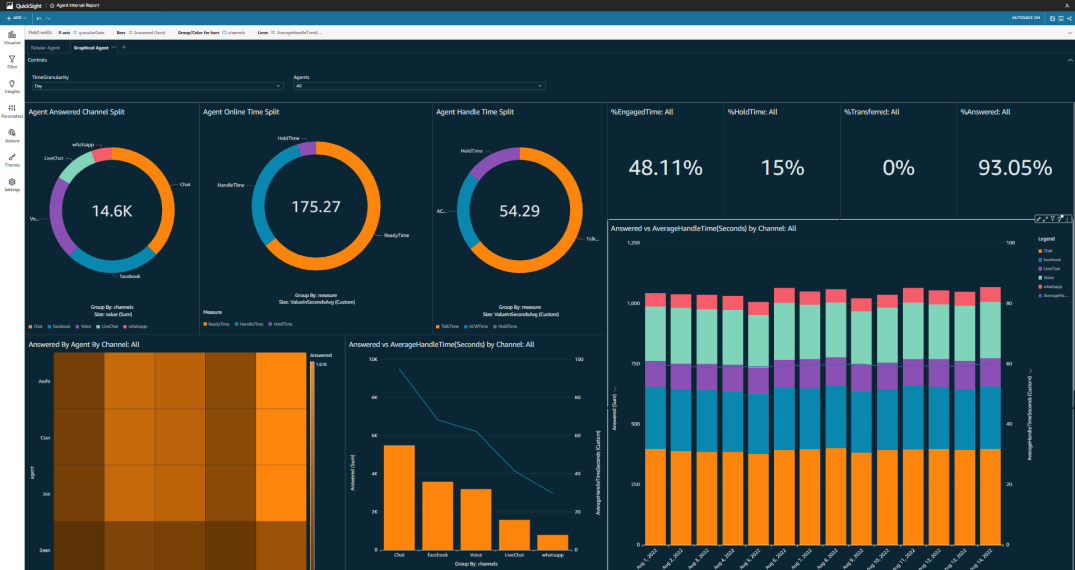
- Drag and drop the chosen visualizations onto the dashboard canvas. Organize them logically to tell a coherent story. Pay attention to layout and spacing for a clean and professional look.
Step 6: Configure Visualizations
- Customize each visualization by selecting the data fields, adjusting the formatting, and adding titles and labels. Use QuickSight's features like filters, groups, and calculated fields to refine the data representation.
Step 7: Create Interactivity
- Enhance user engagement by adding interactivity elements like filters, drop-down lists, and drill-down options. Allow users to explore the data and gain deeper insights.
Step 8: Apply Themes and Branding
- Maintain a consistent look and feel by applying themes and branding elements to your dashboard. Customize colors, fonts, and logos to align with your organization's style.
Step 9: Implement Data Security
- If necessary, set up data access controls and permissions to ensure that only authorized users can view or edit the dashboard. QuickSight provides robust security features for data protection.
Step 10: Test and Optimize
- Thoroughly test your dashboard to ensure that all visualizations are functioning correctly and delivering the intended insights. Optimize performance by minimizing data load times and responsiveness.
Step 11: Share and Collaborate
- Share your dashboard with stakeholders by publishing it or creating a QuickSight analysis. Collaborate with team members and gather feedback for further improvements.
Step 12: Monitor and Maintain
- Regularly monitor the dashboard's performance and data accuracy. Update the dashboard as needed to reflect changing data or business requirements.
Step 13: Gather User Feedback
- Continuously gather feedback from users to identify areas for improvement and make data-driven decisions about dashboard enhancements.
Creating an effective QuickSight dashboard is an iterative process. Be prepared to refine your design based on user feedback and evolving data needs to ensure that it continues to provide valuable insights to your audience.
Subscribe to my newsletter
Read articles from Amresh Kumar directly inside your inbox. Subscribe to the newsletter, and don't miss out.
Written by

Amresh Kumar
Amresh Kumar
Dev