Loki-Promtail-Grafana Installation guide
 Vinayak Salunkhe
What is Grafana?
Grafana is a powerful tool that helps users to visualize and analyse their data in a user-friendly way. It can be used to monitor infrastructure, applications, and services, as well as to create custom dashboards that provide insights into the performance of various systems. Grafana is an open-source data visualization and analytics platform that allows users to query, visualize, alert on, and understand their metrics no matter where they are stored. It is developed by Grafana Labs and has integrated support for over 15 popular databases and monitoring solutions. Grafana allows users to create, explore, and share beautiful dashboards with their team and foster a data-driven culture. It is widely used in the industry for operational dashboards, infrastructure monitoring, and application performance monitoring.
What is Loki and Promtail?
Loki is a horizontally scalable log aggregation system that stores and indexes log data for efficient querying and analysis.
Promtail is a lightweight agent responsible for gathering application logs and pushing them to Loki.
Why Grafana, Loki and Promtail?
Loki is a log aggregator system which collects application logs pushed by the Promtail and Grafana is a visualization tool to visualize and analyse the data in a user-friendly way.
Install Grafana on Debian or Ubuntu
Note:- You can use the same method to install the Grafana, Loki and Promtail on
Local Ubuntu OS 22.04 and
By creating an EC2 instance with AMI containing Ubuntu OS.
Commands >>
sudo apt-get install -y apt-transport-https
sudo apt-get install -y software-properties-common wget
sudo wget -q -O /usr/share/keyrings/grafana.key https://apt.grafana.com/gpg.key
For Stable release Grafana download command>>> Use stable release.
- echo "deb [signed-by=/usr/share/keyrings/grafana.key] https://apt.grafana.com stable main" | sudo tee -a /etc/apt/sources.list.d/grafana.list
##For Beta release Grafana download command>>> For new advanced features. (not stable)\>> Use stable release.
- #echo "deb [signed-by=/usr/share/keyrings/grafana.key] https://apt.grafana.com beta main" | sudo tee -a /etc/apt/sources.list.d/grafana.list
Update the list of available packages
- sudo apt-get update
Install the latest release Grafana:
- sudo apt-get install grafana
Commands to check
sudo /bin/systemctl status grafana-server
sudo /bin/systemctl start grafana-server
sudo /bin/systemctl status grafana-server
sudo /bin/systemctl enable grafana-server
sudo /bin/systemctl status grafana-server
Grafana should be Active: active (running) And enabled.
Create a directory and go inside it.
mkdir grafana-configs
cd grafana-configs/
Install Loki and Promtail using Docker
Download Loki Config
wget https://raw.githubusercontent.com/grafana/loki/v2.8.0/cmd/loki/loki-local-config.yaml -O loki-config.yaml
cat loki-config.yaml
Explanation of configuration file:-
auth_enabled: false: This line indicates that authentication is disabled, meaning that no credentials are required to access the system.
server:: This section defines the server configuration.
http_listen_port: 3100: It means loki will work on port number 3100. The server will listen on port 3100 for HTTP requests.
grpc_listen_port: 9096: If someone wants to push the data in loki then he will push data on port number 9096. The server will listen on port 9096 for gRPC requests.
common:: This section contains common configuration settings.
instance_addr: 127.0.0.1: Loki’s instance address will be 127.0.0.1 which is the local host for this case. The IP address of the instance is set to 127.0.0.1, which is the loopback address for the local machine.
path_prefix: /tmp/loki: The path prefix specifies the directory where Loki will store its data.
storage:: This section defines the storage configuration.
filesystem:: Loki will use the filesystem as its storage backend.
chunks_directory: /tmp/loki/chunks: The chunks directory specifies where Loki will store its data chunks.
rules_directory: /tmp/loki/rules: The rules directory specifies where Loki will store its rule files.
replication_factor: 1: The replication factor determines how many copies of each chunk will be stored for redundancy. In this case, there is only one copy.
ring:: This section defines the ring configuration.
kvstore:: Loki uses an in-memory key-value store for its ring configuration.
store: inmemory: The key-value store is set to in-memory, meaning that it will be stored in RAM rather than on disk.
query_range:: This section configures the query range settings.
results_cache:: The results cache configuration determines how query results are cached.
cache:: Loki uses an embedded cache for query results.
enabled: true: The cache is enabled, allowing query results to be stored and retrieved more quickly.
max_size_mb: 100: The maximum size of the cache is set to 100 megabytes.
schema_config:: This section configures the schema settings for Loki.
configs:: Loki supports multiple schema configurations, and this line indicates that there is at least one configuration defined.
- from: 2020-10-24: This line specifies the start date for this schema configuration, which is October 24, 2020.
store: boltdb-shipper: The data store used by this schema configuration is boltdb-shipper, which is a distributed key-value store built on top of BoltDB.
object_store: filesystem: The object store used by this schema configuration is the filesystem, meaning that data will be stored as files on disk.
schema: v11: This line specifies the version of the schema being used, which is version 11.
index:: This section configures indexing settings for this schema configuration.
prefix: index_: Index files created by Loki will have a prefix of “index_”.
period: 24h: Index files will cover a time period of 24 hours before being rotated and replaced with new index files.
Note:- We are using docker to run Loki and Promtail as containers, so that we can have a link between them, to communicate with each other to share the data.
Install Docker:-
sudo apt install docker.io
sudo chown $USER /var/run/docker.sock
$USER is an environment variable which will tell you your current user. “docker.sock” is a socket file which will help to communicate with the docker API. So it needs permission.
- docker ps -a
Run Loki Docker container
- docker run -d --name loki -v $(pwd):/mnt/config -p 3100:3100 grafana/loki:2.8.0 --config.file=/mnt/config/loki-config.yaml
**Note-**We are using docker volume -v $(pwd):/mnt/config to copy the data from $(pwd) present working directory to /mnt/config path inside the container. To copy the configuration files from the current directory to the inside container.
Go to the AWS dashboard and open the security group open port range 3100 and source anywhere.
Check the status of the container. If it is exited check logs. Make sure you are running all the commands under the “grafana-configs” directory.
- docker ps
Download Promtail Config file
wget https://raw.githubusercontent.com/grafana/loki/v2.8.0/clients/cmd/promtail/promtail-docker-config.yaml -O promtail-config.yaml
cat promtail-config.yaml
Explanation of configuration file:-
server:: This section defines the server configuration.
http_listen_port: 9080: The server will listen on port 9080 for HTTP requests.
grpc_listen_port: 0: The server will not listen on any specific port for gRPC requests.
positions:: This section specifies the position file configuration.
filename: /tmp/positions.yaml: The position file is set to /tmp/positions.yaml, which is the file where Promtail will store the positions of log entries it has read.
clients:: This section defines the client's configuration.
- url: http://loki:3100/loki/api/v1/push: The URL specified here is the endpoint where Promtail will push logs to Loki. In this case, it is set to http://loki:3100/loki/api/v1/push.
scrape_configs:: This section configures the scraping targets for Promtail.
- job_name: system: This line specifies the name of the job, which is set to “system” in this case.
static_configs:: This section defines the static configurations for scraping targets.
- targets:: The targets section specifies the list of targets to scrape logs from. In this case, it is set to localhost, meaning that Promtail will scrape logs from the local machine.
labels:: The labels section allows you to add additional metadata or labels to scraped logs. In this case, it sets the job label to “varlogs” and uses a wildcard pattern (__path__) to specify that all log files in the /var/log/ directory should be scraped.
Run Promtail Docker container
- docker run -d --name promtail -v $(pwd):/mnt/config -v /var/log:/var/log --link loki grafana/promtail:2.8.0 --config.file=/mnt/config/promtail-config.yaml
Note:- If the container is already present then first start the Loki container and then start the “grafana/promtail” container. Use the below command.
- docker start container-id
Check the Grafana dashboard
Open the browser
Type localhost:3000 (If you are running on your local Ubuntu OS)
Copy ec2-public-ip and paste it into the browser and open ec2-public-ip:3000
Add data source type in the URL http://localhost:3100
Check the below screenshot for your reference.
Click on Save and test, you will get message like below
Click on dashboard > New dashboard > select data source as Loki.
Select label filters as shown below and run query > Select visualization of your choice and boom. You will get the screen below.
- If EC2 instance
- If Grafana, Loki and Promtail are installed on the local Ubuntu OS 22.04 then you will get the below screen
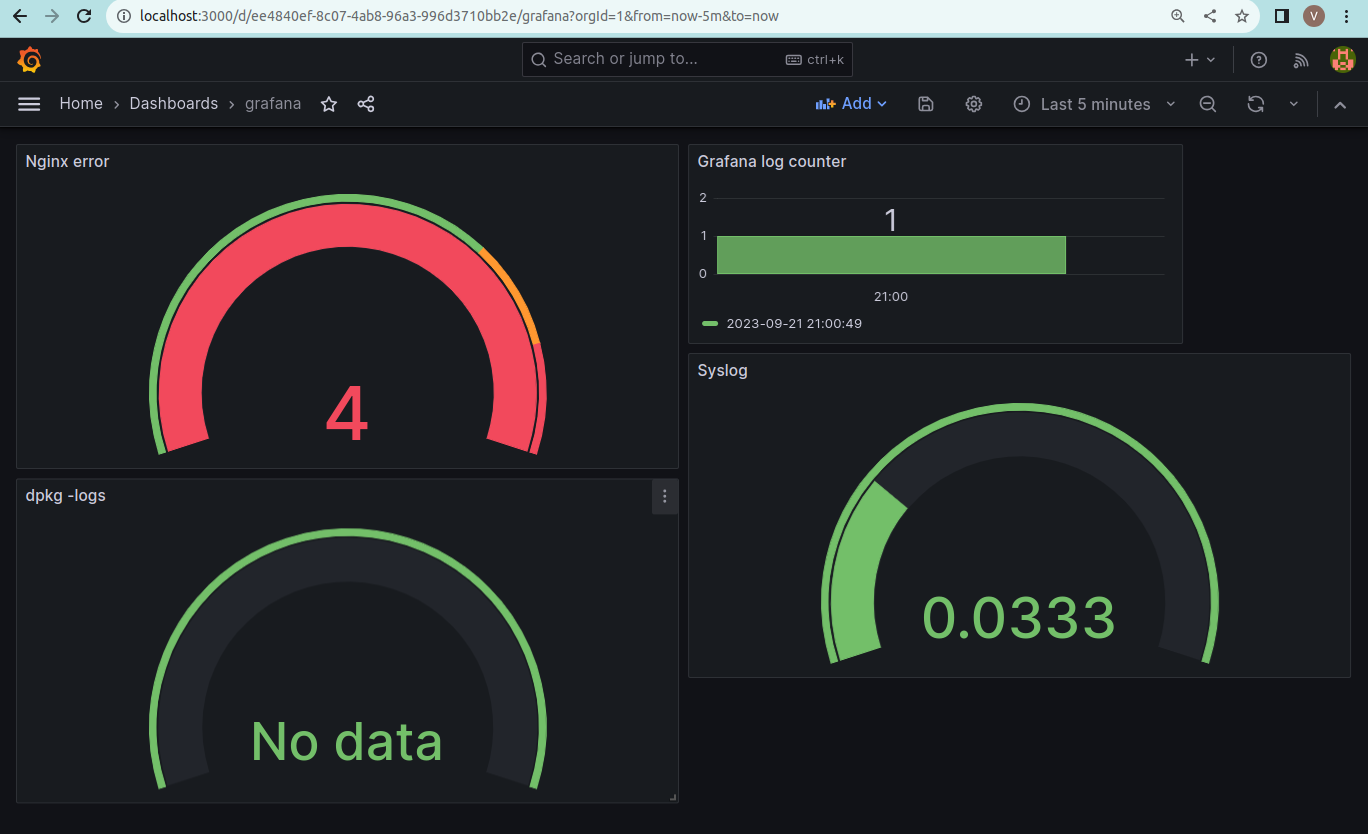
Dashboard Look:-

I hope you enjoy the blog post!
If you do, please show your support by giving it a like 👍🏻, leaving a comment 💬, and spreading the word 📢 to your friends and colleagues 🙂
Subscribe to my newsletter
Read articles from Vinayak Salunkhe directly inside your inbox. Subscribe to the newsletter, and don't miss out.
Written by

Vinayak Salunkhe
Vinayak Salunkhe
DevOps Engineer with 8+ Years of Experience | AWS, Azure DevOps, Linux | CKA & RHCSA Certified | Docker+K8S Expert