SQL Capstone Project: Company Sales Analysis for 2020-2022.
 Ndubuisi Henry Aneke
Overview
This project was aimed at using provided company data to provide answers to the provided business requirements. The project was carried out using SQL and specifically MS-SQL RDBMS 2019.
Business Requirements
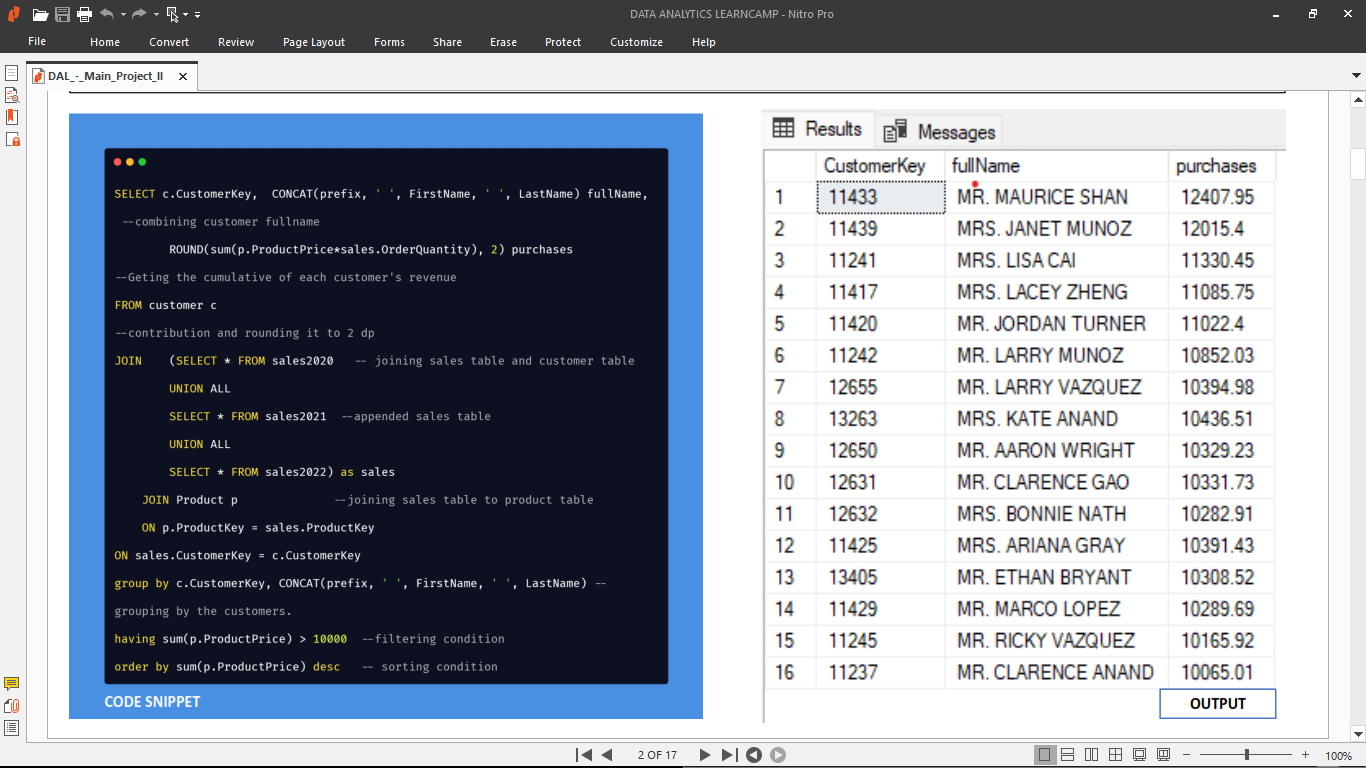
1. Retrieve the customers who have placed orders with a total amount greater than $10000.
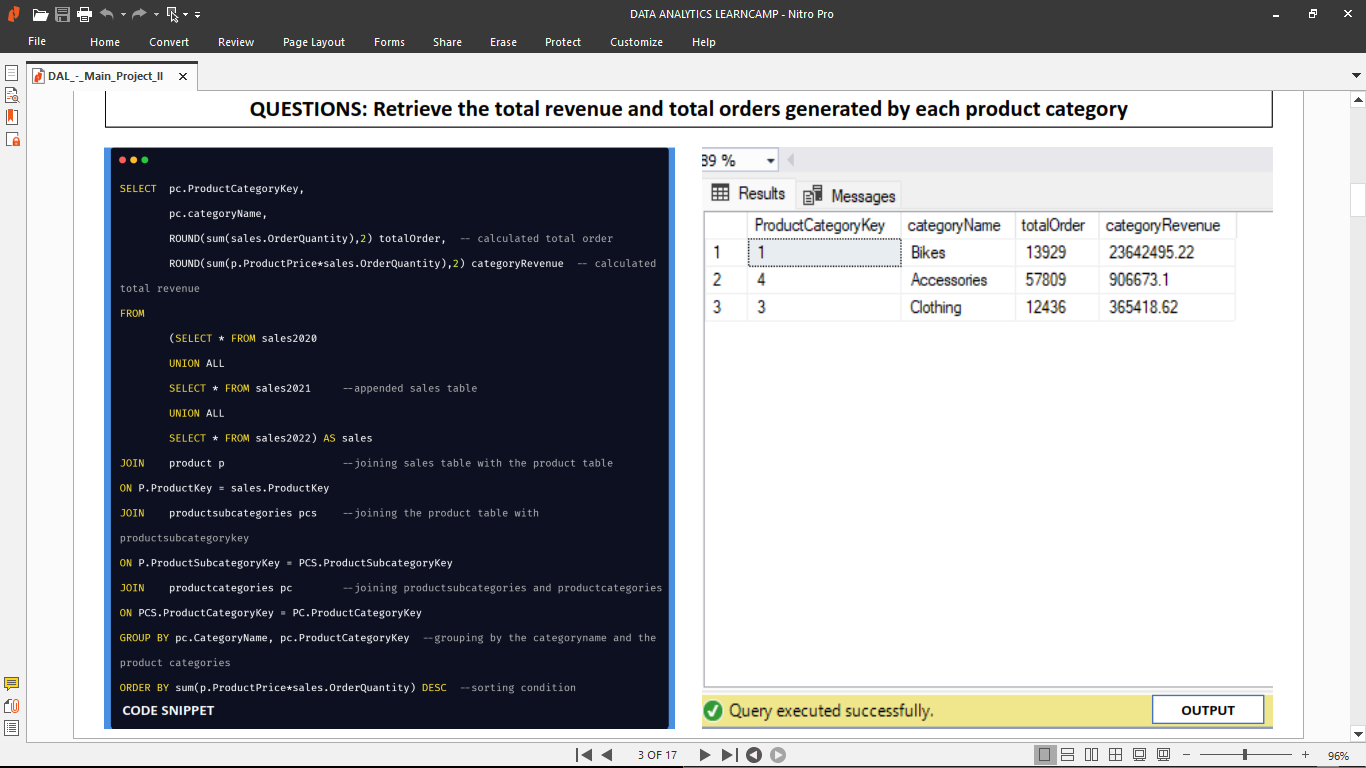
2. Retrieve the total revenue and total orders generated by each product category
3. Retrieve the names of products, sub-categories and their categories for products with a selling price greater than the average selling price of all products. - SQ
4. How many customers have placed orders in “Canada”? List the customer names - SQ
5. Find the 10 products that have been returned the most. How much money was generated by these products? - SQ
6. Get a list of customers who have placed orders in more than one territory.
7. Retrieve the product names and their corresponding sub-categories for products that have been ordered at least 10 times.
8. List the customer names who have placed orders after 2021. What is the distribution of their occupation?
9. Get a list of products and their corresponding order quantities for products that have been ordered at least 5 times.
10. Retrieve the product names that start with the letter "C" or “H” and are from the "Clothing" category.
11. Retrieve the product names that have been ordered in the ‘United States’ or "Australia".
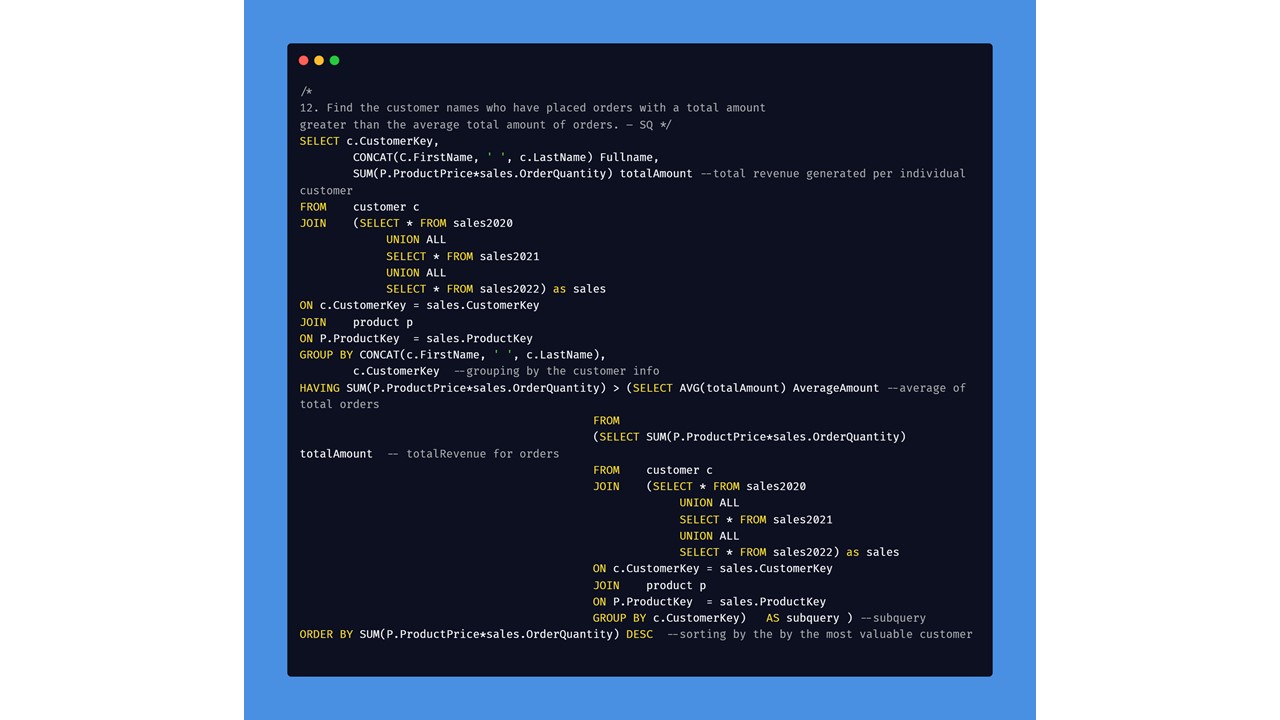
12. Find the customer names who have placed orders with a total amount greater than the average total amount of orders. – SQ
13. Retrieve the top 5 customers who have placed the highest number of orders, along with their order counts.
14. List the customers who have placed orders within the last 6 months (consider the last date in the data)
15. We want to reach out to our best customers in 2022. Can you get emails of top 50 customers based on revenue?
Data Gathering/ Source
The data set used for the analysis was provided by my Facilitator and it consisted of 10 diverse datasets comprising different attributes about customers, sales, products, product categories, product subcategories, territory and calendar. Use the link to access the datasets.
Data Preparation
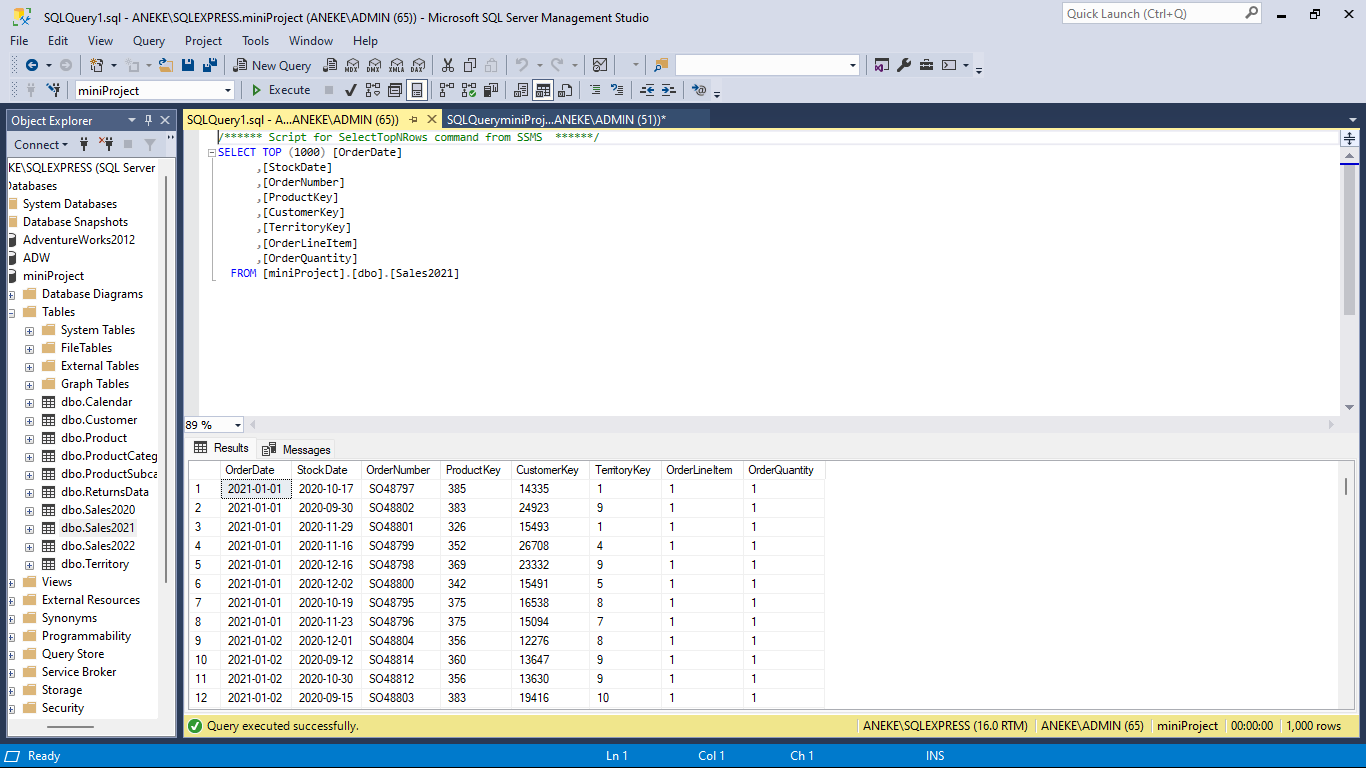
I started by creating a database for my analysis and named it appropriately, I proceeded to import the data set into my database (MS-SQL) using the task and import flat file option, since the file extension was .csv, I had to import them one after the other and renamed the datasets to enable me easily reference it. I then started to explore each dataset by using the SELECT TOP 1000 Row to understand my datasets and get a glimpse of the relationships, the quality of the data and the attributes they contain.
Data Manipulation
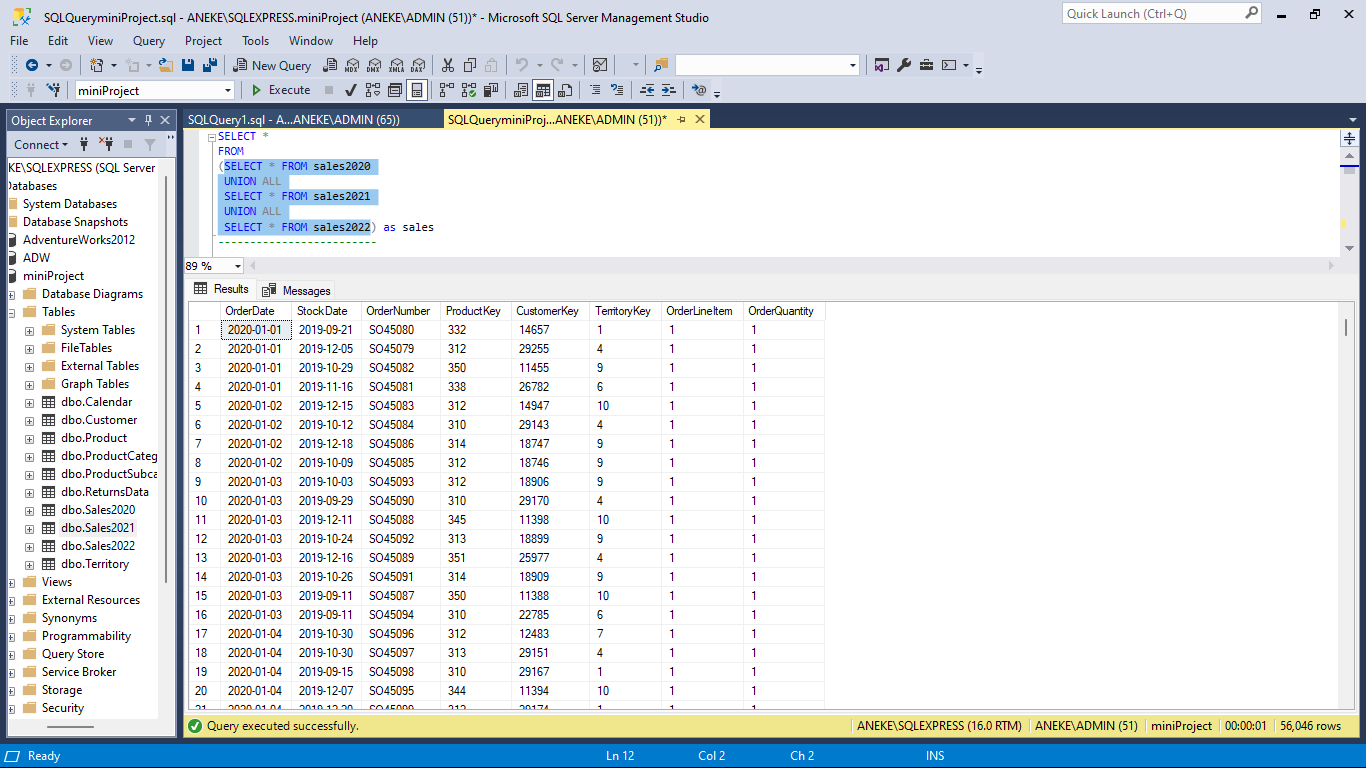
I used Union All, Join and other functions such as CONCAT, to append, merge and create new attributes as appropriate for my analysis. I also used subqueries to create temporary tables and functions to manipulate and perform calculations within the columns.
SELECT *
FROM
(SELECT * FROM sales2020
 UNION ALL
 SELECT * FROM sales2021
 UNION ALL
 SELECT * FROM sales2022) as sales
SELECT c.CustomerKey,
        CONCAT(prefix, ' ', FirstName, ' ', LastName) fullName,
        --combining customer fullname
        ROUND(sum(p.ProductPrice*sales.OrderQuantity), 2) purchases                --Geting the cumulative of each customer's revenue
FROM customer c                                                                    --contribution and rounding it to 2 dp
JOIN    (SELECT * FROM sales2020   -- joining sales table and customer table
        UNION ALL
        SELECT * FROM sales2021  --appended sales table
        UNION ALL
        SELECT * FROM sales2022) as sales
    JOIN Product p                --joining sales table to product table
    ON p.ProductKey = sales.ProductKey
ON sales.CustomerKey = c.CustomerKey
GROUP BY c.CustomerKey,
        CONCAT(prefix, ' ', FirstName, ' ', LastName)
        -- grouping by the customers.
HAVING SUM(p.ProductPrice) > 10000  --filtering condition
ORDER BY SUM(p.ProductPrice) DESC    -- sorting condition
Data Analysis
For my data analysis, I majorly used the the Data Query Language -DQL which includes the SELECT, FROM, JOIN, ON, WHERE, GROUP, HAVING, ORDER BY, AGGREGATE FUNCTIONS, UNION ALL and SUBQUERY on the RDMS to interact with the datasets.
To get the full analysis and queries used, kindly view the attached presentation report for details.
Thank you for being part of this journey with me, and I look forward to sharing more discoveries as I delve deeper into the world of Data Analysis.
Report Preview
Subscribe to my newsletter
Read articles from Ndubuisi Henry Aneke directly inside your inbox. Subscribe to the newsletter, and don't miss out.
Written by
