"Unlocking Power of Prometheus and Grafana: Visualizing Data Magic"
 Parvaze Masud
Table of contents
- Introduction
- Prometheus: The Observability Powerhouse
- Key Features of Prometheus:
- Grafana: The Visualization Masterpiece
- Key Features of Grafana:
- Benefits of Prometheus and Grafana Monitoring
- Install and Configure Prometheus, Grafana, and Node Exporter
- How to Download and Install Prometheus
- Install and Configure Node Exporter on the Client
- Configure Prometheus to Monitor Client Nodes
- Install and Deploy the Grafana Server
- Integrate Grafana and Prometheus
- Final Step: Importing a Grafana Dashboard
Introduction
In today's rapidly evolving technological landscape, staying ahead of potential issues and ensuring the seamless performance of your applications and infrastructure is paramount. Monitoring, an integral part of DevOps and system administration, has seen a dramatic shift in recent years, with tools like Prometheus and Grafana emerging as a dynamic duo to meet the demands of modern monitoring. In this blog, we'll explore the power of Prometheus and Grafana and how they work together to provide robust monitoring solutions.
Prometheus: The Observability Powerhouse
Prometheus is an open-source monitoring and alerting toolkit initially developed by SoundCloud. It's designed with a focus on reliability, scalability, and simplicity, making it a go-to choice for organizations of all sizes.
Key Features of Prometheus:
Multi-dimensional Data Model: Prometheus adopts a data model where time-series data is identified by a metric name and a set of key-value pairs called labels. This allows for highly flexible and efficient querying.
Scalability: Prometheus is designed to be highly scalable. It can collect metrics from thousands of machines with minimal overhead.
Alerting: Prometheus comes with a powerful alerting system that allows you to define custom alerts based on your metrics and thresholds. It supports alert notifications via various channels like email, Slack, or custom integrations.
Service Discovery: Dynamic service discovery is a breeze with Prometheus. It can automatically discover and scrape metrics from new instances as they come online.
Powerful Query Language: PromQL (Prometheus Query Language) enables complex queries for slicing and dicing your metrics data.
Grafana: The Visualization Masterpiece
Grafana, an open-source platform for monitoring and observability, complements Prometheus by providing a beautiful and customizable user interface for visualizing your metrics.
Key Features of Grafana:
Rich Dashboards: Grafana allows you to create visually appealing dashboards with various panels like graphs, tables, and gauges. It supports templates for dynamic dashboards.
Alerting and Notifications: Just like Prometheus, Grafana supports alerting. You can set up alert rules and receive notifications via various channels.
Data Source Integration: Grafana is incredibly flexible when it comes to data sources. While Prometheus is a natural choice, Grafana can connect to a wide range of other data sources like InfluxDB, Elasticsearch, and more.
Plugins and Extensibility: Grafana has a vibrant community and a plugin ecosystem that enables you to extend its functionality. You can find plugins for various data sources, panels, and integrations.
Benefits of Prometheus and Grafana Monitoring
Real-time Visibility: Prometheus and Grafana provide real-time insights into your system's performance, helping you spot issues before they become critical.
Customization: You have full control over how you visualize your metrics. Create dashboards tailored to your specific needs and preferences.
Scalability: Both Prometheus and Grafana are designed to scale as your infrastructure grows. They can handle large volumes of data without sacrificing performance.
Community and Support: Both tools have active communities and extensive documentation, making it easy to find help and resources.
Cost-Efficiency: Being open-source tools, Prometheus and Grafana are cost-effective monitoring solutions, reducing the need for expensive proprietary solutions.
Install and Configure Prometheus, Grafana, and Node Exporter
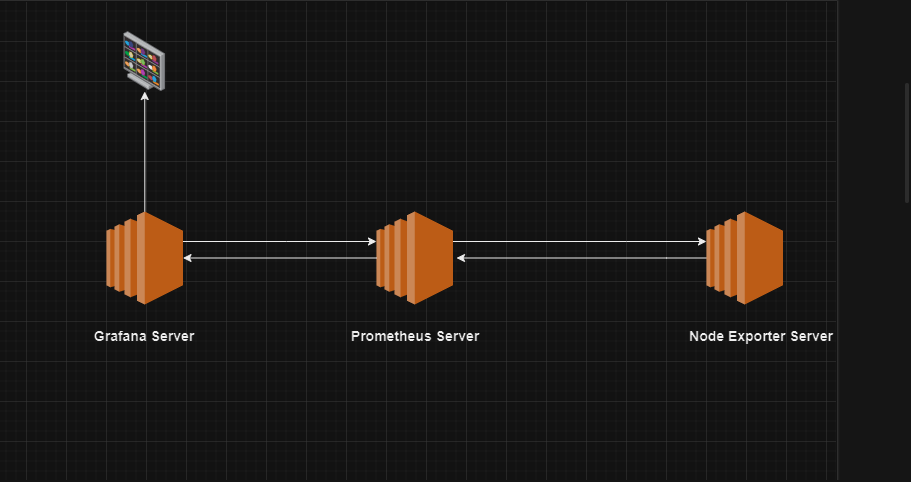
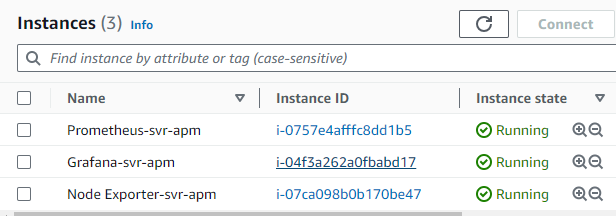
Here we use three different servers to deploy this monitoring system.
To configure the end-to-end solution, the following steps are required.
Download and install Prometheus on the monitoring system.
Configure Prometheus to run as a service.
Install Node Exporter on all clients and run as a service.
Configure Prometheus to monitor the clients.
Install and deploy the Grafana server.
Integrate Grafana and Prometheus.
Import a Dashboard for the Node Exporter Statistics.
This guide is designed for Centos, RHEL, Fedora, and Amazon Linux 2.
How to Download and Install Prometheus
Prometheus can be downloaded as a precompiled binary from the GitHub repository. The Prometheus Downloads repository lists the most recent release of Prometheus. The Prometheus GitHub page also provides instructions on how to build Prometheus from the source code or run it as a Docker container. To download Prometheus, follow these steps.
Visit the Prometheus downloads and make a note of the most recent release. The most recent LTS release is clearly indicated on the site.
First, change the Directory.
cd /opt/Use
wgetto download Prometheus to the monitoring server.wget https://github.com/prometheus/prometheus/releases/download/v2.45.0-rc.0/prometheus-2.45.0-rc.0.linux-amd64.tar.gzExtract the archived Prometheus files.
tar -xzvf prometheus-2.45.0-rc.0.linux-amd64.tar.gz(Optional) Rename directory.
mv prometheus-2.45.0-rc.0.linux-amd64 prometheusNow copy this directory to
/etc/directory.cp -r prometheus /etc/cd /etc/prometheus/Create a Prometheus user. The following command creates a system user.
useradd --no-create-home --shell /bin/false prometheusMake a Directory on the following location.
mkdir /var/lib/prometheus -pAssign ownership of the directory created in the previous section to the new Prometheus user.
chown prometheus:prometheus /var/lib/prometheus/Copy the
prometheuspromtooldirectories to the/usr/local/bin/directory. This makes Prometheus accessible to all users.cp prometheus /usr/local/bin/ cp promtool /usr/local/bin/Assign ownership permission.
  chown prometheus:prometheus /usr/local/bin/prometheus
  chown prometheus:prometheus /usr/local/bin/promtool
To allow Prometheus to run as a service, create a
prometheus.servicefile using the following command:vim /etc/systemd/system/prometheus.serviceEnter the following content into the file:
  [Unit]
  Description=Prometheus
  Wants=network-online.target
  After=network-online.target

  [Service]
  User=prometheus
  Group=prometheus
  Type=simple
  ExecStart=/usr/local/bin/prometheus \
      --config.file /etc/prometheus/prometheus.yml \
      --storage.tsdb.path /var/lib/prometheus/ \
      --web.console.templates=/etc/prometheus/consoles \
      --web.console.libraries=/etc/prometheus/console_libraries

  [Install]
  WantedBy=multi-user.target
Reload the
systemctldaemon.systemctl daemon-reloadUse
systemctlenable to configure themprometheus.serviceto automatically start when the system boots. If this command is not added, Prometheus must be launched manually.systemctl enable prometheusStart the
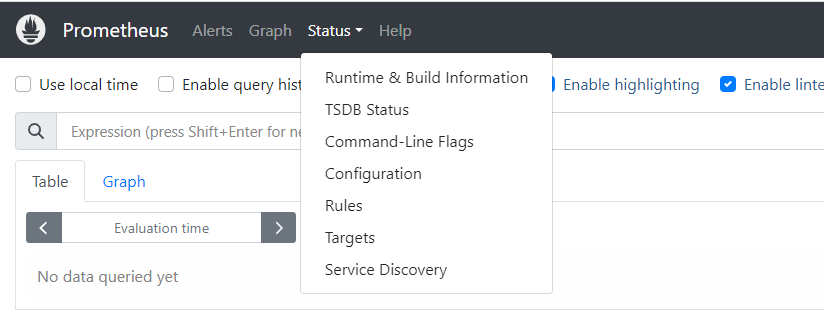
prometheus.servicestatus to ensure it is active.systemctl start prometheus systemctl status prometheusFirst, select the status option, then go to Targets.

Install and Configure Node Exporter on the Client
In order to monitor a remote system, it's essential to set up a client that can gather statistics. There are various third-party clients to choose from, but for simplicity and compatibility, Prometheus highly recommends using the Node Exporter client. Once you've installed Node Exporter on your client, you can easily include the client in the list of servers to be scraped in your prometheus.yml configuration file.
Please check the Prometheus downloads page's Node Exporter section to identify the most recent release.
Change the directory then use wget to download this release.
cd /opt/ && sudo wget https://github.com/prometheus/node_exporter/releases/download/v1.6.1/node_exporter-1.6.1.linux-amd64.tar.gzExtract the application.
tar -xzvf node_exporter-1.6.1.linux-amd64.tar.gz(Optional) Rename the downloaded file.
mv node_exporter-1.6.1.linux-amd64 node_exporterChange this directory.
cd node_exporterCopy the executable
usr/local/binso it is accessible throughout the system.cp node_exporter /usr/local/bin/Running Node Exporter as a service is a more convenient option. To do so, start by establishing a user account named "nodeuser"
adduser -rs /bin/false nodeuserGenerate a service file for
systemctlusage with the name "node_exporter.service," structured as outlined below. Many of the fields will resemble those in theprometheus.servicefile, as explained in the preceding section.vim /etc/systemd/system/node_exporter.service[Unit] Description=Node Exporter After=network.target [Service] User=nodeuser Group=nodeuser Type=simple ExecStart=/usr/local/bin/node_exporter [Install] WantedBy=multi-user.targetReload the
systemctldaemon.systemctl daemon-reloadUse
systemctlenable to configure and run it to automatically start when the system boots. If this command is not added,node_exporter.servicemust be launched manually.systemctl enable node_exporterStart Node Exporter, and verify its status. The service should be active.
  systemctl start node_exporter
  systemctl status node_exporter
Configure Prometheus to Monitor Client Nodes
The client nodes are now prepared for monitoring. To incorporate these clients into your prometheus.yml configuration, please follow the steps outlined below:
On the monitoring server running Prometheus, open
prometheus.ymlfor editing.vim /etc/prometheus/prometheus.ymlLocate the section entitled
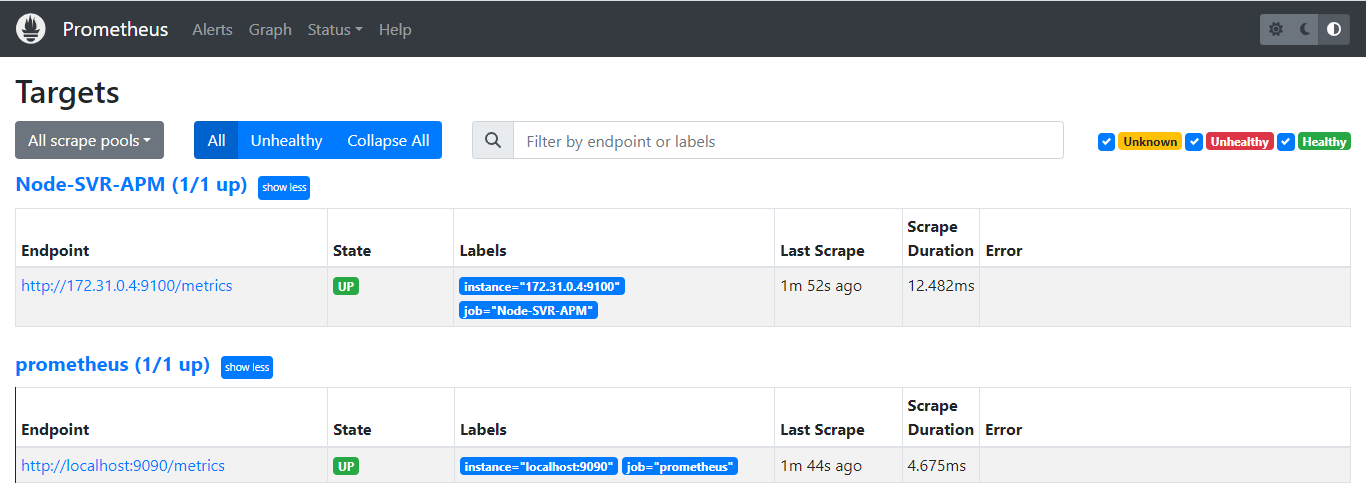
scrape_configs:, which contains a list of jobs. It currently lists a single job namedprometheus. This job monitors the local Prometheus task on the port9090The entry should resemble the following example. Replace 172.31.0.4:9100 with the actual IP address of the client server.

To immediately refresh Prometheus, restart the
prometheusservice.systemctl restart prometheus
Using a web browser, go back to the Prometheus web portal, which is accessible at port 9090 on the monitoring server. From there, click on "Status," and then choose "Targets." You'll notice a second link for the "Node-SVR-APM" job, which leads to port 9100 on the client. Click on this link to review the statistics.
Install and Deploy the Grafana Server
At this point, Prometheus is actively gathering statistics from the clients listed in the "scrape_configs" section of its configuration file. Nonetheless, the data is currently accessible only as a raw data dump. This raw data is challenging to interpret and lacks practical utility.
Grafana provides an interface for viewing the statistics collected by Prometheus. if we want, we can use the same server to install and configure Grafana. we will go for a different server.
First, we create a repo for Grafana.
vim /etc/yum.repos.d/grafana.repoEnter the following content into the file:
  [grafana]
  name=grafana
  baseurl=https://packages.grafana.com/oss/rpm
  repo_gpgcheck=1
  enabled=1
  gpgcheck=1
  gpgkey=https://packages.grafana.com/gpg.key
  sslverify=1
  sslcacert=/etc/pki/tls/certs/ca-bundle.crt
Enter the following commands step by step.
  yum repolist
  yum install grafana
  systemctl start grafana-server
  systemctl enable grafana-server
  systemctl status grafana-server
Integrate Grafana and Prometheus
All the system components are installed, but Grafana and Prometheus have not been configured to work together yet. The remaining configuration steps, such as linking Prometheus as the data source and importing a dashboard panel, can be completed through the Grafana web interface.
To integrate Grafana and Prometheus, follow the steps below:
Using a web browser, visit the port
3000of the monitoring server. For example,http://your-server-ip:3000replacingyour-server-ipwith the actual IP address. Grafana displays the login page. Use the user nameadminand the default passwordpassword. Change the password to a more secure value when prompted.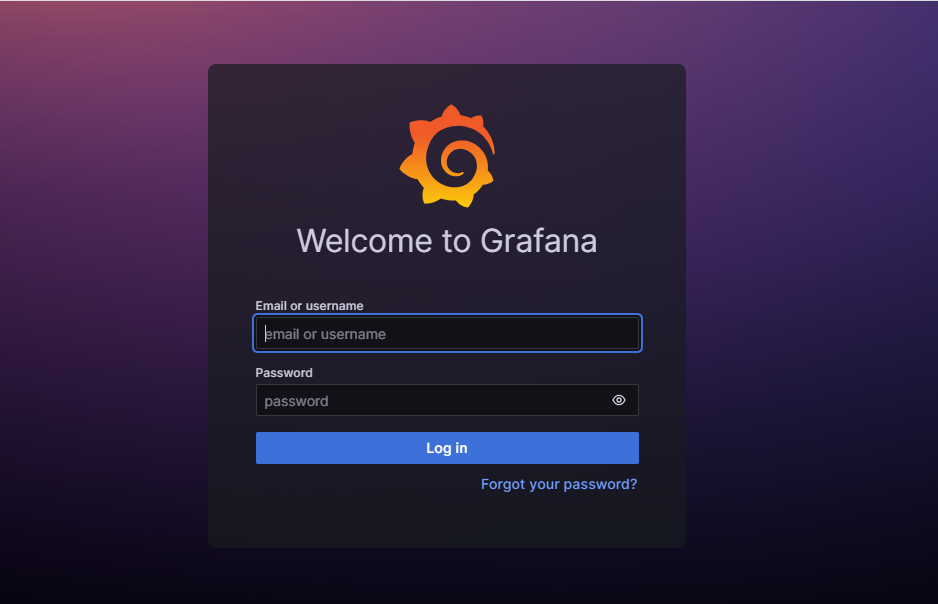
Following a successful password change, Grafana presents the Grafana Dashboard.
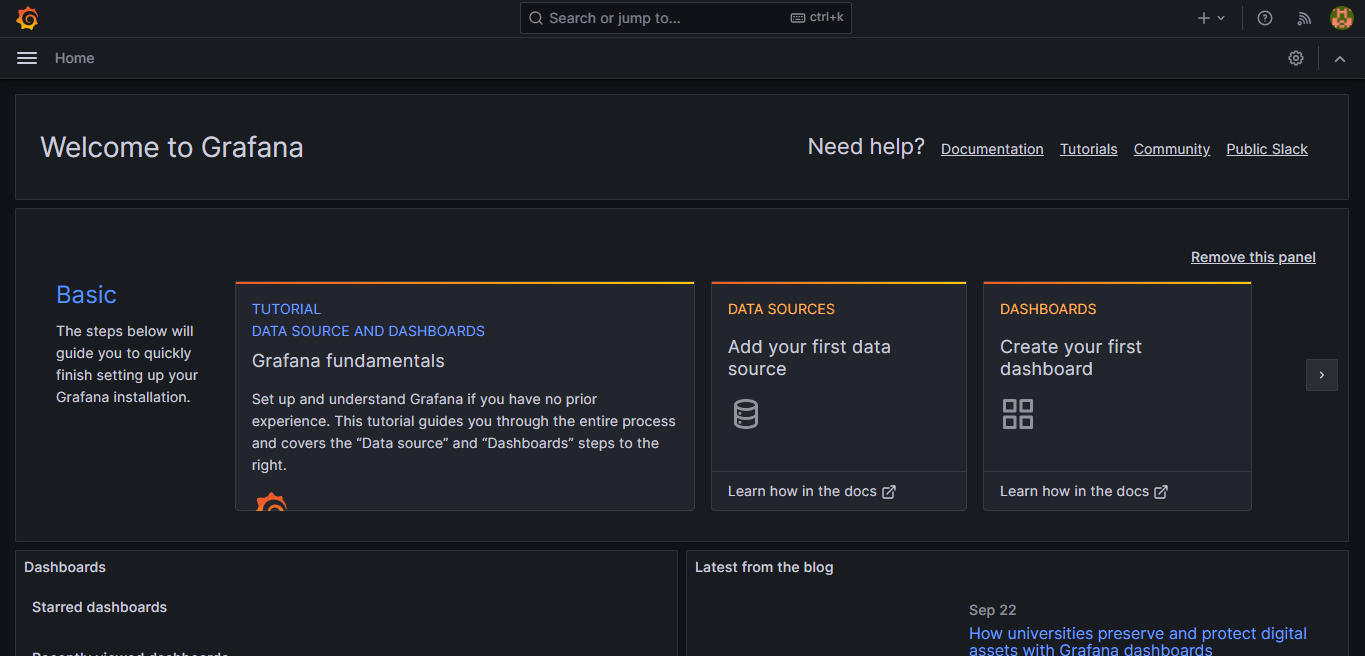
To include Prometheus as a data source, click on Data Sources.
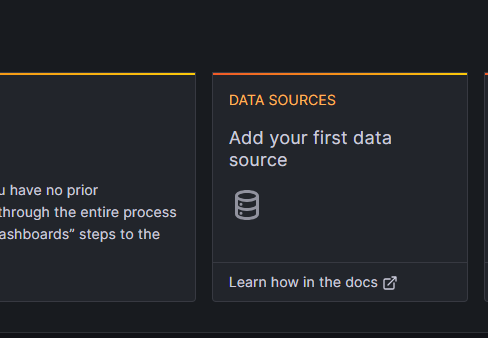
Click the Add data source button.
Choose Prometheus as the data source.

To configure a local Prometheus source, as explained in this guide, set the URL to http://your-server-ip:9090. You can leave most of the other settings at their default values.
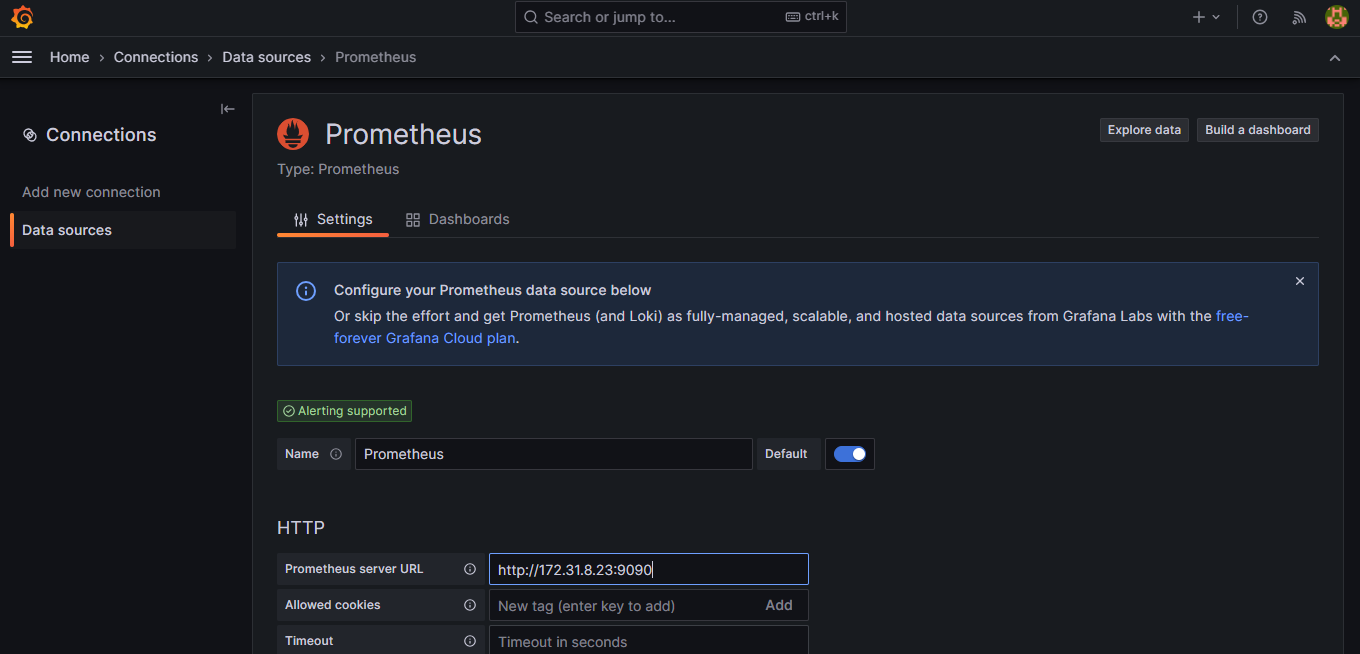
Select the Save & test button at the bottom of the screen.
If all settings are correct, Grafana confirms the
Data source is working.
Final Step: Importing a Grafana Dashboard
It is certainly possible to create a custom dashboard. However, Prometheus has already created a dashboard to support the Node Exporter statistics. It is much less work to import this premade dashboard than to create a custom one.
Visit the Grafana Dashboard Library. Enter
Node exporteras the search term.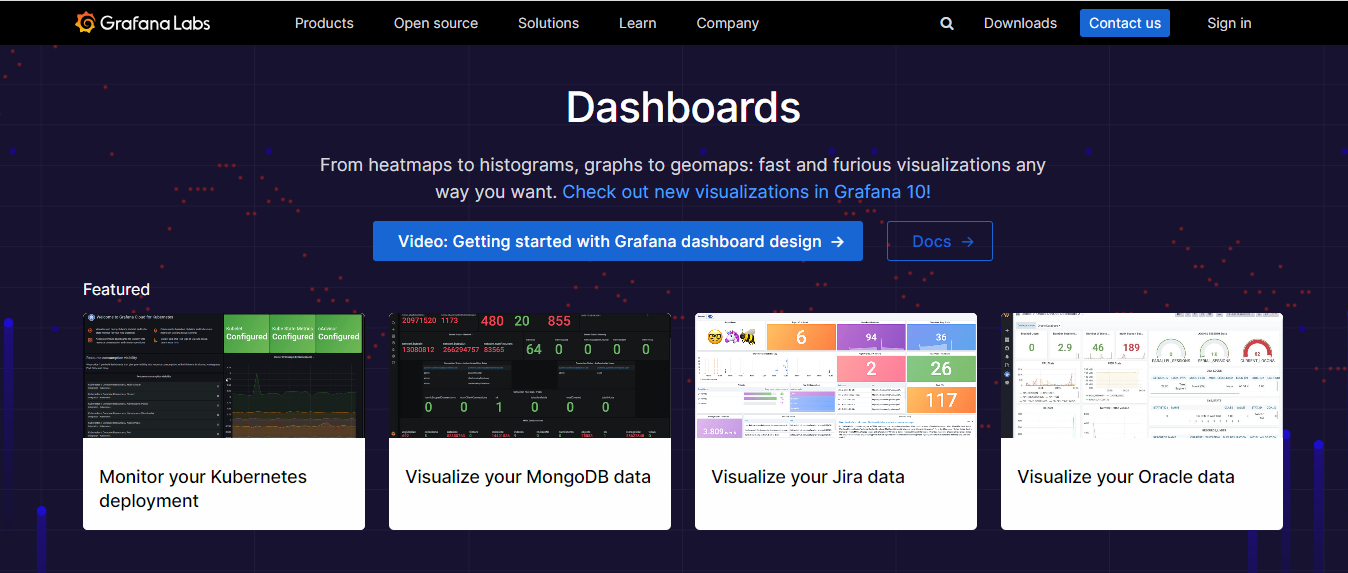
Now select the
Node Exporter Full.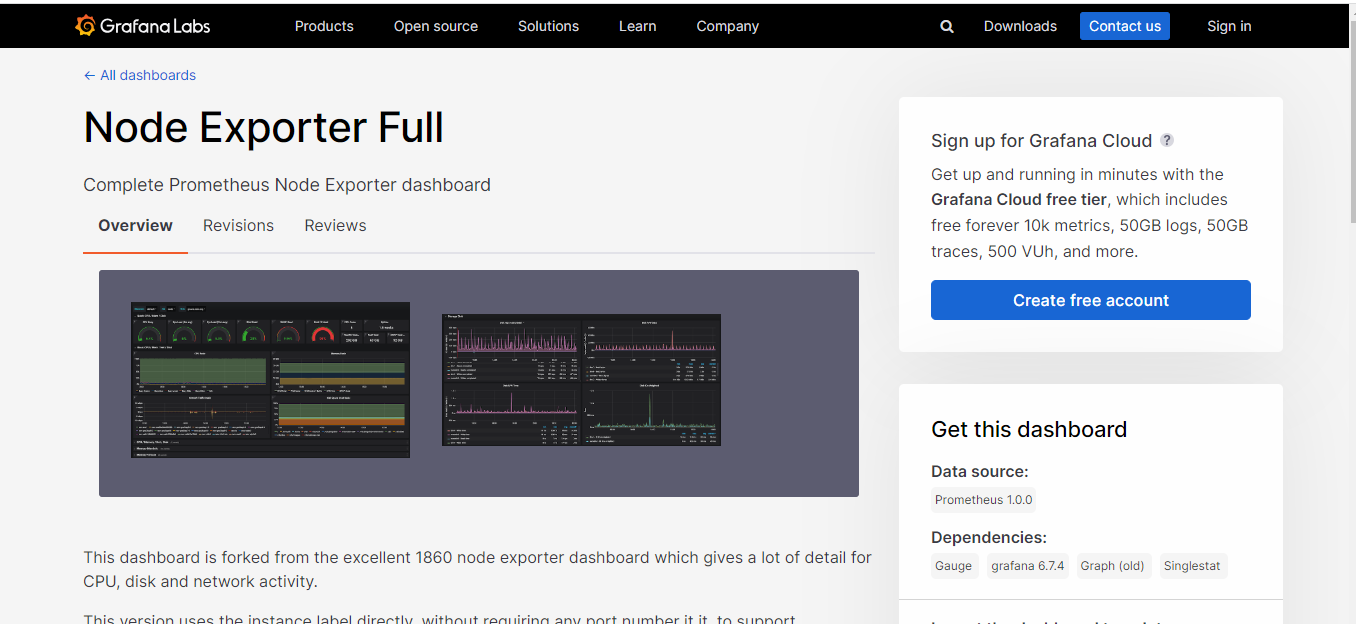
Take note of the identification number, or use the button to copy it to the clipboard. Presently, the ID for this board is 1860.
Go back to the Grafana dashboard. Click on the Dashboard icon, represented by four squares, and then the
Importoption.
Within the
"Import viagrafana.com"box, input the ID 1860 obtained in the previous step. Subsequently, click on the Load button.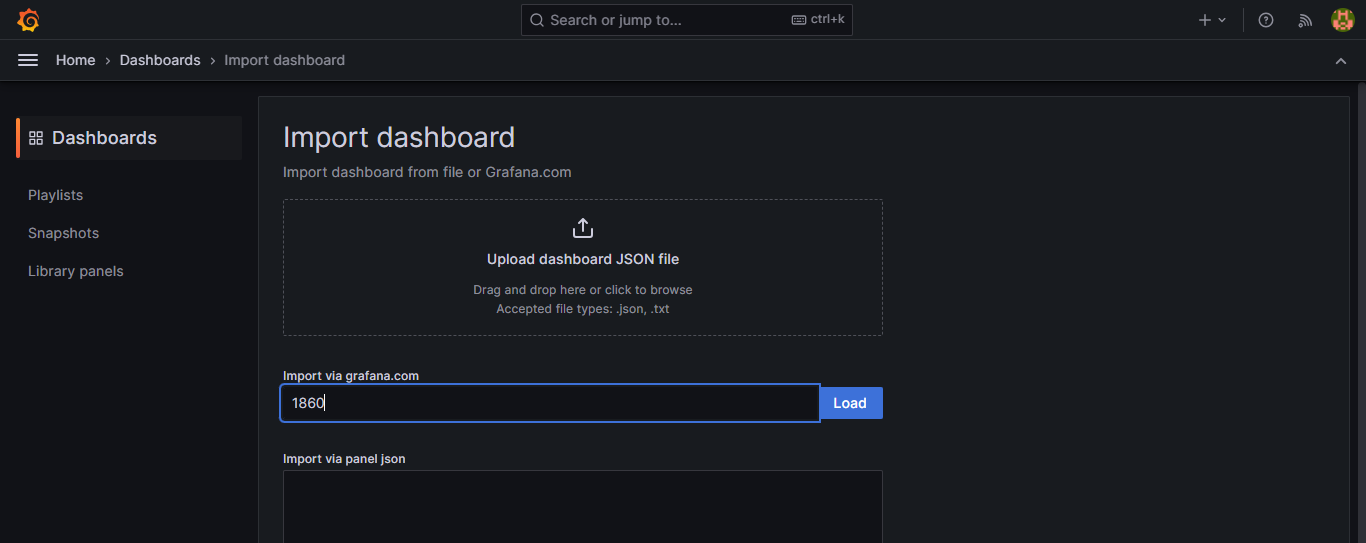
At the next screen, confirm the import details. Choose Prometheus as the data source and click the Import button.
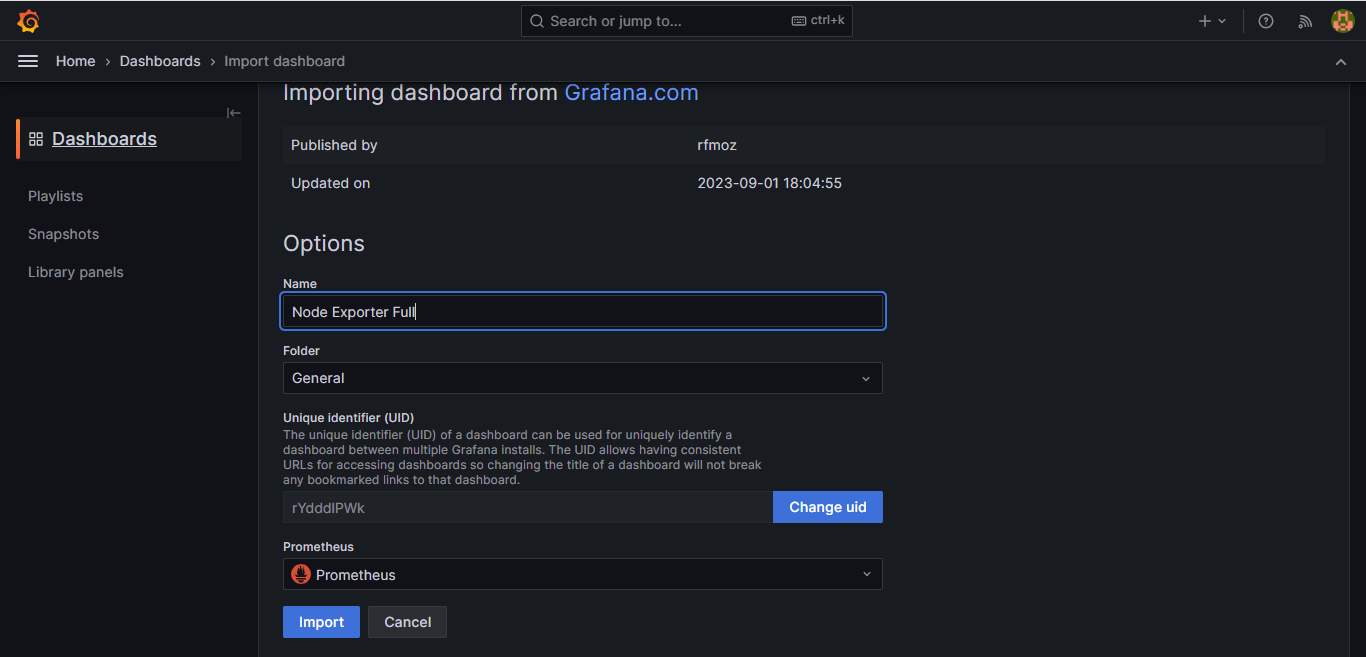
The Node Exporter Full dashboard becomes active immediately, showcasing performance metrics and the status of the client node, which includes Memory, RAM, and CPU information. On the top of the screen, you'll find several drop-down menus that enable users to choose the host they want to monitor and the time period they wish to focus on.
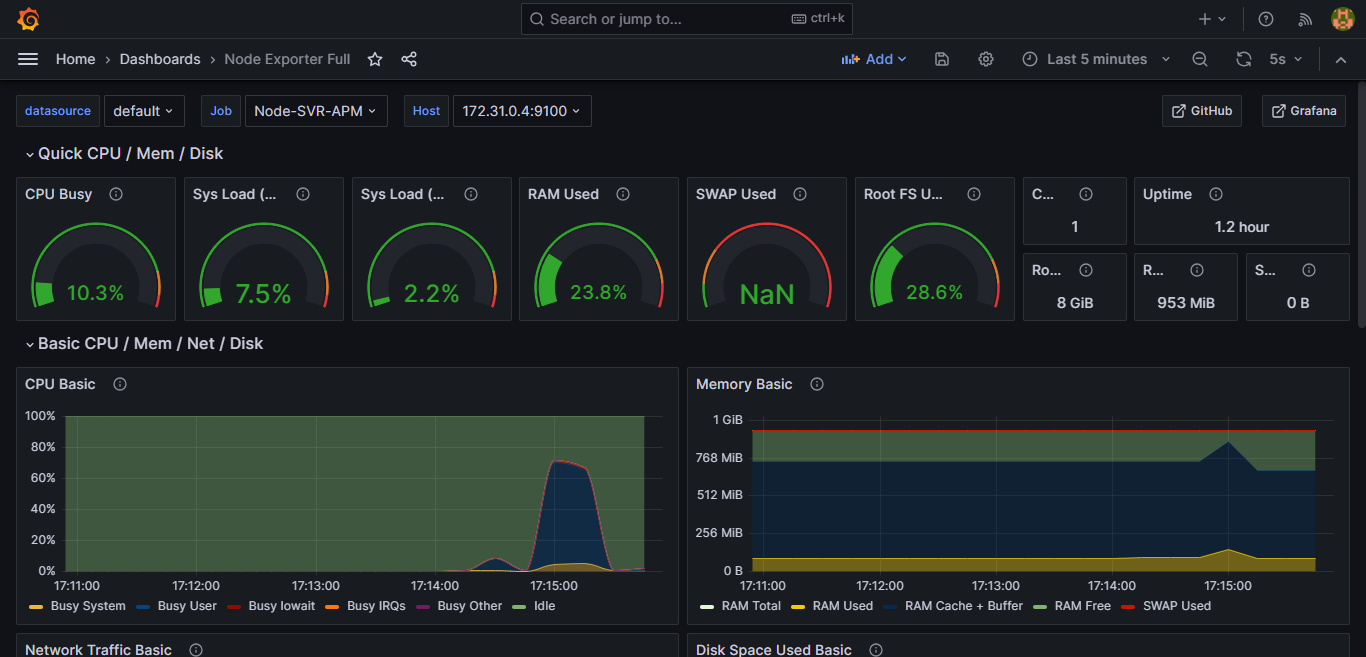
With that, we've successfully established a robust monitoring system utilizing the power of Prometheus and Grafana.
Subscribe to my newsletter
Read articles from Parvaze Masud directly inside your inbox. Subscribe to the newsletter, and don't miss out.
Written by

Parvaze Masud
Parvaze Masud
Hello there, I'm Parvaze Masud, and I'm passionate about all things DevOps! I'm not just a consumer of DevOps knowledge; I'm also a contributor. I regularly share my insights and experiences through blog posts and tutorials to give back to the community. I'm committed to helping others embark on their DevOps journey and providing guidance along the way. Let's connect and embark on this DevOps journey together. Feel free to follow me on Hashnode, where I'll be sharing in-depth articles, tutorials, and best practices in the DevOps realm. Let's collaborate, learn, and accelerate software delivery while maintaining reliability and stability. Thanks for joining me on this exciting DevOps adventure!